Dust and gas in carbon stars toward the Galactic Halo
Abstract
We present Spitzer IRS spectra of four carbon stars located in the Galactic Halo and the thick disc. The spectra display typical features of carbon stars with SiC dust emission and C2H2 molecular absorption. Dust radiative transfer models and infrared colors enable us to determine the dust production rates for these stars whilst prior CO measurements yield expansion velocities and total mass-loss rates.
The gas properties (low expansion velocities (around 7 km/s) and strong C2H2 molecular absorption bands) are consistent with the stars being metal-poor. However the dust content of these stars (strong SiC emission bands) is very similar to what is observed in metal-rich carbon stars. The strong SiC emission may indicate that the carbon stars derive from a metal-rich population, or that these AGB stars produce silicon.
The origin of the halo carbon stars is not known. They may be extrinsinc halo stars belonging to the halo population, they may have been accreted from a satellite galaxy such as the Sagittarius Dwarf Spheroidal Galaxy, or they may be escapees from the galactic disk. If the stars are intrinsically metal-rich, an origin in the disc would be most likely. If an -element enhancement can be confirmed, it would argue for an origin in the halo (which is known to be -enhanced) or a Galactic satellite.
keywords:
circumstellar matter – infrared: stars — carbon stars — AGB stars — stars: mass loss1 Introduction
Low- and intermediate-mass stars (LIMS, 0.8–8 M⊙ on the main sequence) end their lives with an intense mass-loss episode on the asymptotic giant branch (AGB). The mass loss from AGB stars is one of the main sources of enrichment of the interstellar medium (ISM) with newly synthesized elements. In our Galaxy, mass loss from AGB stars produces well over half of the measured dust (Gehrz, 1989). The AGB also dominates the measurable dust production in the LMC and SMC (Matsuura et al., 2009; Srinivasan et al., 2009; Boyer et al., 2012).
The mass-loss mechanism is not fully understood, but a two-step mechanism is widely accepted as plausible (e.g., Winters et al. 2000). Pulsation from the star extends the atmosphere, where the material is dense and cool enough to form dust. Radiation pressure drives the mass loss, accelerating the grains while the gas is carried along by friction. Dust formation is the key step in the mass-loss process. Its composition depends on the C/O ratio. If C/O 1, i.e. the star is carbon-rich, then most of the oxygen is trapped in volatile CO molecules, which have high dissociation energy. The dust forms from the remaining refractory elements, and consists of amorphous carbon and SiC. For C/O 1, the dust will be oxygen-rich, consisting of silicates and aluminium oxides..
Understanding the effect of metallicity on the mass loss is of prime importance to determining the yields of LIMS in different galaxies and understanding the formation of dust in the early Universe. We thus carried out several surveys of mass-losing AGB stars in the Local Group with the Spitzer Infrared Spectrograph (IRS Houck et al., 2004), targeting the Large Magellanic Cloud (LMC Zijlstra et al., 2006; Matsuura et al., 2006; Sloan et al., 2008), Small Magellanic Cloud (SMC Sloan et al., 2006; Lagadec et al., 2007; Sloan et al., 2008), and several dwarf spheroidal galaxies (Matsuura et al., 2007; Lagadec et al., 2009; Sloan et al., 2009, 2012).
The results show that dust-production rates from oxygen-rich AGB stars are lower in more metal-poor environments, but for carbon stars, metallicity shows no strong influence (Groenewegen et al., 2007; Sloan et al., 2008). Subtantial dust-production rates are observed for carbon stars with metallicities as low as 0.1 Z⊙ (Lagadec et al., 2008; Sloan et al., 2009, 2012).
Most of the material ejected via the mass-loss process is in the gaseous form. The gas mass in the envelope of an AGB star is typically two orders of magnitude higher than the dust mass to which our infrared surveys are sensitive. To fully characterize the mass loss from AGB stars and its dependence on metallicity, one needs to study the gas mass loss in environments with different metallicities.
Carbon stars have recently been discovered in the Galactic Halo. These are thought to be metal-poor (Totten & Irwin, 1998; Mauron et al., 2004, 2005, 2007). Groenewegen et al. (1997) observed the CO emission from a carbon star in the Halo. We recently observed a sample of carbon Halo stars in the CO J transition and found that their expansion velocities were low compared to AGB stars in the Galactic disc with similar infrared colors (Lagadec et al., 2010).
Here, we report new Spitzer IRS observations of four of these carbon stars. We place these observations in the context of our CO observations and additional IRS observations of three other likely carbon Halo stars.
2 The sample
Lagadec et al. (2010) observed six carbon stars in the Halo using the James Clerk Maxwell Telescope (JCMT) to study the CO J transition at 345 GHz. Those stars were selected from catalogs of carbon stars in the Halo by Totten & Irwin (1998), Mauron et al. (2004, 2005, 2007), and Mauron (2008). Each target had to be a bright source as observed by the Infrared Astronomical Satellite (IRAS) and have a color of 3–4. The near-infrared color requirement ensured that all of the dust shells had similar optical depths.
We selected five of the six JCMT targets as part of an IRS program for the final months of the cryogenic portion of the Spitzer mission. We obtained spectra for four of our sample before the cryogens were exhausted, with the fourth spectrum coming on 2009 May 15, the day that Spitzer ran out of liquid helium. In fact, this spectrum (of IRAS 08427) was the penultimate spectrum ever obtained by the IRS.
In this paper we also examine three additional carbon stars likely to be in the Halo. Sloan et al. (2010) published the IRS spectrum of Lyngå 7 V1 as part of their sample of AGB stars in globular clusters. Carbon stars are rare in globular clusters, making it possible that this star is in the foreground or background of the cluster. However, all estimates of its distance coincided with the position of the cluster. Lyngå 7 V1 could be either a carbon Halo star in the immediate vicinity of Lyngå 7, or it could actually be a member. Lagadec et al. (2009) published the spectra of several carbon stars in the Sagittarius Dwarf Spheroidal galaxy (Sgr dSph) (previously known as the Sagittarius Dwarf Elliptical Galaxy (SagDEG)), including IRAS 183843310 and IRAS 190743233 (herafter IRAS 18383 and IRAS 19074). The radial velocities of these two sources, as determined from optical spectra, showed that they were not members of Sgr dSph, and distance estimates placed them at least 10 kpc in the foreground.
Table 1 gives the observational properties of the nine probable carbon Halo stars observed with either JCMT or the IRS. For the six Halo stars with JCMT observations, the classifications of their membership in the thick disk, Halo, or Sagittarius Stream are from Lagadec et al. (2010), who used their radial velocities, distances, and galactic coordinates as indicators. The last two targets in the table, IRAS 18384 and IRAS 19074, are likely to be in the Halo, based on their radial velocities (23 and 73 km/s, respectively). Lyngå 7 V1 is only 400 pc from the Galactic plane, consistent with membership of the old disc or thick disc. We will revisit these assignments in Sec. 5.1 below.
| Name | RA | Dec | Gal. coordinates | F12 | Distance | Scale height | Possible | Observations | |||
|---|---|---|---|---|---|---|---|---|---|---|---|
| (J2000) | lII | bII | (mag) | (mag) | (Jy) | (kpc) | (kpc) | population | |||
| IRAS 041880122 | 04 21 27.25 | 01 29 13.4 | 192.2 | 32.0 | 6.42 | 3.28 | 3.37 | 6.5 | 3.4 | Thick Disc | JCMT/IRS |
| IRAS 084270338 | 08 45 22.27 | 03 27 11.2 | 223.5 | 26.8 | 6.26 | 3.41 | 6.50 | 5.5 | 2.5 | Thick Disc | JCMT/IRS |
| IRAS 113081020 | 11 33 24.57 | 10 36 58.6 | 273.7 | 47.8 | 4.57 | 3.83 | 57.37 | 2.5 | 1.9 | Thick Disc | JCMT |
| IRAS 125601656 | 12 58 33.50 | 16 40 12.0 | 312.3 | 79.4 | 7.82 | 3.48 | 0.77 | 12.0 | 11.8 | Sgr Stream | JCMT |
| Lyngå 7 V1 | 16 11 02.05 | 55 19 13.5 | 328.8 | 02.8 | 7.25 | 4.10 | 2.99 | 7.3 | 0.4 | Thick Disc | IRS |
| IRAS 163390317 | 16 36 31.5 | 03 23 35.0 | 12.7 | 27.8 | 6.10 | 3.91 | 14.57 | 4.9 | 2.3 | Halo | JCMT/IRS |
| IRAS 181204530 | 18 13 29.6 | 45 31 17.0 | 73.1 | 25.3 | 6.71 | 3.81 | 7.86 | 6.7 | 2.9 | Halo | JCMT/IRS |
| IRAS 183843310 | 18 41 43.50 | 33 07 16.6 | 1.9 | 12.6 | 8.58 | 3.00 | 0.80 | 15.0 | 3.3 | Halo | IRS |
| IRAS 190743233 | 19 10 39.87 | 32 28 37.3 | 5.0 | 17.9 | 8.35 | 3.61 | 1.73 | 14.5 | 4.5 | Halo | IRS |

All IRS observations used both the Short-Low (SL) and Long-Low (LL) modules to cover the wavelength range 5–37 m at resolutions of 100. Before extracting spectra from the IRS images, we (1) differenced them to remove background emission and additive spikes and divots, and (2) replaced pixels suspected of multiplicative spikes and divots with values calculated from neighboring pixels. We used the standard tapered-column extraction algorithm available with CUPID to obtain the spectra from the images.111CUPID is the Customizable User Pipeline for IRS Data, and it is available from the website of the Spitzer Science Center. When combining spectra from the two nod positions in each aperture, we flagged and ignored bad data which appeared in only one of the nods. The spectra were then corrected with scalar multiplication to remove discontinuities between spectral segments. These corrections were generally between 5 and 10%, but for IRAS 04188, the two SL segments were raised by 21 and 13% (for the 5–7.5 and 7.5–14 m segments, respectively), probably due to a slight mispointing. The spectral flux standards were HR 6348 (K0 III) in SL and HR 6348 and HD 173511 (K5 III) in LL. For more information, we refer the reader to the more detailed description of the observing method and data reduction by Sloan et al. (2012).222The only difference between their methodology and ours is that the brightness of our sample did not require the use of the optimal extraction algorithm introduced by Lebouteiller et al. (2010).
3 Description of the spectra
Fig. 1 displays the four infrared spectra obtained in our observing program, along with photometry from 2MASS (Cutri et al., 2003) and the Wide-field Infrared Survey Experiment (WISE Wright et al. (2010)). The spectra confirm all four sources as dusty carbon stars. Each shows a prominent SiC dust emission feature at 11.3 m, as well as absorption bands from acetylene (C2H2) at 7.5 and 13.7 m. The absorption band only partially covered by the IRS at 5 m is due to CO and is often strong in carbon stars. The continuum between these various features and bands is primarily due to emission from amorphous carbon grains. Some sources also display a broad 30 m feature. 333 We will refer to this feature as the ”MgS” feature, although the reader should be aware of the continuing debate about whether or not MgS produces the 30-m feature. See, for example, Hony et al. (2002), Zhang et al. (2009) and Lombaert et al. (2012).
To analyze these spectra, we apply the Manchester Method, which was introduced by Sloan et al. (2006) and Zijlstra et al. (2006). This method determines two colors from the spectra in four narrow bands. The [6.4][9.3] color is a good estimate of the optical depth of the warm dust, while the [16.5][21.5] color provides an estimate of the overall dust temperature. For all the observed stars, we measured the strength of the spectral features from SiC dust at 11.3 m and acetylene gas at 7.5 and 13.7 m using line segments to estimate the continuum. In each case, we defined the continuum using wavelength intervals to either side of the feature. We also measured the strength of the MgS dust emission at 30 m, but because the red edge of the feature is outside the IRS spectral range, we used a blackbody with the temperature derived from the [16.5][21.5] color to extrapolate the continuum under this dust feature. The strength of the dust features are reported as the ratio between the integrated flux in the feature and the continuum underneath it. For the SiC feature, we also report its integrated flux, scaled to a distance of 10 pc. For the acetylene bands, we report the equivalent widths. Table 2 presents all of these results.
To compare the strength of the observed features with ones in environments with different metallicities, we used a control sample of stars observed with the IRS and the SWS on the Infrared Space Observatory (ISO. This sample includes spectra from AGB stars in the Galaxy, LMC, SMC, Sgr dSph, and Fornax (see the references in Sec. 1). In all of the plots presented here, we use open symbols for Galactic stars. The symbols from largest to smallest represent stars in the Halo, the Thick Disc, and the Galactic SWS sample, respectively. Uncertainties were determined when coadding spectra extracted from individual images and propagated through all subsequent measurements. The uncertainties in the strengths of the feature in the IRS spectra include the effect of the uncertainty in the fitted continuum.
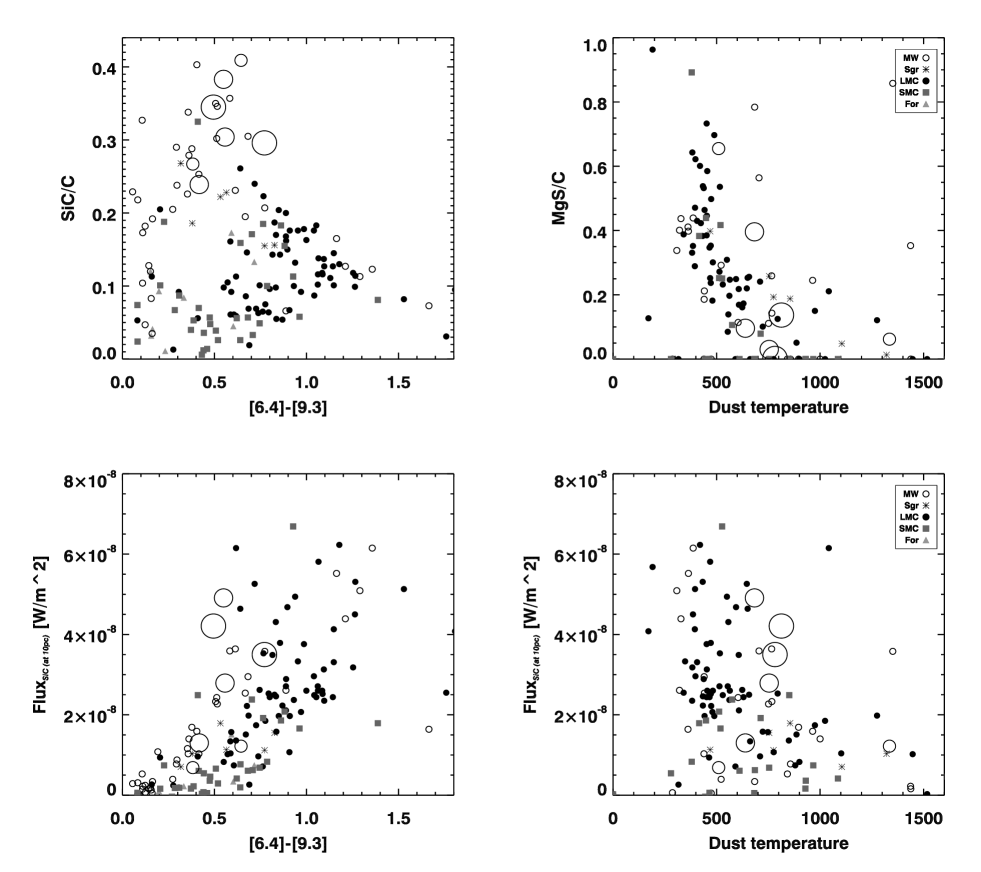
Fig. 2 shows the strength of the SiC and MgS dust features as a function of the [6.4][9.3] color and the temperature derived from the [16.5][21.5] color. The strength of the MgS feature is low for all the observed stars, most likely due to the relatively high dust temperatures of the Halo stars. MgS starts to form around 600 K and completes its formation around 300 K (Nuth et al., 1985). Fig. 2 shows that the dependence of the SiC feature on the dust temperature is less clear. SiC tends to be weaker at high temperature (between 1000 and 1500 K) than at low temperature (between 500 and 1000 K).
The upper left panel in Fig. 2 shows that the Galactic carbon stars follow one sequence in SiC/continuum strength as a function of [6.4][9.3] color, while the stars in the LMC, SMC, and Fornax follow another. Lagadec et al. (2007) explained these two sequences as a consequence of differences in the condensation of amorphous carbon dust at different metallicities. The Halo carbon stars in our sample follow the same sequence as the Galactic carbon stars, indicating a similar dust formation sequence and perhaps a similar metallicity as well.
The lower left panel in Fig. 2 shows the integrated fluxes of the SiC features, normalized to a common distance of 10 pc. While the separation between the two sequences is much smaller compared to the upper left panel, it is still apparent. Again, the Halo stars in our sample tend to follow the Galactic sequence. This plot removes the influence of the amorphous carbon continuum on the measured strength of the SiC feature and shows that in absolute terms, the feature is weaker in more metal-poor carbon stars.
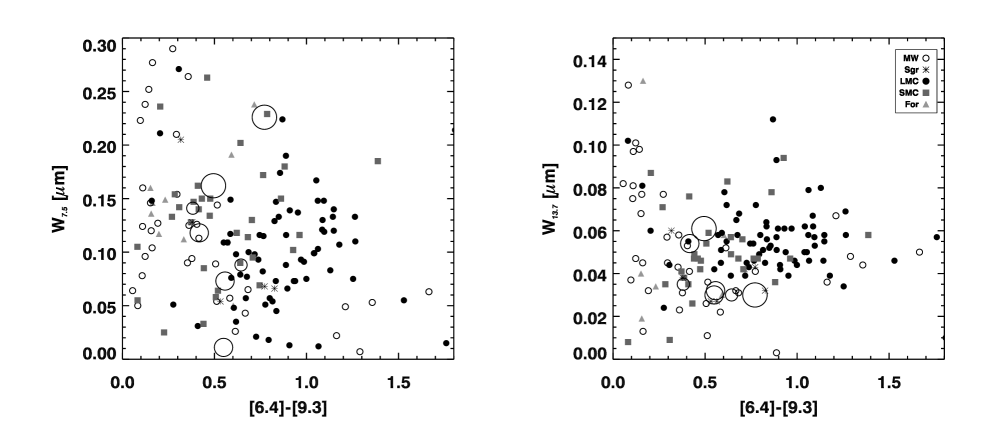
Fig. 3 displays the equivalent width of the 7.5 and 13.7 m C2H2 bands as a function of [6.4][9.3] color. In our small sample, the Halo stars have stronger 7.5 m acetylene bands than the stars assigned to the thick disc. To compare these stars to the other populations, it is necessary to limit the comparison to stars with similar [6.4][9.3] colors, since these have similar column densities of amorphous carbon dust around them. The two Halo stars show band strengths much like those in metal-poor environments like the SMC or Fornax, while the two thick disc stars are more similar to carbon stars in the LMC and the Galaxy. The comparisons of the 13.7 m feature are less instructive, because we only measure the narrow Q branch of the feature, which is saturated for high column densities.
Most of the spectroscopic studies based on IRS data referenced in this paper have noted the general tendency for the 7.5 m acetylene band to strengthen in more metal-poor samples. Matsuura et al. (2007) suggest that this trend is the result of higher C/O ratios in the outflows from the stars, but Sloan et al. (2012) have suggested it could result from less efficient dust formation. If high-temperature condensates such as TiC act as seeds for production of amorphous carbon grains from acetylene gas, the lower abundance of heavy elements like Ti in metal-poor carbon stars would lead to an excess of carbon-rich gas to carbon-rich dust.
| EW (7.5 m) | EW (13.7 m) | SiC flux at 10 pc | T | |||||
|---|---|---|---|---|---|---|---|---|
| target | [6.4][9.3] | [16.5][21.5] | (m) | (m) | SiC/cont. | (10-8 W m-2) | MgS/cont. | (K) |
| IRAS 04188 | 0.4170.009 | 0.2120.011 | 0.1180.011 | 0.0540.008 | 0.2390.007 | 1.300.04 | 0.0960.014 | 639 29 |
| IRAS 08427 | 0.5570.007 | 0.1760.012 | 0.0730.005 | 0.0320.003 | 0.3040.005 | 2.790.05 | 0.0300.015 | 754 45 |
| Lyngaå 7 V1 | 0.5490.007 | 0.1970.013 | 0.0110.004 | 0.0300.003 | 0.3830.009 | 4.910.11 | 0.3960.016 | 683 39 |
| IRAS 16339 | 0.4940.010 | 0.1630.015 | 0.1620.005 | 0.0610.005 | 0.3450.006 | 4.210.08 | 0.1370.019 | 813 65 |
| IRAS 18120 | 0.7710.007 | 0.1700.014 | 0.2260.006 | 0.0300.003 | 0.2960.004 | 3.500.04 | 0.0020.017 | 782 54 |
| IRAS 18384 | 0.3820.011 | 0.2730.010 | 0.1410.003 | 0.0350.003 | 0.2670.005 | 0.690.01 | 0.6550.013 | 510 16 |
| IRAS 19074 | 0.6440.005 | 0.0970.016 | 0.0880.003 | 0.0300.002 | 0.4090.006 | 1.220.02 | 0.0620.020 | 1335 188 |
4 Dust-production rates and gas mass-loss rates
4.1 Dust-production rates
To determine the dust-production rate (DPR, or ) from our carbon stars, we follow the approach of Lagadec et al. (2010), who use two techniques. The first method uses near- and mid-infrared flux of the stars (Whitelock et al., 1994, 2006; Lagadec et al., 2008). Whitelock et al. (2006) give the following relation:
| (1) | |||||
where is the 2MASS magnitude, and [12] is the IRAS 12 m magnitude, assuming a zero-magnitude flux of 28.3 Jy. We estimate the DPR from the total mass-loss rate by dividing by the assumed gas-to-dust ratio of 200. The relation obtained by Whitelock et al. (2006) assumes an expansion velocity of 19 km/s. We scale our results using the expansion velocity as measured by the JCMT.
The second method uses radiative transfer models. Here, we present new models using the Spitzer spectra as an additional constraint that was not available when Lagadec et al. (2010) generated the earlier models. We used the radiative transfer code DUSTY (Ivezic et al., 1999), as described by Lagadec et al. (2010). This code solves the one-dimensional radiative transport problem in a dusty environment. All of the models assume that the irradiation comes from a point source (the central star) at the center of a spherical dusty envelope. The circumstellar envelope is filled with material from a radiatively driven wind. All of the stars are carbon-rich, and the dust consists of amorphous carbon and SiC. Optical properties for these dust grains are taken from Hanner (1988) and Pegourie (1988), respectively. The grain size distribution is taken as a typical MRN distribution, with a grain size varying from 0.0005 to 0.25 m distributed according to a power law with n(), where =3.5 (Mathis et al., 1977). We are aware that this grain size distribution was estimated for the interstellar medium, where dust grains are thought to be significantly processed, but this is as good an assumption as any given the lack of information about dust grain sizes in these stars. The outer radius of the dust shell was set to 103 times the inner radius; this parameter has a negligible effect on our models.
To model the emission from the central star, we used a hydrostatic model including molecular opacities (Loidl et al., 2001; Groenewegen et al., 2007). Our aim was to fit the spectral energy distribution, defined by the 2MASS photometry (, and ) and our Spitzer data to estimate the DPRs. Our models included only dust, so we do not attempt to fit the molecular absorption bands seen in the Spitzer spectra. We fixed the dust temperature at the inner radius to be 1200 K and the effective temperature of the central star, Teff = 2800 K, unless a satisfactory fit could not be obtained with these parameters.
DUSTY gives total (gas+dust) mass-loss rates assuming a gas-to-dust ratio of 200. The DPR can be obtained by dividing by this value, assuming that the gas and dust have the same expansion velocities. The expansion velocity is an output for the DUSTY models, and we scaled our results using the expansion velocities measured with JCMT and assumed it to be 10 km.s-1 when no measurements were available.
Table 3 gives the results from the fitted DUSTY models. Note that where available, the DPRs determined from the [12] color are simply taken from Lagadec et al. (2010).
| Target | Luminosity | Teff | Tin | SiC/AmC | (11m) | Distance | ||
|---|---|---|---|---|---|---|---|---|
| (103L | (10-8M⊙yr-1) | (K) | (K) | 10-1 | (10-8M⊙yr-1) | kpc | ||
| IRAS 04188 | 8.0 | 0.8 | 2650 | 1700 | 0.10 | 2.3 | 1.0 | 6.5 |
| IRAS 08427 | 7.5 | 2.3 | 2800 | 1200 | 0.13 | 2.5 | 2.2 | 5.5 |
| IRAS 11308 | 16.8 | 2.9 | 2800 | 1200 | 0.00 | 1.6 | 2.4 | 2.5 |
| IRAS 12560 | 7.5 | 0.3 | 2800 | 1200 | 0.00 | 1.1 | 0.2 | 12.0 |
| Lyngå 7 V1 | 9.0 | 3.3 | 2800 | 1200 | 0.15 | 2.6 | 2.1 | 7.3 |
| IRAS 16339 | 13.9 | 1.2 | 2800 | 1400 | 0.14 | 2.3 | 1.8 | 4.9 |
| IRAS 18120 | 8.0 | 1.3 | 2800 | 1100 | 0.15 | 2.6 | 1.3 | 6.7 |
| IRAS 18384 | 11.5 | 2.6 | 2800 | 1200 | 0.10 | 1.1 | 0.9 | 14.5 |
| IRAS 19074 | 13.3 | 3.8 | 2800 | 1200 | 0.20 | 2.1 | 1.3 | 15.0 |
4.2 Gas mass-loss rates
| Target | |||||
|---|---|---|---|---|---|
| km s-1 | K km s-1 | 10-6M⊙yr-1 | |||
| IRAS 04188 | 11.5 | 0.77 | 6.8 | 846 | 677 |
| IRAS 08427 | 16.5 | 0.55 | 4.2 | 184 | 193 |
| IRAS 11308 | 11.5 | 10.86 | 13 | 456 | 551 |
| IRAS 12560 | 3.0 | 0.14 | 2.6 | 866 | 1300 |
| IRAS 16339 | 8.5 | 2.59 | 11 | 905 | 603 |
| IRAS 18120 | 6.5 | 0.72 | 5.4 | 415 | 415 |
Spectroscopic observations of the CO lines are our best means of determining the gas mass-loss rates from AGB stars. CO is, after H2, the most abundant circumstellar molecule (Olofsson, 1997) and can be used easily as a probe of the circumstellar medium. Since the 1980s, numerous works, combining such observations and radiative transfer models, have attempted to find a formula linking the CO line properties and the gas mass-loss rates (e.g. Knapp & Morris, 1985). From this point on, we will equate the total mass-loss rate with that determined from the gas.
Ramstedt et al. (2008) presented a reliable and up-to-date formula to determine the total mass-loss rate from CO observations:
| (2) |
where , , and are the CO line intensity (in K km s-1), the distance (in kpc), the expansion velocity (in km s-1) and the CO abundance, respectively. The parameters , , and depend on the CO transition observed. For the CO J 3 2 line, they are 3.810-11, 0.91, 0.39 and 0.45, respectively. is the full width at half maximum (FWHM) of the main beam of the telescope, which is 14 arcsec at JCMT. We adopted the standard solar abundance of 8.7810-4 for fCO (Asplund et al. (2009)). This value could be lower as, in metal-poor environments, less oxygen is present to form CO, making the CO abundance with respect to H2 lower. That would make the total mass-loss rates higher than what we have determined below. Thus, the total mass-loss rates we estimate are lower limits.
Table 4 shows the properties of the CO lines observed by Lagadec et al. (2010) and the total mass-loss rates they derived. One of the star from our sample, IRAS 12560, was previously observed in the CO J 2 1 line by Groenewegen et al. (1997). They derived a total mass-loss rate of 0.810-6M⊙yr-1, which agrees fairly well with our estimate of 1.310-6M⊙yr-1.
Knowing the total mass-loss rate and the DPR allows us to estimate the gas-to-dust mass ratio . Assuming that the outflow velocities of the dust and gas are the same, is simply the ratio of the total mass-loss rate to the DPR. Table 4 presents our estimates for using the DPRs from the radiative transfer models (), and infrared colors ().
5 Discussion
5.1 Expansion velocities
Lagadec et al. (2010) showed that the Halo carbon stars they observed have a rather high total mass-loss rate but a low expansion velocity. This result agrees with theoretical predictions by (Wachter et al., 2008) that the expansion velocity of carbon stars decreases at lower metallicity while the mass-loss rate remains stable. They argue that these trends arise from less efficient dust formation at low metallicity. As the dust accelerates the winds less efficiently at low metallicity, the expansion velocities of the envelopes are lower. But only a moderate amount of dust is needed to accelerate the wind. Once this threshold is reached, the mass-loss rate will remain constant. Fig. 4 shows the expansion velocity as a function of the total mass-loss rates for Galactic disc stars (open symbols) and our sample (filled symbols). The values for stars in the Galactic disc are from Loup et al. (1993). The observations used for these work were also made in CO.
At a given mass-loss rate, stars from the Halo and the Sagittarius Stream have a low expansion velocity. The star with an expansion velocity of 16.5 km s-1 (IRAS 08427) belongs to the thick disc, as well as the two stars with expansion velocities of 11.5 km s-1 (IRAS 04188 and IRAS 11308). These stars do not appear as outliers in this figure, even though their expansion velocities are in the lower part of the observed range.
The stars from the Sagittarius Stream and the Halo are clear outliers and have low expansion velocities for their mass-loss rates. This work thus extends the conclusion drawn by Lagadec et al. (2009), who studied the DPRs only. The millimeter CO studies give a picture that somewhat contradicts the conclusions drawn from the infrared. While the infrared spectral properties are consistent with a metal-rich character, the low outflow velocities are much more typical of metal-poor stars.

5.2 Gas-to-dust mass ratios
Observations of CO with JCMT allow us to measure the total mass-loss rates of stars, while infrared observations enable us to determine their DPRs. We can thus estimate their gas-to-dust mass ratio . As the metallicity of the individual stars we observed is not known we assume a solar value for the CO abundances, so that the total mass-loss rates we derived have to be seen as lower limits. Thus, the gas-to-dust mass ratios are also lower limits. The estimated values of range from 200 (the value typically assumed for Galactic stars) to 1300. The upper range of our estimates for is high, as might be expected for metal-poor stars, where we expect less dust to form for a given amount of gas. IRAS 08427 has a gas-to-dust ratio close to the canonical Galactic value of 200. This star belongs to the thick disc and has the highest expansion velocity and the lowest in our sample.
Some caution is warranted when drawing conclusions from such small samples, but these observations are pointing to high gas-to-dust mass ratios and low expansion velocities in carbon stars in the Halo. To generalize, the gas-to-dust mass ratios of carbon stars appear to increase at lower metallicities. Such a trend is expected from a theoretical point of view (van Loon, 2000; Wachter et al., 2008), as dust formation is expected to be less efficient in metal-poor environments.
IRAS 04188 is an outlier, as it is a thick disc star with a high gas-to-dust ratio. It is interesting to note that the spectral energy distribution of this star could not be fitted with the same standard parameters as the other stars. A rather cool star (2650 K) was needed for the fit, as well as very hot dust (1700 K) for the dust inner radius.
For some of the thick disc stars we observed, is quite large. We measured by assuming that the drift velocity (the difference between the dust and the gas velocity) is equal to zero. If the outflow velocities of the gas and dust were decoupled, then the actual value for would be smaller than indicated here. Such a decoupling would require less efficient transfer of momentum from the radiatively accelerated dust grains to the gas in more metal-poor environments, which might be possible if the grain-size distribution were shifted to larger grains. We note that the coupling efficiency is determined primarily by the gas density.
5.3 Metallicity of the Galactic halo carbon stars
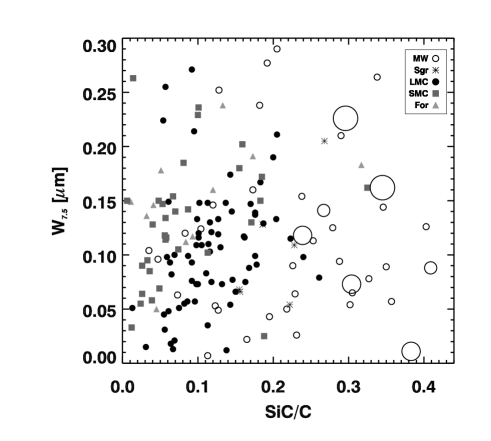
Fig. 5 displays the equivalent width of the 7.5 m absorption band from C2H2 as a function of the strength of the SiC dust emission feature. Lagadec et al. (2009) introduced this plot and showed that it can diagnose the metallicity of carbon stars observed spectroscopically in the infrared. Despite some scatter and mixing between the populations, the carbon stars from the Milky Way are clearly concentrated toward the lower right corner. Moving progressively up and to the left, one moves through the region dominated by the LMC, followed by the SMC. The Fornax stars trace the same region as the SMC, consistent with the similar metallicities of the carbon stars sampled with the IRS to those in the Magellanic Clouds, as described by Sloan et al. (2012). The position of stars on this diagram depends also on its initial mass, sp that it can be use only as an indication of the metallicity in the present case.
The carbon stars from our sample, both in the thick disc and Halo, as well as our two comparison stars in the foreground of the Sgr dSph and the one star near Lyngå 7 V1, occupy the same region as the Galactic carbon stars.
As mentioned in Section 3, decreasing the initial metallicity tends to lead to a higher C/O ratio and thus stronger C2H2. This would also decrease the initial abundance of Si and thus decrease the SiC strength. But silicon, being a heavy -element, it is not synthetized in AGB stars. The location of the star on the diagram Fig. 5 thus not only depends on [Fe/H] but also on the initial -element abundance.
On the other hand, observations of C-rich post-AGB stars with the 21 microns feature in the Galaxy and the Magellanic Clouds (Decin et al., 1998; De Smedt et al., 2012 and references therein) indicate that metal-poor carbon stars can have significantly enhanced C, O and Si abundances. Such an enhancement would explain the strong SiC feature observed in the metal poor carbon stars we observed in the halo. However, it is not clear why metal-poor carbon stars would produce more Si in the halo than in other galaxies of the Local Group, as we have shown AGB stars in the SMC, LMC, Fornax and Sculptor had a weaker SiC feature than Galactic stars.
Enrichment of the ISM by Type II supernovae, which are known producers of elements is a tempting explanation, but the known behavior of [/Fe] as a function of [Fe/H], as illustrated by Tolstoy et al. (2009, see their Fig. 11) is not consistent with our spectra. The [/Fe] abundance increases by one decade while [Fe/H] drops by two decades. In terms of absolute abundance, [/H] is decreasing at lower metallicities. The bottom panels of Fig. 2 contradict this expected behavior. They show that the SiC features in our Halo and thick disc spectra are strong compared to most of the other spectra in absolute terms and not just as a ratio to amorphous carbon, as shown in the upper panels.
The two Halo stars observed with Spitzer and JCMT appear to have a low expansion velocity (an indication that they are metal-poor) and a very strong SiC feature. Those stars could thus either be similar to Galactic disc stars or metal-poor and -element enhanced.
5.4 Origin of the Galactic halo carbon stars
The typical age of halo stars is 10 Gyr, so no AGB stars more massive than 1 M⊙ formed in the Halo should be observable now. Models of AGB stars with such a low mass do not dredge up enough carbon to make the stars carbon-rich. But carbon-rich stars are observed in the halo (Totten & Irwin, 1998; Mauron, 2008). The fact that we observe carbon stars in the halo could be a clue that these models are not right, or that these stars were formed outside of the halo. Comparing the luminosity of the star we observed with Fig. 20 from (Vassiliadis & Woods 1993) indicates that the initial masses of the stars in our sample are between 2 and 3M⊙. This is one more indication that those stars might have formed outside the Galactic halo. We propose two possible external origins for these halo carbon stars.
It has been proposed that carbon AGB stars in the halo could originate from the tidal disruption of Sgr dSph Galaxy, orbiting the Milky Way with a period of about 1 Gyr (Ibata et al. 2001). Their model of the Sgr dSph stream shows a good agreement between the orbit of the stream and those of observed carbon stars.
Out of the three halo stars we observed with the JCMT, one, IRAS 12560, likely belongs to the Sagittarius stream (Lagadec et al. 2010) and thus originates from Sgr dSph. These three Halo stars have a very low envelope expansion velocity, indicative of a metal-poor nature (Lagadec et al. 2010). The Spitzer spectra we present here show that those stars present strong C2H2 absorption bands, as observed in metal-poor carbon stars (see e.g. Sloan et al. 2009). These two arguments strongly support the hypothesis that these stars are metal-poor. As shown in Section 5.3, the halo carbon stars we observed could be enhanced in -elements. They would thus have formed in a burst-like stellar population. As they are carbon stars, this population is necessarly younger than the halo itself. The Sgr dSph have such a stellar population. The halo carbon stars we observed may thus come from the Sgr dSph galaxy or a similar galaxy orbiting the Milky Way. The fact that the dust properties of the Sgr dSph carbon stars are very similar (Lagadec et al. 2009) supports this argument. This galaxy contains a metal-rich population (Kniazev et al. 2007) but it is not known whether this population is represented in the tidal tails.
But those stars could also be similar to Galactic disc stars (Section 5.3). This leads naturally to the question of how stars formed near the Galactic plane could wind up several kpc above or below it. They could be runaways from the thin disc. One interesting scenario is that they may have been ejected from the break-up of a binary, possibly as a result of the interaction of a binary and a single star, as suggested for more massive runaways (e.g., Hoogerwerf et al., 2001; Fujii & Portegies Zwart, 2011). While carbon stars are bright and easily detected, they represent perhaps one thousandth of a star’s total lifetime. This would point to a larger population of less evolved intermediate-mass stars now in the Halo, but relatively metal-rich.
To discriminate the two possibilities, we would need to obtain measurements of [Fe/H] and different -elements abundances for the stars we observed. Such measurements are made difficult by the fact that those stars are very faint in the optical.
A final possibilty is that these are extrinsic carbon stars, with the carbon enrichnent caused by mass transfer from a more massive, faster evolving companion.
6 Conclusions
We presented Spitzer IRS spectra of four Galactic disc and halo carbon stars. Typical features of carbon stars with SiC dust emission and C2H2 molecular absorption are seen in the four spectra. Dust radiative transfer models enabled us to determine the dust-production rates for these stars. We measured the gas mass-loss rates and expansion velocities from the stars via modeling of the CO J transition. The gas-to-dust mass ratio was then measured by simply dividing the gas and dust mass-loss rates. The measured mass-loss rates and are in the range 1–4 10-6M⊙yr-1 and 200–1300 respectively. The stars in the halo have a low expansion velocity (around 7 km/s), strong C2H2 molecular absorption bands, strong SiC emission and a high gas-to-dust mass ratios.
The strong SiC emission we observe could be due to an overabundance of -elements (like silicon) in the Halo, that these stars produce silicon or to the fact that those stars metallicities similar to the Galactic disc. In the latter case, they may have escaped from the disc. The low expansion velocities and strong C2H2 absorption bands are arguments in favor of the former. However, explaining the enhancement in the Halo is a challenge. We conclude that these spectra present us with some intriguing contradictions, with the dust properties being similar to metal-rich carbon stars and the gas properties similar to metal-poor carbon stars.
Those AGB stars could have formed outside of the Halo, as the mass of these carbon stars is inconsistent with a formation in the Halo. The halo carbon AGB stars we observed could thus have two possible origins. They could have formed in a galaxy similar to Sgr dSph, orbiting the Milky Way and being gradually stripped by tidal forces or they could have escaped from the Galactic disc.
This work has shown the necessity to combine mid-infrared spectroscopy with millimeter CO observations to fully characterize the dust production and gas mass-loss from AGB stars. Observations of metal-poor AGB stars in Local Group dwarf galaxies are necessary to study the dependence of this mass-loss on metallicity. The Atacama Large Millimeter/submillimeter Array (ALMA) will allow such observations. Finally near-infrared spectroscopy of the individual stars will be necessary to precisely determine the metallicity and -element abundances of the observed stars.
Acknowledgments
The research leading to these results has received funding from the European Community’s Seventh Framework Programme (/FP7/2007-2013/) under grant agreement No 229517. These observations were obtained as guaranteed time for the IRS team at Cornell, who are supported by by NASA through Contract Number 1257184 issued by the Jet Propulsion Laboratory, California Institute of Technology under NASA contract 1407. The research in this paper has benefited from NASA’s Astrophysics Data System, and the SIMBAD and VIZIER databases, operated at the Centre de Données astronomiques de Strasbourg.
References
- Boyer et al. (2012) Boyer, M. L., Srinivasan, S., Riebel, D., McDonald, I., van Loon, J. Th., Clayton, G. C., Gordon, K. D., Meixner, M., Sargent, B. A., & Sloan, G. C. 2012, ApJ, in press.
- Cutri et al. (2003) Cutri, R. M., et al., 2003, The IRSA 2MASS All-Sky Point Source Catalog, NASA/IPAC Infrared Science Archive, 2003, A&A, 406, 51
- Fujii & Portegies Zwart (2011) Fujii, M. S., & Portegies Zwart, S. 2011, Science, 334, 1380
- Gehrz (1989) Gehrz, R. D., 1989, in Interstellar Dust, Proc. IAU Symp. 135, ed. L. J. Allamandola & A. G. G. M. Tielens (Dordrecht: Kluwer), 445
- Groenewegen et al. (1997) Groenewegen, M. A. T., Oudmaijer, R. D., Ludwig, H.-G., 1997, A&A, 292, 686
- Groenewegen et al. (2007) Groenewegen, M. A. T., et al., 2007, MNRAS, 376, 313
- Hanner (1988) Hanner, M. 1988, Infrared Observations of Comets Halley and Wilson and Properties of the Grains, 22
- Houck et al. (2004) Houck, J. R., et al. 2004, ApJS, 154, 18
- Hony et al. (2002) Hony, S., Waters, L. B. F. M., & Tielens, A. G. G. M. 2002, A&A, 390, 533
- Hoogerwerf et al. (2001) Hoogerwerf, R., de Bruijne, J. H. J., & de Zeeuw, P. T. 2001, A&A, 365, 49
- Ibata et al. (2001) Ibata, R., Lewis, G. F., Irwin, M., Totten, E., & Quinn, T. 2001, ApJ, 551, 294
- Ivezic et al. (1999) Ivezic, Z., Nenkova, M., & Elitzur, M., User manual for DUSTY, University of Kentucky internal report
- Knapp & Morris (1985) Knapp, G. R., & Morris, M. 1985, ApJ, 292, 640
- Kniazev et al. (2008) Kniazev, A. Y., Zijlstra, A. A., Grebel, E. K., et al. 2008, MNRAS, 388, 1667
- Lagadec et al. (2007) Lagadec, E., et al. 2007, MNRAS, 376, 1270
- Lagadec et al. (2008) Lagadec, E., Zijlstra, A. A., Matsuura, M., Menzies, J. W., van Loon, J. T., & Whitelock, P. A. 2008, MNRAS, 383, 399
- Lagadec & Zijlstra (2008) Lagadec, E., & Zijlstra, A. A. 2008, MNRAS, 390, L59
- Lagadec et al. (2009) Lagadec, E., et al. 2009, MNRAS, 549
- Lagadec et al. (2010) Lagadec, E., Zijlstra, A. A., Mauron, N., et al. 2010, MNRAS, 403, 1331
- Lebouteiller et al. (2010) Lebouteiller, V., Bernard-Salas, J., Sloan, G. C., & Barry, D. J. 2010, PASP, 122, 188
- Loidl et al. (2001) Loidl, R., Lançon, A., & Jørgensen, U. G. 2001, A&A, 371, 1065
- Loup et al. (1993) Loup, C., Forveille, T., Omont, A., & Paul, J. F. 1993, A&AS, 99, 291
- Marshall et al. (2004) Marshall, J. R., van Loon, J. T., Matsuura, M., Wood, P. R., Zijlstra, A. A., & Whitelock, P. A. 2004, MNRAS, 355, 1348
- Matsuura et al. (2007) Matsuura, M., et al. 2007, MNRAS, 382, 1889
- Matsuura et al. (2009) Matsuura, M., Barlow, M. J., Zijlstra, A. A., et al. 2009, MNRAS, 396, 918
- Mauron et al. (2004) Mauron, N., Azzopardi, M., Gigoyan, K., Kendall, T. R., 2004, A&A, 418, 77
- Mauron et al. (2005) Mauron, N., Kendall, T. R., Gigoyan, K., 2005, A&A, 438, 867
- Mauron et al. (2007) Mauron, N., Kendall, T. R., Gigoyan, K., 2007, A&A, 475, 843
- Mauron (2008) Mauron, N. 2008, A&A, 482, 151
- Mathis et al. (1977) Mathis, J. S., Rumpl, W., & Nordsieck, K. H. 1977, ApJ, 217, 425
- Matsuura et al. (2006) Matsuura, M., Wood, P. R., Sloan, G. C.. Zijlstra, A. A., van Loon, J. Th., Groenewegen, M. A. T., et al., 2006, MNRAS, 371, 415
- Nuth et al. (1985) Nuth, J. A., Moseley, S. H., Silverberg, R. F., Goebel, J. H., & Moore, W. J. 1985, ApJl, 290, L41
- Olofsson (1997) Olofsson, H. 1997, ApSS, 251, 31
- Pegourie (1988) Pégourié, B. 1988, A&A, 194, 335
- Ramstedt et al. (2008) Ramstedt, S., Schöier, F. L., Olofsson, H., & Lundgren, A. A. 2008, A&A, 487, 645
- Sbordone et al. (2007) Sbordone, L., Bonifacio, P., Buonanno, R., et al. 2007, A&A, 465, 815
- Sloan et al. (2006) Sloan, G. C., Kraemer, K. E., Matsuura, M., Wood, P. R., Price, S. D., Egan, M. P., 2006, ApJ, 645, 1118
- Sloan et al. (2008) Sloan, G. C., Kraemer, K. E., Wood, P. R., Zijlstra, A. A., Bernard-Salas, J., Devost, D., & Houck, J. R. 2008, ApJ, 686, 1056
- Sloan et al. (2009) Sloan, G. C., et al. 2009, Science, 323, 353
- Sloan et al. (2010) Sloan, G. C., Matsunaga, N., Matsuura, M., et al. 2010, ApJ, 719, 1274
- Sloan et al. (2012) Sloan, G. C., et al. 2012, ApJ, submitted
- Soubiran et al. (2003) Soubiran, C., Bienaymé, O., & Siebert, A. 2003, A&A, 398, 141
- Srinivasan et al. (2009) Srinivasan, S., Meixner, M., Leitherer, C., et al. 2009, AJ, 137, 4810
- Tolstoy et al. (2009) Tolstoy, E., Hill, V., & Tosi, M. 2009, ARA&A, 47, 371
- Totten & Irwin (1998) Totten, E. J., & Irwin, M. J. 1998, MNRAS, 294, 1
- van Loon (2000) van Loon, J. T. 2000, A&A, 354, 125
- Wachter et al. (2008) Wachter, A., Winters, J. M., Schröder, K.-P., & Sedlmayr, E. 2008, A&A, 486, 497
- Whitelock et al. (1994) Whitelock, P., Menzies, J., Feast, M., Marang, F., Carter, B., Roberts, G., Catchpole, R., & Chapman, J. 1994, MNRAS, 267, 711
- Whitelock et al. (2006) Whitelock, P. A., Feast, M. W., Marang, F., & Groenewegen, M. A. T. 2006, MNRAS, 369, 751
- Winters et al. (2000) Winters, J. M., Le Bertre, T., Jeong, K. S., et al., 2000, A&A, 361, 641
- Wright et al. (2010) Wright et al. 2010, AJ, 140, 1868
- Zhang et al. (2009) Zhang, K., Jiang, B. W., & Li, A. 2009, ApJ, 702, 680
- Zijlstra et al. (2006) Zijlstra, A. A., et al. 2006b, MNRAS, 370, 1961