Flare emission from Sagittarius A*
Abstract
Based on Bremer et al. (2011) and Eckart et al. (2012) we report on simultaneous observations and modeling of the millimeter, near-infrared, and X-ray flare emission of the source Sagittarius A* (SgrA*) associated with the super-massive (4106M⊙ ) black hole at the Galactic Center. We study physical processes giving rise to the variable emission of SgrA* from the radio to the X-ray domain. To explain the statistics of the observed variability of the (sub-)mm spectrum of SgrA*, we use a sample of simultaneous NIR/X-ray flare peaks and model the flares using a synchrotron and SSC mechanism. The observations reveal flaring activity in all wavelength bands that can be modeled as the signal from adiabatically expanding synchrotron self-Compton (SSC) components. The model parameters suggest that either the adiabatically expanding source components have a bulk motion larger than vexp or the expanding material contributes to a corona or disk, confined to the immediate surroundings of SgrA*. For the bulk of the synchrotron and SSC models, we find synchrotron turnover frequencies in the range 300-400 GHz. For the pure synchrotron models this results in densities of relativistic particles of the order of 106.5cm-3 and for the SSC models, the median densities are about one order of magnitude higher. However, to obtain a realistic description of the frequency-dependent variability amplitude of SgrA*, models with higher turnover frequencies and even higher densities are required. We discuss the results in the framework of possible deviations from equilibrium between particle and magnetic field energy. We also summarize alternative models to explain the broad-band variability of SgrA*.
1 Introduction
Sagittarius A* (SgrA*) is the closest super-massive black hole (SMBH) and is the prime candidate to study the variability and spectral properties of accreting SMBHs. Since it is at the center of the Milky Way at a distance of about 8 kpc, Doeleman et al. (2008, 2009) and Fish et al. (2011) have recently succeeded in obtaining structural information on event-horizon scales through very long baseline interferometry (VLBI) at 1.3 mm wavelength. SgrA* is strongly variable in the radio and millimeter wavelength regime (Zhao et al. 2003; Mauerhan et al. 2005; Eckart et al. 2008ac; Marrone et al. 2008; Li et al. 2009; Yusef-Zadeh et al. 2008, 2009). It shows an inverted spectrum from the radio to the (sub-)millimeter domain (Falcke et al. 2000) and displays order-of-magnitude flares in the infrared and X-ray domain (Baganoff et al. 2001, 2003; Genzel et al. 2003; Eckart et al. 2004, 2006a, 2010, Ghez et al. 2003, 2004). The sub-mm spectrum of SgrA* itself is rather unexplored owing to the difficulty of separating it from contributions of the surrounding ”mini-spiral” and the circum-nuclear disk (CND).
While the so-called sub-millimeter bump is attributed to SgrA* and is thought to be due to relativistic, thermal electrons of a hot, thick, advection-dominated accretion flow (Dexter et al. 2009, 2010; Narayan et al. 1995; Yuan et al. 2003), it is, however, currently unclear whether the radio spectrum is due to contributions from an accretion flow (Yuan et al. 2003), due to a jet (Falcke & Markoff 2000), or a combination of both. The strong variability observed at radio to X-ray emission is most likely due to synchrotron and/or synchrotron self-Compton (SSC) radiation. Part of the radiation may be due to a single hot-spot or a multi-spot model in the mid-plane of the accretion flow or an increased accretion rate (see models by Broderick & Loeb 2006 and Eckart et al. 2006b, 2011, Meyer et al. 2007, Yuan et al. 2008, see also Pecháček et al. 2008, Shcherbakov & Baganoff 2010, Dexter et al. 2010, Zamaninasab et al. 2011). Spiral arm models (e.g. Karas et al. 2007) or jet/jet-base models (Falcke & Markoff 2000, Markoff 2005, Markoff et al. 2007) are also possible. Another result from multi-wavelength observations of SgrA* is that the process of adiabatic expansion of source components may be relevant (Eckart et al. 2006a, 2008abc, 2009, 2010, 2012, Yusef-Zadeh et al. 2006a, 2008, 2009). Here we assume that the sub-mm, NIR and X-ray flux excursions are physically related (However, see a detailed discussion on this in section 5.3 in Eckart et al. 2012). This expansion can explain the observed time lags between the infrared/X-ray and millimeter emission peaks. The fact that one observes different time delays between NIR and sub-mm flares can be understood as a consequence of a spread in source sizes and synchrotron turnover frequencies. The idea of adiabatic expansion is supported by the fact that there is no conclusive observational evidence for sub-mm flares preceeding NIR events and by the fact that it has been detected at radio cm-wavelengths (Yusef-Zadeh et al. 2006ab). Here we summarize results obtained for simultaneous flare emissions in the NIR and X-ray with implications to the observed radio variability. In this summary we include the analysis of the NIR spectral index under the assumption that especially for weak flares synchrotron losses are important. A detailed description of the Synchrotron/SSC analysis is given in Eckart et al. (2012). Throughout the article we use .
2 Observations
The analysis summarized in this paper is based on Bremer et al. (2011) and Eckart et al. (2012) who have studied a sample of NIR H- and Ks-band flares and a sample of all X-ray flares (until 2010) that showed within less than about 10 minutes a near-infrared emission peak. The detailed flare data are listed in Tab.3 by Eckart et al. (2012). In this paper we use a consistent calibration based on the extinction value of =2.46 (Schödel et al. 2010). For the L’-band flares (Dodds-Eden et al. 2009; Trap et al. 2011ab), we used =1.23 (Schödel et al. 2010) and extrapolated to the Ks-band with a spectral index of +0.70.3 (Hornstein et al. 2007, see also Bremer et al. 2011).
3 Interpretation
3.1 The NIR spectral index
Bremer et al. (2011) point out that the broad-band near-infrared spectral index is an essential quantity to investigate the physical mechanism that underlies the observed SgrA* flare emission. The authors present a method to derive the NIR spectral index of SgrA* between the H- and Ks-band from the statistics of the peak flux density of the SgrA* flares. They base their spectral index derivation on an unprecedentedly large time-base of about seven years of monitoring the infrared counterpart of SgrA*. The underlying assumption is that for SgrA* in both NIR bands the same optically thin, dominant emission mechanism is at work and produces similar number distributions of flares. The author could then cross-correlate the peak flare flux histograms and determine the expectation value of the H-Ks-band spectral index during the bright flare phases of SgrA*. (For a detailed analysis of the possible contribution of stars within the central arcseconds to the flux density at (of close to) the position of SgrA* and the statistical analysis of K-band light curves see Sabha et al. 2012 and Witzel et al. 2012).
Using this method, Bremer et al. (2011) can confirm that the spectral index for brighter flares is consistent with =+0.7 which is indicative of optically thin synchrotron radiation. In addition the authors find a tendency for the weaker flares to exhibit a steeper near-infrared spectrum. From this they can conclude that the distribution of spectral indices as a function of peak Ks-band flare flux density can successfully be represented by an exponential cutoff proportional to , were is a characteristic cutoff frequency. Such a cutoff is expected if synchrotron losses are at work. If varies between the NIR and sub-mm wavelength domain, and if the peak flare sub-mm flux density variation is about one Jansky, then the model explains the observed spectral properties of SgrA* in the NIR. For the model calculations we assume that the intrinsic optically thin spectral index of these synchrotron flares is =+0.70.3. The spectral index cannot be substantially steeper in order not to violate the MIR flux density limit (Schödel et al. 2007, 2011). For a peak flare flux density in the Ks-band of 7-6 mJy, the spectral index of +0.7 results in a 1.5 mJy flux density difference with respect to the H-band. This corresponds to a 3 quantity for the relative calibration uncertainty of about 10% between the two NIR bands. For the combined 30 flares per Ks- and H-band the flux density differences due to the +0.7 spectral index is significant for the bulk of the detected flares.
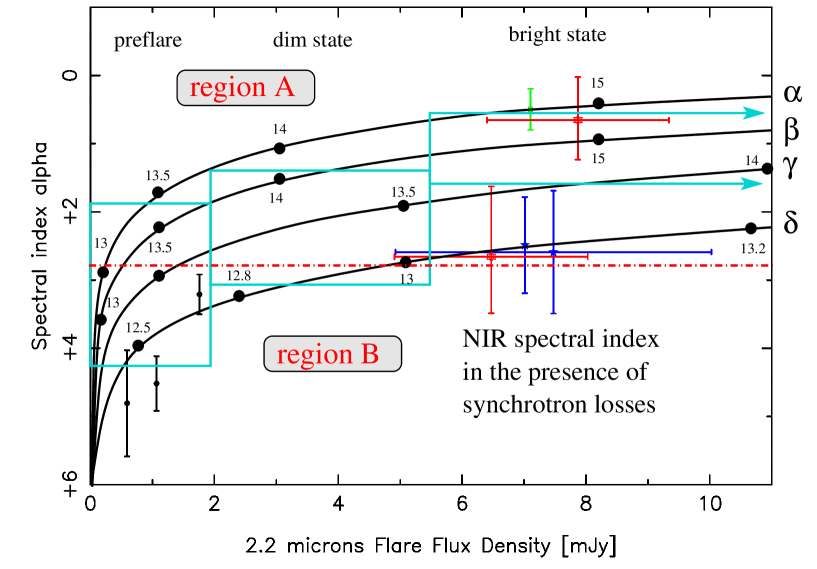
Fig. 1 shows the relation between the H-Ks-band spectral index and the observed Ks-band peak flux density as obtained for a power law assuming an exponential cutoff due to synchrotron losses. The thick solid black curves show model calculations that cover the expected spectral synchrotron indices and a 1 THz flare strength corresponding to the degree of variability observed at high frequencies. Model is based on a power law spectral index of =+0.4 and a flux of 0.071 Jy at 1 THz. As laid out in Eckart et al. (2012) we used for model a value of =+0.8 and 0.5 Jy, for model values of =+0.6 and 0.76 Jy, and for model values of =+0.4 and 1.4 Jy. Above a Ks-band flux density of 12 mJy, models , , and have flux densities above 8.5 mJy, and model has a 8.6 m flux densities above the 22 mJy flux limit (Schödel et al. 2007, Schödel et al. 2011) at which SgrA* has not yet been detected.
In Fig. 1 we also show rectangular boxes that mark the flux densities and NIR spectral index ranges obtained from the broad-band NIR spectroscopy (Gillessen et al. 2006) from the H-/K’-imaging (Hornstein et al. 2007, see also Bremer et al. 2011). The values that correspond to the blue boxes are given in Tab.4 of Bremer et al. (2011). In region A the sub-mm/NIR flares are brighter and have flatter synchrotron spectra. The synchrotron loss turnover frequencies are well above 1013Hz. In region B the sub-mm/NIR flares are weaker and steeper, with synchrotron loss turnover frequencies are below 1013Hz.
3.2 NIR/X-ray flares
In Eckart et al. (2012) we have described physical and statistical aspects of the relation between sub-mm and NIR/X-ray flare emission of SgrA*. For most synchrotron and SSC models, the authors find synchrotron turnover frequencies in the range of 300-400 GHz. For the pure synchrotron models this gives densities of relativistic particles of the order of 106.5cm-3. For the pure SSC models, the median densities are about one order of magnitude higher. In order to obtain, however, a realistic description of the frequency-dependent variability amplitude of SgrA*, we require models with substantially higher turnover frequencies and higher densities.
3.2.1 Formalism
Eckart et al. (2012) adopt the formulae previously presented by Marscher (1983, 2009). For the case of the Galactic Center, they find that the SSC X-ray flux density (in Jy), magnetic field (in G), and column density of relativistic electrons (in cm-3keV-1) involved in the emission process can be described by
| (1) |
| (2) |
| (3) |
Here , ), and are dimensionless parameters (see Marscher 1983). For the case that they are all functions of , is the luminosity distance in gigaparsecs and the X-ray photon energy in . The underlying relativistic electron distribution is expressed as with an electron power-law index .
Eckart et al. (2012) then outline that the peak flux , source size , magnetic field , and relativistic particle density can all be expressed as power laws of the frequency :
| (4) |
| (5) |
| (6) |
and
| (7) |
with coefficients and exponents given in their paper.
3.2.2 Three cases of describing the spectra
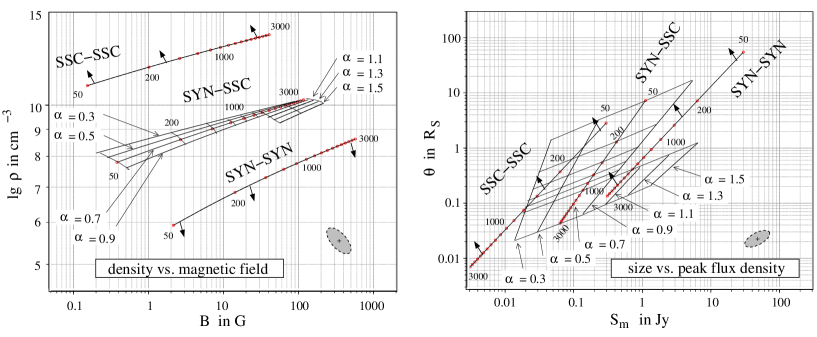
One can think of three different, basic cases in order to discuss the contributions of a single source emitting synchrotron (SYN) and synchrotron self-Compton (SSC) radiation in the radio, NIR and X-ray domains. The three combinations are abbreviated as SSC-SSC, SYN-SYN and SYN-SSC. The first label SSC-SSC indicates that both the NIR and X-ray fluxes are due to SSC scattered photons and less than 10% are due to a pure SYN contribution. The second label SYN-SYN indicates that a dominant contribution in these two wavelength bands is due to a SYN contribution and again less than 10% is due to a SSC contribution. The third label SYN-SSC indicates that the NIR flux density is mainly due to a SYN contribution and that the predominant amount of X-ray radiation is caused by a SSC contribution. In the two cases of SYN-SYN and SSC-SSC, the spectral indices in the NIR and X-ray domains are the same (unless synchrotron losses are involved). The spectral index can be calculated from the flux densities in the two bands. In Fig. 2 we show the results of model calculations for one particular flare. In the case of SYN-SSC, the graphs are labeled with the value of the optically thin SYN spectral index. The model graphs are only shown as thin solid lines if the NIR and X-ray flux densities are not contaminated by more than 10% by the SSC or pure SYN contributions, respectively. Mixed models in which both contaminating contributions are higher than 10% can be located between the SYN-SYN and SSC-SSC graphs. The models also obey the MIR flux density limit (Schödel et al. 2007, Schödel et al. 2011; see Eckart et al. 2012 for details).
Models in Fig. 2 were calculated for a cutoff frequency range between 50 GHz and 3 THz. The figure shows that the typical ranges of relativistic electron densities for the SYN-SYN, the SYN-SSC, and the SSC-SSC models are around , , and cm-3, respectively. In general the relativistic electron density increases with increasing magnetic field strength , spectral index , and synchrotron cutoff frequency. From SSC-SSC via SYN-SSC to SYN-SYN models the peak flux density and source size both increase. This is also the case for decreasing cutoff frequency and spectral index .
For 2 , , and , a larger number of NIR/X-ray flares can be described by SYN-SSC and SSC-SSC models, and cutoff frequencies of a few hundred GHz are preferred. For the rejected SSC-SSC and the SYN-SYN models, the violation of the MIR flux density limit prohibits these models. For the SYN-SSC, models can be rejected on the basis of excessive magnetic field strength , source size , and peak flux density .
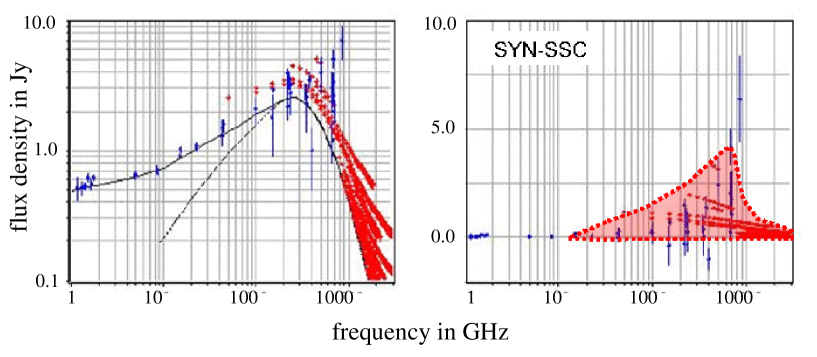
We consider the observed frequency-dependent variability amplitude ranges as an important observable that needs to be explained by SgrA* source models. Eckart et al. (2012) list in Tab.5 the upper limits to , , and , the lower limit to log(), along with the best-fit value obtained using the given parameter limits. For the SYN-SSC case, we used the full range of spectral indices to describe the sub-mm flux density variation of SgrA*. With the restricted set of parameters in Tab.5 (Eckart et al. 2012) the models represent the observed frequency-dependent variability amplitudes quite well. As explained in more detail in Eckart et al. (2012) for the SSC-SSC case, the degree of variability at high frequencies is too small to reflect the measurements well. For the SYN-SYN case, the degree of variability at low frequencies is much larger than observed. Also, most models are unable to provide an overall description of the SgrA* variability. Under the assumption of a single source component we can summarize that only the SYN-SSC model is capable in reproducing the observed SgrA* variability.
3.2.3 Equipartition
The analysis by Eckart et al. (2012) has shown that for a realistic description of the observed frequency-dependent variability amplitudes of SgrA* the single source component descriptions require high turnover frequencies (rather a few 100 GHz than a few 10 GHz) and at least densities that are 10 to 100 times the mean density of the larger scale accretion flow. The exact properties of matter close to the SgrA* SMBH are not constrained very well by existing observations. However, the accretion rate and hence the central density may be much higher than the limits derived from Faraday rotation. Also the magnetic field equipartition fraction and the bias field strength in the case of magnetic field reversals are not well constrained (see Marrone et al. 2007 and Igumenshchev et al. 2003 for details). While equipartition in the larger scale SgrA* accretion flow appears to be justified, deviations from equipartition may occur close to the midplane or temporary accretion disk of SgrA*. Such deviations are likely to occur as a consequence of plasma instabilities in the immediate vicinity of SgrA* as two-stream instabilities of collisionless shocks.
The two-stream instability is known as a common instability in plasma physics. One of the ways to induce it involves a high energetic particle stream injected into a plasma. Another way is by creating conditions in which different plasma species (ions and electrons) have different drift velocities. The energy contained and released from the particles can then lead to plasma wave excitation. The importance of the two-stream instability e.g. in Gamma-Ray Burst Sources (GBR) is highlighted by Medvedev & Loeb (1999). Through the generation of magnetic fields in in a relativistic shock, in this case one expects deviations from equipartition between magnetic field and particle energy by a factor of up to . The effect of beam-plasma instabilities on accretion disk and the associated flares are discussed in Krishan, Wiita & Ramadurai (2000) and Keppens, Casse & Goedbloed (2002). The importance of acceleration of particles by 1st and 2nd order Fermi processes in the framework of relativistic jets and accretion discs around SMBH is highlighted by e.g. Kowal et al. (2011) and Nishikawa et al (2011).
Particles may interact with each other not through Coulomb collisions but through
collective behavior within plasma waves, i.e. collisionless shocks.
In these shocks, the transition from pre-shock to post-shock states occurs on a
length scale that is much smaller than the mean free path for particle collisions.
The Weibel instability (Weibel 1959) represents such a collective response.
It can occur both in magnetized and initially non-magnetized
low-temperature relativistic flows.
In the latter they work apparently best (see details in the review by Bykov & Treumann 2011).
Another way to induce them is by having flows parallel to an ambient magnetic field - as
e.g. in case of a toroidal magnetic field structure within the mid-plane of an accretion flow
or an accretion disk.
For initially non-magnetic and for magnetic shocks the average
magnetic energy remains at least about 15-20% below the equipartition at the shock.
Magnetic fields induced by Weibel instabilities may form vortices, and
3D PIC (particle in cell) simulations indicate that they may result in
an extended downstream region with small-scale magnetic fields.
In the framework of accretion disks they might then be regarded as single or multiple hot spots.
The case of SgrA*:
Following Homan et al. (2006) and Readhead (1994) the intrinsic brightness
temperature, , is related to the equipartition brightness temperature at
energy balance by the expression
, where is the ratio of the energy
densities of the radiating particles, , to the energy density of the
magnetic field, .
The exponent of assumes
that the radiating particles follow a power-law Lorentz distribution
with index for and .
This value of corresponds to a spectral index of
() in the optically thin parts of a jet or outflow.
Recent and ongoing VLBI observations at 1.3 mm (Doeleman et al. 2008, 2009; Fish et al. 2011) determined a lower limit to the brightness temperature of the VLBI source SgrA* at 230 GHz of K. This is close to the equipartition brightness temperature of K that has been found by Readhead (1994) for a sample of accreting super-massive black holes. So we may assume that the mm-radiation source SgrA* is close to equipartition in its more quiescent phases. The intrinsic brightness temperature of SgrA* is then limited either by the inverse Compton limit ( K; Kellermann & Pauliny-Toth 1969, Pauliny-Toth & Kellermann 1966) or by the possibility that the emitting source is near equipartition to begin with so that (Singal & Gopal-Krishna 1985; Singal 1986; Readhead 1994). We measure , being the relativistic boosting factor and for SgrA* we can assume 1 (details in Eckart et al. 2012). In the sub-mm regime SgrA* can easily show flares that are 30% to 100% in excess over the low state (which may be subject to longer variability as well; see Dexter et al. 2010). This already implies significant deviations from equipartition with values for in the range of 10 to 350. As outlined above, such an imbalance may be the result of an injection or acceleration of particles generated through plasma instabilities close to the SMBH and possibly at the footpoint of a jet or outflow.
3.3 Polarization
The radio/NIR/X-ray flares (e.g. Fig.3) of increased flux last for about 100 min and are usually accompanied by variations in the polarized emission (e.g. Eckart & Genzel 1996, Ghez et al. 1998,2004 , Schödel et al. 2002, Baganoff et al. 2001, 2003, Eckart et al. 2004, 2006b, 2008ab, Nishiyama et al. 2009, Zamaninasab et al. 2010, Kunneriath et al. 2010). This time scale fits well with the mm-wave hourly timescales and structure function knees at 30-100 min found on individual occasions by Mauerhan et al. (2005) and Yusef-Zadeh et al. (2011). The mm/sub-mm wavelength linear polarization of SgrA* is just below 10% and variable in magnitude and position angle (PA) on timescales down to a few hours (Bower et al. 1999a). At 227 and 343 GHz Marrone et al. (2007) have determined an almost constant rotation measure of about -5.610-5 rad m-1. The mean intrinsic PA of 167o30o limits with its uncertainties, the accretion rate fluctuations to 25%. The accretion rate is limited to 210-7 Msolar yr-1 if the magnetic field is near equipartition, ordered, and largely radial, or has values of 210-9 Msolar yr-1 if there is a sub-equipartition, disordered, or toroidal field. Marrone et al. (2007) also find that the rather constant mean intrinsic PA is probably originating in the sub-millimeter photosphere of SgrA*, rather than arising from rotation measure changes. Circular polarization has also been detected for SgrA* ( 0.5% at cm-wavelengths), with a rising polarization fraction from 1.4 to 15 GHz (Bower et al. 2002, Bower et al. 1999abc; Sault & Macquart 1999) and further to 345 GHz ( 1.2% at sub-mm wavelengths; Munoz et al. 2012). This expected circular polarization at mm/sub-mm wavelengths (Beckert & Falcke 2002; Beckert 2003, Tsuboi et al. 2003; Bower et al. 2003ab, 2005) is most likely due to Faraday conversion of linear polarization which is also measured with increasing intensity towards high frequencies (Munoz et al. 2012). Hourly variable sub-mm emission (Marrone et al. 2006, Mauerhan et al. 2005, Miyazaki et al. 2004) and a very compact sub-mm VLBI structure (Doeleman et al. 2008/9) possibly point towards plasma blobs on relativistic orbits close to the event horizon. Hence, simultaneous observations of the variability at mm/sub-mm wavelengths are fundamental for constraining the radiative processes. Contributions to the flare emission from red noise processes are likely to be important (see Do et al. 2009, Eckart et al. 2008a). However, Zamaninasab et al. (2010, 2011) have demonstrated that highly polarized NIR sub-flares (on time scales of 20 min) are statistically significant compared to the randomly polarized red-noise. In addition to intensity variations due to relativistic boosting, the PA is rotated in the strong gravitational field of the SMBH. In these cases we can therefore estimate spin and spin-vector orientation of the SMBH (i.e. the accretion disk) independently from both simultaneous NIR and mm-polarization data in comparison to disk and jet models that we generate using a relativistic 2D- and 3D-disk codes (Dovciak, Karas, & Yaqoob 2004 and Bursa et al. 2012, this volume; running in Prague and Cologne). This code is capable of handling polarized emission and relativistic radiative transfer. It allows us to describe an orbiting and gradually evolving spot on different trajectories (in a disk or jet) near a rotating black hole including optical depth effects.
3.4 Alternative models
In the SSC-SSC, SYN-SSC, and SYN-SYN models discussed above (see section 3.2.2) a single population of relativistic electrons is responsible for the emission at different wavelengths. One can think of more complex models in which different populations of thermal or relativistic electrons are responsible for the emission. Here we briefly discuss two of these models. In both cases the SYN and SSC contributions have to be carefully tuned such that they contribute predominantly only in one frequency domain and cannot be attributed to the three cases mentioned above.
3.4.1 Double-SYN
If we assume that SgrA* is surrounded by a magnetized corona and - at least temporarily - by an accretion disk then the accreting medium is not uniform, and it may show inhomogeneities due to plasma instabilities operating in the weakly magnetized accretion flow. Such a dilute magnetosphere may contain individual magnetized source components which may lead to flares as they approach the black hole horizon (Galeev, Rosner & Vaiana, 1979, and subsequent works on patchy coronae). These two components may both be the source of synchrotron emission111We do not see the necessity to propose a double-SSC model, given that substantial synchrotron emission as well as a high density of relativistic electron is required for both components.. They may have different sizes, magnetic fields and particle densities and - more importantly - they may exist close to each other and may even be connected causally, e.g. outflows and the possibly back flowing envelopes or cocoons, or they may represent a jet or outflow and its base. In this double-SYN case the more compact or denser component could be responsible for the synchrotron X-ray contribution and the large and more tenuous component could be responsible for the mm/NIR synchrotron contribution.
3.4.2 External Compton scattering
The region responsible for the infrared emission may be different from that of the mm-emission and the mm-emission region may be optically thin for near-IR photons. Then the relativistic electrons in this source component are available to up-scatter near-IR seed photons to X-ray energies (Yusef-Zadeh et al. 2009). Since the scattering source is not identical in this case with the seed photon generating source, one may attribute this mechanism to the external inverse Compton scattering (ICS) mechanism in contrast to the synchrotron self Compton (SSC) excess. In order to allow for a high efficiency for inverse Compton scattering, the density of the scattering electrons and the scattered seed photons must be high. (For non-thermal sources this is therefore usually best done by the source also responsible for the seed photons i.e. SSC.) Again the individual synchrotron and synchrotron self Compton contributions have to be well tuned such that the pure inverse Compton contribution remains dominant in the X-ray domain. This whole scenario may be complicated even further if one considers that the mm-wavelength emitting cloud may be optically thick and occults the quiescent or flaring emission from SgrA* (Yusef-Zadeh et al. 2010).
However, if one accepts the statement that the mm-wavelength flares are physically associated with the NIR/X-ray flares, then the observed adiabatic expansion velocity of the radio components (typically 0.01 c) and the observed radio/NIR/X-ray flare length of 20 minutes to one hour give a minimum size of the order of 0.3 to 1 (Schwarzschild radii). However this is a typical size of an emitting source component close to the SMBH, such that sources - emitting at different wavelengths at or below this size - have to be treated as a single component (implying SSC rather than ICS) than two separate sources. Alternatively, one is forced to treat the emitting regions as independent regions and treat them in a fully stochastical description. These senarii become rapidly unphysical, since it is difficult to have a source only emitting in a single spectral domain without a significant contribution in neighboring wavelength domains.
3.4.3 Fermion and Boson balls
There is the attempt to explain very massive objects at the centers of galaxies by the concept of Fermion or Boson balls. The mere fact that we observe strong variability from SgrA* may already speak for a rather stabile than a fragile mass concentration at the center. A universal Fermion ball solution for compact galactic nuclei can be excluded by the results from stellar orbits near SgrA* (see references in Eckart et al. 2008abc, 2010). An alternative explanation is that of a massive Boson star (Torres, Capozziello & Lambiase 2000, Lu & Torres 2003 and references therein). This explanation is severely challenged by the general agreement between the measured polarized flare structure and the theoretical predictions (e.g. Eckart et al. 2006b, Zamaninasab et al. 2011). If the indicated signatures of orbiting matter (very close to the event horizon) are considered, then also a stationary Boson star may be excluded as an alternative solution for SgrA* (Eckart et al. 2006b and see also result for the nucleus of MCG-6-30-15 by Lu & Torres 2003). For these objects one expects the orbital periods to be larger than those inferred from modeling the NIR polarized flares. Especially ongoing accretion and star formation in the central cluster results in requirements to keep Fermion or Boson balls stable, which are most likely not met. A similar result is reached by Miller (2006) and Munyaneza & Biermann (2005) who discuss constraints on alternatives to super-massive black holes and their growth of super-massive black holes in galaxies.
3.4.4 Stars, Planets and Asteroids
The models for SgrA* presented above are based on descriptions derived for non-thermal sources associated with both stellar black holes and low- and high-luminosity accreting super-massive black holes in nuclei of external host galaxies. Since the luminosity of SgrA* is rather low compared to other SMBH sources and since it is the closest of such sources that we can study, there are attempts to explain the flare emission of SgrA* via different mechanisms. There are two major recent models: The first one involves a population of asteroids and planets that are disrupted by tidal forces exerted on them by SgrA* (Zubovas, Nayakshin & Markoff 2011). The second uses the coronal radiation of a cusp of spun-up stars to explain the X-ray luminosity of SgrA* (Sazonov, Sunyaev & Revnivtsev 2012). It needs to be investigated if both of these models can explain the full body of observations of SgrA* and if they can be tested by further observations.
4 Summary and Conclusion
Eckart et al. (2012) have shown that the bulk of synchrotron and SSC models applicable to SgrA* have preferred synchrotron turnover frequencies in the range of a few hundred GHz. For the pure synchrotron models, the densities of relativistic particles are of the order of 106.5cm-3. For models involving SSC contributions the median densities are an order of magnitude higher. These values are quite comparable to those quoted for the accretion flow toward SgrA* (e.g. Yuan et al. 2003, 2004, Yusef-Zadeh et al. 2006ab).
For a realistic description of the observed frequency-dependent variability amplitudes of SgrA* higher densities and turnover frequencies are also required (details in Eckart et al. 2012). Higher densities are neither unreasonable nor out of reach. The accretion rate and hence the central density may be much higher than the limits derived from Faraday rotation (Bower et al. 2003, Bower 2003, Marrone 2006a, Marrone et al. 2006abc, and discussion by Marrone et al. 2007). In particular, the magnetic field equipartition fraction as well as the bias field strength in the case of magnetic field reversals - that can be expected for a turbulent flow - are unknown. Variations in the magnetic field structure as well as the field strength with respect to equipartition (Marrone et al. 2007, Igumenshchev et al. 2003) are likely to result in higher densities in the immediate vicinity of the central SMBH. While SgrA* may be close to equipartition, it is quite likely that at least during flux density events associated with very strong X-ray flares and the related NIR and (sub)mm-flux excursions, SgrA* may go through phases in which it is off equipartition.
Currently, it is difficult to decide which of all the models mentioned
here describe the dominant contributors to the flare activity of SgrA*,
or which combinations of effects are most likely or if one or some of the
mechanisms can be excluded entirely.
A key appears to be the restrictions imposed onto the models by the frequency
dependant flux density variability or polarization properties.
Therefore, the simultaneous flux density and
polarization monitoring observing campaigns are essential.
Any model (or combinations of those) must be able to explain these
observations.
In addition, it is essential, that high angular resolution observations in the
NIR (interferometry with long baselines) and radio domain (mm- and sub-mm-VLBI)
are being performed. These observations will help to identify the orbital motion
around the SMBH or motion along a jet/outflow.
Acknowledgements:
N. Sabha is member of the Bonn Cologne Graduate School (BCGS) for
Physics and Astronomy supported by the Deutsche Forschungsgemeinschaft.
M. Valencia-S. is member of the International Max-Planck Research School
(IMPRS) for Astronomy and Astrophysics at the Universities of Bonn and Cologne
supported by the Max Planck Society.
F. Baganoff was supported by NASA through Chandra Award
Number GO9-0101X and SAO Award Number 2834-MIT-SAO-4018.
Part of this work was supported by the COST Action MP0905:
Black Holes in a violent Universe and PECS project No. 98040.
We are grateful to all members
of the NAOS/CONICA, ESO PARANAL, and APEX team.
M. García-Marín is supported by the German
federal department for education and research (BMBF) under
the project number 50OS1101.
R. Schödel acknowledges support by the Ramón y Cajal program,
by grants AYA2010-17631 and AYA2009-13036 of the Spanish Ministry of
Science and Innovation, and by grant P08-TIC-4075 of the Junta de
Andalucía.
Ongoing CARMA development and operations are supported by the
National Science Foundation under a cooperative agreement,
and by the CARMA partner universities.
References
References
- [1] Baganoff, F.K., Bautz, M.W., Brandt, W.N., et al. 2001, Nature, 413, 45
- [2] Baganoff, F. K., Maeda, Y., Morris, M., et al. 2003, ApJ 591, 891
- [3] Beckert, T.; Falcke, H., 2002, A&A 388, 1106
- [4] Beckert, T., 2003, ANS 324, 459
- [5] Bower, Geoffrey C.; Wright, Melvyn C. H.; Backer, Donald C.; Falcke, Heino, 1999a, ApJ 527, 851
- [6] Bower, Geoffrey C.; Falcke, Heino; Backer, Donald C., 1999b, ApJ 523, L29
- [7] Bower, Geoffrey C.; Backer, Donald C.; Zhao, Jun-Hui; Goss, Miller; Falcke, Heino, 1999c, ApJ 521, 582
- [8] Bower, G.C., Falcke, H., Sault, R.J., Backer, D.C., 2002, ApJ 571, 843
- [9] Bower, G.C.; Wright, M.C.H.; Falcke, H.; Backer, D.C.,2003 ApJ 588, 331
- [10] Bower, G.C., 2003, Ap&SS 288 69
- [11] Broderick, A.E., Loeb, A., 2006, MNRAS 367, 905
- [12] Bremer, M., Witzel, G., Eckart, A., Zamaninasab, M., Buchholz, R.M. , Schödel, R., Straubmeier, C., García-Marín, M., Duschl, W., 2011, A&A 532, 26
- [13] Bykov, A. M.; Treumann, R. A., 2011, A&ARv 19, 42
- [14] Dexter, J.; Agol, E.; Fragile, P.C., 2009, ApJ 703, L142
- [15] Dexter, J., Agol, E., Fragile, P. C., McKinney, J. C., 2010, ApJ 717, 2, 1092
- [16] Do, T.; Ghez, A.M.; Morris, M.R.; Yelda, S.; Meyer, L.; Lu, J.R.; Hornstein, S.D.; Matthews, K., 2009, ApJ 691, 1021.
- [17] Doeleman, S.S.; Fish, V.L.; Broderick, A.E.; Loeb, A.; Rogers, A.E.E., 2009, ApJ, 695, 59
- [18] Doeleman, S.S.; Weintroub, J.; Rogers, A.E.E.; et al., 2008, Natur 455, 78
- [19] Dodds-Eden, K.; Porquet, D.; Trap, G.; Quataert, E.; et al., 2009, ApJ 698, 676
- [20] Dovciak, M.; Karas, V.; Yaqoob, T., 2004, ApJS 153, 205
- [21] Eckart, A.; Baganoff, F. K.; Morris, M.; et al., 2004, A&A 427, 1
- [22] Eckart, A.; Baganoff, F. K.; Schödel, R.; Morris, M.; Genzel, R.; Bower, G. C.; Marrone, D.; et al. 2006a, A&A 450, 535
- [23] Eckart, A.; Schödel, R.; Meyer, L.; Trippe, S.; Ott, T.; Genzel, R., 2006b, A&A 455, 1
- [24] Eckart, A.; Baganoff, F. K.; Zamaninasab, M.; Morris, M. R.; Schödel, R.; et al., 2008a, A&A 479, 625
- [25] Eckart, A., Schödel, R., Baganoff, F.K., Morris, M., et al. 2008b, JPhCS 131, 2002
- [26] Eckart, A.; García-Marín; Witzel, G et a, in Proc. of ”Identification of dark matter 2008”, August 18-22, 2008c, Stockholm, Sweden, p.38,
- [27] Eckart, A.; Schödel, R.; Garcia-Marin, M.; Witzel, G.; Weiss, A.; Baganoff, F. K.; Morris, M. R.; Bertram, T.; Dovciak, M.; Duschl, W. J.; et al., 2008d, A&A 492, 337
- [28] Eckart, A.; Baganoff, F. K.; Morris, M. R.; Kunneriath, D.; Zamaninasab, M.; Witzel, G.; Schödel, R.; Garcia-Marin, M.; et al., 2009, A&A 500, 935.
- [29] Eckart, A.; Garcia-Marin, M.; König, S.; Kunneriath, D.; Muzic, K.; Straubmeier, C.; Witzel, G.; Zamaninasab, M., 2010, Proc. of the 7th International Heidelberg Conference on Dark 2009 . Held 18 - 24 January 2009 in Christchurch, New Zealand. Edited by Hans Volker Klapdor-Kleingrothaus (Heidelberg University, Germany) & Irina V Krivosheina (Radiophysical Research Institute (NIRFI), Russia). Published by World Scientific Publishing Co. Pte. Ltd., 2010. ISBN 9789814293792, pp. 303-319
- [30] Eckart, A.; García-Marín, M.; Vogel, S. N.; Teuben, P.; Morris, M. R.; Baganoff, F.; Dexter, J.; Schödel, R.; Witzel, G.; Valencia-S., M.;et al., 2012, A&A 537, 52
- [31] Eckart, A.; Zamaninasab, M.; Sabha, N.; García-Marín, M.; Kunneriath, D.; Straubmeier, C.; Muzic, K.; Witzel, G.; Bremer, M.; Valencia-Schneider, M.; et al., The Galactic Center: a Window to the Nuclear Environment of Disk Galaxies. Proceedings of a workshop held at Shanghai, China on October 19-23, 2009. Edited by Mark R. Morris, Q. Daniel Wang, and Feng Yuan. San Francisco: Astronomical Society of the Pacific, 2011, p. 294
- [32] Fish, V.L.; Doeleman, S.S.; Beaudoin, C.; Blundell, R.; Bolin, D.E.; Bower, G.C.; et al., 2011, ApJ 727, L36
- [33] Falcke, H.; Markoff, S., 2000, A&A 362, 113
- [34] Galeev, A. A.; Rosner, R.; Vaiana, G. S., 1979, ApJ 229, 318
- [35] Genzel, R.; Schödel, R.; Ott, T.; Eckart, A.; Alexander, T.; Lacombe, F.; Rouan, D.; Aschenbach, B., Nature 425, 934
- [36] Ghez, A. M., Duchéne, G., Matthews, K., et al. 2003, ApJ, 586, L127
- [37] Ghez, A.M., Wright, S.A., Matthews, K., et al. 2004, ApJ 601, 159
- [38] Gillessen, S.; Eisenhauer, F.; Quataert, E.; et al., 2006, ApJ 640, L163
- [39] Homan, D. C.;et al., 2006, ApJ 642, L115
- [40] Hornstein, S. D., Matthews, K., Ghez, A. M., Lu, J. R., Morris, M., Becklin, E. E., Rafelski, M., & Baganoff, F. K. 2007, ApJ, 667, 900
- [41] Igumenshchev, I.V.; Narayan, R.; Abramowicz, M.A.; 2003, ApJ 592. 1042
- [42] Karas, V., Dovciak, M., Eckart, A., Meyer, L., 2007, Proceedings of the Workshop on the Black Holes and Neutron Stars, eds. S. Hledik and Z. Stuchlik, 19-21 September 2007 (Silesian University, Opava), pp. 99-108, arXiv:0709.3836
- [43] Keppens, R.; Casse, F.; Goedbloed, J. P., 2002, ApJ 569, L121
- [44] Kowal, G.; de Gouveia Dal Pino, E. M.; Lazarian, A., 2011, ApJ 735, 102
- [45] Krishan, V.; Wiita, P. J.; Ramadurai, S., 2000, A&A 356, 373
- [46] Kunneriath, D.; Witzel, G.; Eckart, A.; Zamaninasab, M.; et al.; et al., 2010, A&A 517, 46
- [47] Li, J., Shen, Z.-Q., Miyazaki, A., Huang, L., Sault, R. J., et al., 2009,ApJ 700, L417
- [48] Lu, Youjun; Torres, Diego F., 2003, IJMPD 12, 63
- [49] Markoff, S., 2005, ApJ 618, L103
- [50] Markoff, S.; Bower, G.C.; Falcke, H., 2007, MNRAS 379, 1519
- [51] Marrone, D. P. 2006a, PhD thesis, Harvard Univ.
- [52] Marrone, D.P.; Moran, J.M.; Zhao, J.-H.; Rao, R., 2006b, ApJ 640, 308
- [53] Marrone, D.P.; Moran, J.M.; Zhao, J.-H.; Rao, R., 2006c, JPhCS 54, 354
- [54] Marrone, D.P.; Moran, J.M.; Zhao, J.-H.; Rao, R. 2007, ApJ 654, L57
- [55] Marrone, D. P.; Baganoff, F. K.; Morris, M.; et al., 2008, ApJ 682, 373
- [56] Marscher, A.P. 1983, ApJ, 264, 296
- [57] Marscher, A.P. 2009, in Belloni, T. (ed.): The Jet Paradigm - From Microquasars to Quasars, Lect. Notes Phys. 794 (2009), 2009arXiv0909.2576M
- [58] Mauerhan et al. 2005, ApJ 623, L25
- [59] Medvedev, Mikhail V.; Loeb, Abraham, 1999, ApJ 526, 697
- [60] Melia, F. & Falcke, H. 2001, ARA&A 39, 309
- [61] Meyer, L.; Schödel, R.; Eckart, A.; Duschl, W. J.; Karas, V.; Dociak, M., 2007, A&A 473, 707
- [62] Miller, M.C., 2006, MNRAS 367, L32
- [63] Miyazaki, A.; Tsutsumi, T.; Tsuboi, M., 2003, ANS 324, 363
- [64] Munyaneza. F & Biermann, P. L., 2005, A&A 436, 805
- [65] Munoz, D. J.; Marrone, D. P.; Moran, J. M.; Rao, R., 2012, ApJ 745, 115
- [66] Narayan, R.; Yi, I.; Mahadevan, R., 1995, Natur 374, 623
- [67] Nishikawa, K.-I. et al., 2011, AdSpR 47, 1434
- [68] Nishiyama, S.; Tamura, M.; Hatano, H.; Nagata, T.; Kudo, T.; Ishii, M.; Schödel, R.; Eckart, A., 2009, ApJ 702, L56
- [69] Pauliny-Toth, I. I. K.; Kellermann, K. I., 1966, ApJ 146, 634
- [70] Kellermann, K. I.; Pauliny-Toth, I. I. K., 1969, ApJ 155L, 71
- [71] Pecháček, T., Karas, V., Czerny, B., 2008, A&A 487, 815
- [72] Readhead, A. C. S. 1994, ApJ, 426, 51
- [73] Sabha, N.; Eckart, A.; Merritt, D.; submitted to A& A, 2012arXiv1203.2625S
- [74] Sault, R. J.; Macquart, J.-P., 1999, ApJ526, L85
- [75] Sazonov, S.; Sunyaev, R.; Revnivtsev, M., 2012, MNRAS 420, 388
- [76] Shcherbakov, R.V.; Baganoff, F.K., 2010, ApJ 716, 504
- [77] Schödel, R.; Eckart, A.; Alexander, T.; Merritt, D.; et al., 2007, A&A 469, 125
- [78] Schödel, R.; Najarro, F.; Muzic, K.; Eckart, A., 2010, A&A 511, 18,
- [79] Schödel, R., Morris, M.R., Muzic, K., Alberdi, A., Meyer, L., Eckart, A., & Gezari, D.Y. 2011, A&A, 532, A83.
- [80] Singal, A. K. 2009 ApJ 703, L109
- [81] Singal, K. A.; Gopal-Krishna, 1985, MNRAS 215, 383
- [82] Torres, D.F., Capoziello, S., Lambiase, G., 2000, Phys. Rev. D 62, 104012
- [83] Trap, G.; Weiss, A.; Goldwurm, A.; Dodds-Eden, K.; Terrier, R.; et al., 2011a, ASPC 439, 304
- [84] Trap, G.; Goldwurm, A.; Dodds-Eden, K.; Weiss, A.; Terrier, R.; et al., 2011b, A&A 528, 140
- [85] Tsuboi, M.; Miyahara, H.; Nomura, R.; Kasuga, T.; Miyazaki, A., 2003, ANS 324, 431
- [86] Witzel, G., Eckart, A., Bremer, M., Schödel, R., Shazamanian, B., submitted to ApJ.
- [87] Weibel E.S. 1959, Phys Rev Lett 2:83-84.
- [88] Yuan, F., Quataert, E., & Narayan, R. 2003, ApJ 598, 301
- [89] Yuan, F., Quataert, E., & Narayan, R. 2004, ApJ 606, 894
- [90] Yuan, F., Lin, J.; Wu, K.; Ho, Luis C., 2008, MNRAS 395, 2183
- [91] Yusef-Zadeh, F., et al., 2006a, ApJ 650, 189
- [92] Yusef-Zadeh, F., et al., 2006b, ApJ 644, 198
- [93] Yusef-Zadeh, F.; Wardle, M.; Heinke, C.; et al., 2008, ApJ 682, 361
- [94] Yusef-Zadeh F.; Bushouse H.; Wardle M. et al. 2009, ApJ, 706, 348
- [95] Yusef-Zadeh F., et al. 2011, ApJ 729, 44
- [96] Zamaninasab, M.; Eckart, A.; Dovciak, M.; Karas, V.; Schödel, R.; Witzel, G.; Sabha, N.; Garcia-Marin, M.; Kunneriath, D.; Muzic, K.; et al., 2011, MNRAS 413, 322,
- [97] Zamaninasab, M.; Eckart, A.; Witzel, G.; Dovciak, M.; Karas, V.; Schödel, R.; Gießübel, R.; Bremer, M.; Garcia-Marin, M.; Kunneriath, D.; et al., 2010, A&A 510, 3
- [98] Zhao, J.-H., Young, K.H., Herrnstein, R.M., Ho, P.T.P., et al., 2003, ApJL, 586, L29.
- [99] Zubovas, K.; Nayakshin, S.; Markoff, S., 2012, MNRAS, in press, arXiv1110.6872Z