CHARACTERIZING ULTRAVIOLET AND INFRARED OBSERVATIONAL PROPERTIES FOR GALAXIES. I. INFLUENCES OF DUST ATTENUATION AND STELLAR POPULATION AGE
Abstract
The correlation between infrared-to-ultraviolet luminosity ratio and ultraviolet color (or ultraviolet spectral slope), i.e., the IRX-UV (or IRX-) relation, found in studies of starburst galaxies is a prevalent recipe for correcting extragalactic dust attenuation. Considerable dispersion in this relation discovered for normal galaxies, however, complicates its usability. In order to investigate the cause of the dispersion and to have a better understanding of the nature of the IRX-UV relation, in this paper, we select five nearby spiral galaxies, and perform spatially resolved studies on each of the galaxies, with a combination of ultraviolet and infrared imaging data. We measure all positions within each galaxy and divide the extracted regions into young and evolved stellar populations. By means of this approach, we attempt to discover separate effects of dust attenuation and stellar population age on the IRX-UV relation for individual galaxies. In this work, in addition to dust attenuation, stellar population age is interpreted to be another parameter in the IRX-UV function, and the diversity of star formation histories is suggested to disperse the age effects. At the same time, strong evidence shows the necessity of more parameters in the interpretation of observational data, such as variations in attenuation/extinction law. Fractional contributions of different components to the integrated luminosities of the galaxies suggest that the integrated measurements of these galaxies, which comprise different populations would weaken the effect of the age parameter on IRX-UV diagrams. The dependance of the IRX-UV relation on luminosity and radial distance in galaxies presents weak trends, which offers an implication of selective effects. The two-dimensional maps of the UV color and the infrared-to-ultraviolet ratio are displayed and show a disparity in the spatial distributions between the two parameters in galaxies, which offers a spatial interpretation of the scatter in the IRX-UV relation.
Subject headings:
dust, extinction - galaxies: individual (NGC 3031, NGC 4536, NGC 5194, NGC 6946, NGC 7331) - galaxies: spiral - infrared: galaxies - ultraviolet: galaxies1. INTRODUCTION
Obscuration of starlight by interstellar dust grains is a serious obstacle which hampers our ability to directly derive stellar population properties of galaxies from observed radiative information. Correction for dust attenuation is crucial for determining galactic properties such as star formation history (SFH) in current extragalactic astronomy. Calibration of observational indicators to intrinsic parameters of galaxies, for instance from observed UV-optical flux to star formation rate (SFR), is in tight connection with the fact of proper compensation made for dust attenuation (e.g., Kong, 2004; Kennicutt et al., 2009; Lee et al., 2009; Hao et al., 2011).
Dust grains absorb stellar emission with the wavelength coverage from far-ultraviolet to near-infrared, and re-emit the energy as mid- and far-infrared thermal radiation. According to the energy balance theory, the luminosity ratio of total infrared (IR) to ultraviolet (UV; so-called IR excess or IRX, initially introduced in Mezger et al., 1974) has been invented and considered as a reliable indicator of dust attenuation (Buat, 1992; Xu & Buat, 1995; Buat & Xu, 1996; Witt & Gordon, 2000; Buat et al., 2005). Throughout this paper, the IRX is defined in the form of a logarithm: , where L(IR) is luminosity of infrared thermal radiation of dust and L(FUV) is far-ultraviolet monochromatic luminosity of starlight (detailed definitions of these terms are presented in Section 2.2). In the meanwhile, for starburst galaxies, it is believed that the ultraviolet spectral slope (, defined as , where ; Calzetti et al., 1994) has an intrinsic value (, as suggested in Calzetti et al., 1994; Leitherer & Heckman, 1995; Meurer et al., 1999), and any change in this slope results from wavelength-selective absorption of photons by dust grains. On a basis of this assumption, the slope of UV spectrum is regarded as another attenuation estimator (Calzetti et al., 1994; Calzetti, 1997).
The correlation between the two parameters was found by Meurer et al. (1999, so-called IRX- relation) with an investigation based on a local starburst sample, and the relation was believed to be a sequence indicating dust attenuation. Therefore, the IRX- relation has great significance for attenuation correction, since it provides an access to estimate dust attenuation solely with UV waveband. This prescription has been widely used at the present time especially for high redshift galaxies, of which the rest-frame UV observations are available from ground-based optical telescopes (e.g., Daddi et al., 2004, 2007; Kong et al., 2006; Martin et al., 2007; Bouwens et al., 2009). Since people usually adopt UV color or UV luminosity ratio as a surrogate for the traditional UV spectral slope, hereafter we refer to the relation as the terminology ”IRX-UV” in place of the ”IRX-”.
Observations on extragalactic star-forming regions and normal galaxies following the discovery of the IRX-UV relation show considerable dispersion in this relation. The analysis of HII regions in the Large Magellanic Cloud by Bell (2002) and the study of normal galaxies by Kong et al. (2004, hereafter denoted as K04) have shown that the IRX-UV relation appears to have flatter UV spectral slopes than starburst galaxies at fixed IRX and covers a wide range; the tight correlation between IRX and for starburst galaxies has been found in absence, with a considerable degree of deviation and dispersion from the starburst formula instead.
Following the launch of the Galaxy Evolution Explorer (GALEX; Bianchi et al., 2003; Martin et al., 2005) and the Spitzer Space Telescope (Spitzer; Werner et al., 2004), an increasing number of studies have revealed the deviation in the IRX-UV relation, from statistics of integrated measurements of galaxies as a whole (e.g., Dale et al., 2007, 2009; Gil de Paz et al., 2007) to spatially resolved studies of individual galaxies (e.g., Gordon et al., 2004; Calzetti et al., 2005; Thilker et al., 2007). It is worth mentioning that, with the combination of larger and more comprehensive UV and IR all sky survey data, Buat et al. (2005) have found the similar offset and scatter from the starburst relation in the IRX-UV diagram, while a few number of IR-bright galaxies appear to have higher IRXs than starburst galaxies at given UV spectral slopes. The IRX-rising phenomenon has been confirmed by studies of (ultra-)luminous infrared galaxies, and adds an additional question to the IRX-UV issue (Goldader et al., 2002; Howell et al., 2010). In order to improve the IRX-UV calibration to dust attenuation and to provide better insights into the nature of galactic UV and IR properties, it is necessary to discover the origin of the deviation in the IRX-UV relation.
A variety of SFH of different stellar populations have been considered as one main cause of the deviation, and in simple cases this deviation is indicated by stellar population age. In K04 work, the authors have compiled a sample of galaxies with a wide coverage of star formation activities from starburst to quiescent, and employed the spectral index to trace different stellar populations. Via the analysis of perpendicular distances of the galaxies on the IRX-UV diagram from the empirical best-fitting curve for starburst galaxies (the starburst empirical curve is parameterized by Equation (2) in K04 paper), they have confirmed that variations in stellar populations dominate the dispersion in the IRX-UV relation. The products of stellar population synthesis modeling in K04 work have shown that aging of stellar populations would yield redder unattenuated UV colors (i.e., flatter intrinsic UV spectral slopes), and the effect of stellar population age on the IRX-UV relation is depicted as a series of sequences in parallel with the starburst empirical relation (Figure 4 in K04 paper). Thus, in addition to dust attenuation, stellar population age has been considered as the second parameter in the IRX-UV function. Nevertheless, there has been lack of strong evidence to demonstrate such an age effect, and in many cases it is ascribed to the fact that the adopted observational tracers are inappropriate, or the age effects are weak compared with other potential effects and hence can be easily masked (Seibert et al., 2005; Cortese et al., 2006; Johnson et al., 2007). Despite these disappointments, studies of radial profiles for individual galaxies have disclosed a weak trend of the age-sensitive color FUV 3.6 m in the IRX-UV relation, which is in encouraging support of the role stellar population age plays in the IRX-UV relation (Muñoz-Mateos et al., 2009). Notwithstanding, the radial profiles still cannot adequately resolve the mixing of stellar populations within galaxies.
A recent work on a basis of pixel-by-pixel studies of nearby galaxies taken by Boquien et al. (2012) makes use of the data obtained from the Herschel Space Observatory (Pilbratt et al., 2010) to examine a set of parameters. The results in their work have illustrated that, intrinsic UV color plays a predominant role in the IRX-UV relation; the commonly used age indicators including the spectral index are in a poor position to estimate accurate stellar population age and therefore fail to trace the IRX-UV relation as a function of age; in addition, the analysis in Boquien et al. (2012) has further predicted a non-negligible contribution from the shape of attenuation law to the deviation in the IRX-UV relation. Coincidentally, several numerical simulations have reproduced a diversity of IRX-UV trends by varying dust-star geometrical configuration and dust grain properties (Burgarella et al., 2005; Panuzzo et al., 2007; Cortese et al., 2008).
In this work, we carry out spatially resolved studies of galaxies which enable an inspection of galactic sub-structures and allow us to extract certain sources of interest within each single galaxy rather than a mixture of different stellar populations (e.g., Calzetti et al., 2005; Pérez-González et al., 2006; Thilker et al., 2007), and in this way we can have better separation between different populations than integrated measurements or radial profiles of galaxies. This kind of investigation also makes it possible to compare regions of a similar stellar population in different galaxies. Boquien et al. (2009) have been engaged in a census of star-forming clusters in eight nearby spiral galaxies. Further to the approach taken by Boquien et al. (2009), we focus on all positions in galaxies, not only young clusters, but also evolved stellar populations in galactic background areas which are supposed to have different intrinsic UV colors from young stellar populations. This strategy is a natural way to define stellar populations and makes it possible to exhibit age signatures in the IRX-UV diagrams. Up to now, most analyses are based on integrated measurements of galaxies, while in this work, we take advantage of the spatially resolved analysis to explore the determinant of the locations of integrated galaxies in the IRX-UV diagram. Also, we test the systematic dependence of the IRX-UV relation on FUV luminosity and radial distance, and present two-dimensional maps of UV color and IRX to provide a spatial insight into the IRX-UV relation.
The remainder of this paper is outlined as follows. In Section 2, we describe the compilation of the sample, the data processing and the photometric measurements, and the modeling of spectral synthesis; in Section 3, we present the resulting IRX-UV diagrams for the extracted regions within the galaxies in our sample; in Section 4, we examine the systematic dependance of the IRX-UV relations on luminosity and radial distance; in Section 5, we provide spatial distributions of UV color and IRX; Section 6 is concerned with relevant discussion and interpretation about the presented results; finally, we summarize the results and their implications in Section 7.
2. DATA AND MEASUREMENTS
2.1. Sample of Galaxies
The sample of galaxies in this work is compiled from the Spitzer Infrared Nearby Galaxies Survey (SINGS, Kennicutt et al., 2003). The SINGS project has observed imageries of IR emission components for a sample of 75 nearby galaxies in the wavelength range from 3.6 m to 160 m. The UV imaging data of the SINGS galaxies have been obtained as a part of the Ultraviolet Atlas of GALEX Nearby Galaxies Survey (Bianchi et al., 2003; Gil de Paz et al., 2007). Combination of the both surveys offers an ideal multi-wavelength observational archive of nearby galaxies, and make it possible for spatially resolved studies of galaxies.
The GALEX observation works at two ultraviolet wavelength bands: far-ultraviolet (FUV, ) and near-ultraviolet (NUV, ). The GALEX data can be retrieved on its data release website.111http://galex.stsci.edu/ Detailed descriptions of the GALEX mission and the instruments are provided in Martin et al. (2005). The SINGS data release includes Spitzer imaging at seven bandpasses with two channels for each of the galaxies: 3.6, 4.5, 5.8, 8.0 m with IRAC, and 24, 70, 160 m with MIPS. Readers are referred to Werner et al. (2004) for a general introduction of the Spitzer telescope, Fazio et al. (2004) for the IRAC instrument, and Rieke et al. (2004) for the MIPS instrument. The SINGS data can be obtained on the Spitzer data distribution service.222http://data.spitzer.caltech.edu/popular/sings/
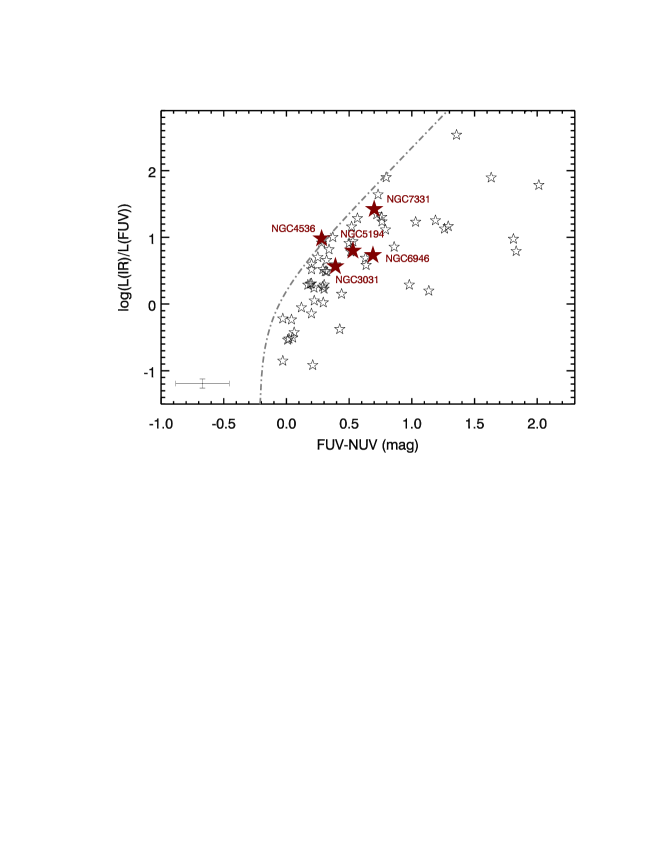
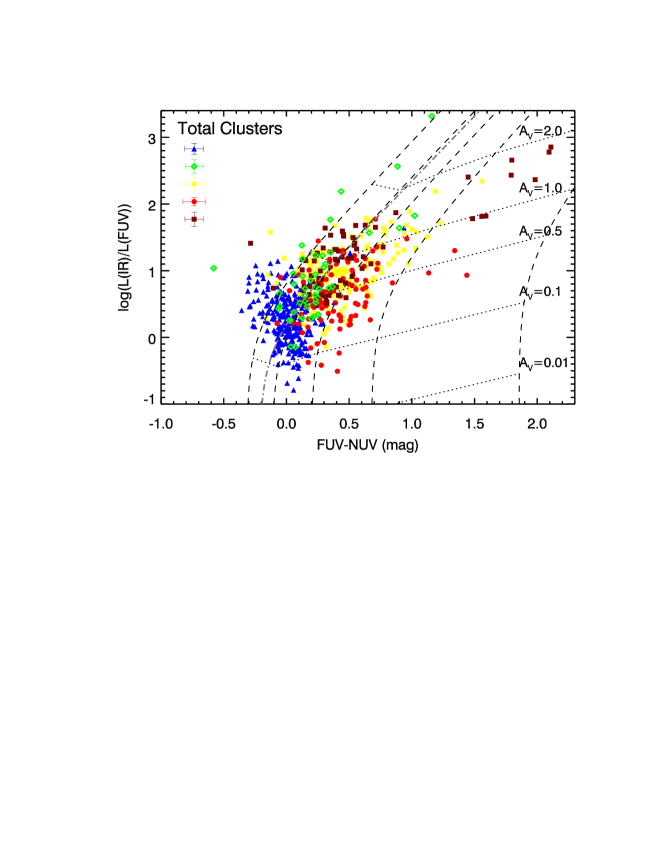
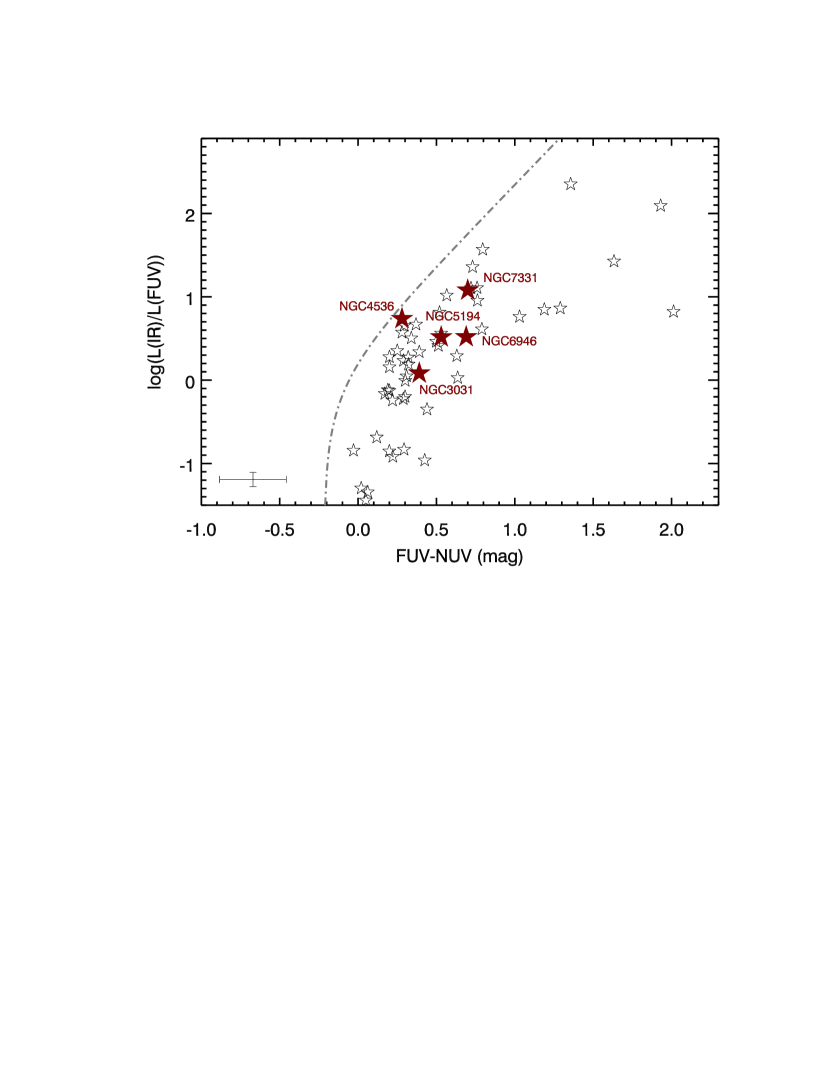
The approach of this work is to measure all positions within individual galaxies, and divide various stellar populations thereinto. For this purpose, large spiral galaxies containing a sufficient number of well-resolved subregions are required as targets; on the other hand, in order to investigate distributions of galaxies in the IRX-UV diagram, we need a sample of galaxies with a diversity of the IRX-UV locations. Taking the two criteria into consideration, we select five galaxies from SINGS galaxy sample: NGC 3031 (M81), NGC 4536, NGC 5194 (M51a), NGC 6946, and NGC 7331. In this sample, three galaxies have special characters in central areas: NGC 3031 contains a huge bulge comprising stellar populations with age older than 8 Gyr (Kong et al., 2000), NGC 4536 performs intensive nuclear star-forming activities (Jogee et al., 2005), and NGC 7331 hosts a ring structure containing materials of molecular gas and dust (Regan et al., 2004). In this work, we also aim to investigate the roles of these special substructures of the IRX-UV locations of their host galaxies. Figure 1 displays the IRX-UV diagram for all the SINGS galaxies with the integrated measurements quoted from Dale et al. (2007, hereafter denoted as D07), and the galaxies selected for this work are labeled. In our sample, NGC 4536 is the closest to the starburst empirical curve; NGC 6946 is the farthest one; NGC 7331 populates at a high level in the diagram; NGC 3031 lies near the bottom; and NGC 5194 ranks at a moderate level. The total IR luminosity is estimated with 8 m and 24 m luminosities using the calibration in Calzetti et al. (2005, hereafter denoted as C05). This calibration is employed for estimation of total IR luminosities throughout this paper, and we will offer an description in the below section. Table 1 presents the basic properties of the galaxies in our sample.
| Name | R.A.aa Data obtained from Kennicutt et al. (2003). | Dec.aa Data obtained from Kennicutt et al. (2003). | Optical Morphologyaa Data obtained from Kennicutt et al. (2003). | D25aa Data obtained from Kennicutt et al. (2003). | Distancebb Data obtained from the NASA/IPAC Extragalactic Database. | MOptaa Data obtained from Kennicutt et al. (2003). | E(B-V)GALb,cb,cfootnotemark: | SFRaa Data obtained from Kennicutt et al. (2003). |
|---|---|---|---|---|---|---|---|---|
| (J2000.0) | (J2000.0) | (arcmin) | (Mpc) | (mag) | (mag) | () | ||
| NGC 3031 (M81) | 09 55 33.2 | +69 03 55 | SAab | 26.9 14.1 | 3.7 | -21.2 | 0.080 | 1.1 |
| NGC 4536 | 12 34 27.0 | +02 11 17 | SABbc | 7.6 3.2 | 15.0 | -20.8 | 0.018 | 3.7 |
| NGC 5194 (M51a) | 13 29 52.7 | +47 11 43 | SABbc | 11.2 6.9 | 7.7 | -21.4 | 0.035 | 5.4 |
| NGC 6946 | 20 34 52.3 | +60 09 14 | SABcd | 11.5 9.8 | 5.6 | -21.3 | 0.342 | 2.2 |
| NGC 7331 | 22 37 04.1 | +34 24 56 | SAb | 10.5 3.7 | 14.7 | -21.8 | 0.091 | 4.2 |
2.2. Image Processing and Aperture Photometry
Throughout this paper, we derive the total IR luminosity from 8.0 m and 24 m luminosities by adopting the calibration in Calzetti et al. (2005), where the 8.0 m luminosity has been converted into dust-only emission by subtracting stellar contribution. The 3.6 m images are employed as the reference of stellar emission by using the scale factor of 0.37 provided in Thilker et al. (2007). Eventually, we have four-band images taken with the GALEX and Spitzer for this study: FUV, NUV, 8.0 m (dust only), and 24 m. All these images have been registered to the same pixel scale and coordinate. The point spread function of each image has been convolved to match the 24 m resolution (FHWM ).
In this work, we design the strategy to measure compact clusters and background diffuse regions in galaxies respectively, and therefore attempt to classify young and evolved populations correspondingly. In order to extract as simplex young populations within clusters as possible, it is necessary to exclude diffuse emission of local underlying background at common positions. We mask all the flux peaks above 3 background level in different images. The subtraction of local background has been conducted by the median-filtering approach, that is, for each flux-peak-masked image, every pixel value is replaced by the median value of all the pixels enclosed by a square or rectangular window centered on this pixel. The window size is fixed for every one galaxy but various for different galaxies. This galaxy-dependent scale is determined by two criteria: the window size should be large enough to enclose sufficient background pixels in the flux-peak-masked images, and in the meanwhile the window cannot extend beyond local areas. In this situation, we define the final window size as a compromise by manual adjustment. By means of this approach, we produce a group of filtered images which represent the local background emission for each waveband image. This background-fitting procedure is taken with the MEDIAN program in the IRAF software333IRAF (the Image Reduction and Analysis Facility) is a general purpose software system for the reduction and analysis of astronomical data, and distributed by the National Optical Astronomy Observatories which is operated by the Association of Universities for Research in Astronomy (AURA), Inc. under cooperative agreement with the National Science Foundation.. As a result, there are two sets of images for photometry in this work: the one for which both of global background and local background have been subtracted is employed to measure clusters, and the other for which only global background has been subtracted is applied to photometry for background diffuse regions.
Aperture photometry is performed in the FUV, NUV, 8 m, and 24 m images for the galaxies in our sample. We employ circular apertures in photometry for galactic subregions. The aperture size for each galaxy is determined mainly by the spatial resolution of the 24 m images: the photometric apertures should be large enough to adequately enclose the resolved objects, and meanwhile small enough to avoid as much emission from other adjacent sources as possible. As a consequence, the radii of the apertures are galaxy-dependent, but for each one galaxy they are fixed in all images: 8.5 arcsec for NGC 3031 and NGC 6946, and 6.8 arcsec for NGC 4536, NGC 5194, and NGC 7331. Correspondingly, the physical scales of the radii at the distances of the galaxies are 152 pc for NGC 3031, 495 pc for NGC 4536, 254 pc for NGC 5194, 231 pc for NGC 6946, and 485 pc for NGC 7331, approximately. We detect emission peaks by the SExtractor software (Bertin & Arnouts, 1996) in the GALEX FUV images, and these detected UV-emitting sources are defined as UV clusters representing young stellar populations inside galaxies. Fluxes of the UV clusters are extracted with the photometric apertures from the images for which both of global background and local background have been subtracted. Photometry for regions in galactic local background which represents evolved stellar populations is performed in the global-background-subtracted images. We place photometric apertures for local background regions on areas between the UV cluster apertures, for instance, on the bulge, inter spiral arms, and outskirts, to cover as much local background as possible, and meanwhile to avoid overlap with each other. The measured UV clusters with fluxes above 3 level of local background deviation in the global-plus-local-background-subtracted images are selected in this work, and likewise, the measured local background regions with fluxes above 3 level of global background deviation in the global-background-subtracted images are adopted. Integrated fluxes of entire galaxies are measured by employing large elliptical apertures of which major and minor axes are determined by eye to enclose the main body of each one galaxy. We also extract photometry of circular or elliptical apertures for galactic center areas.
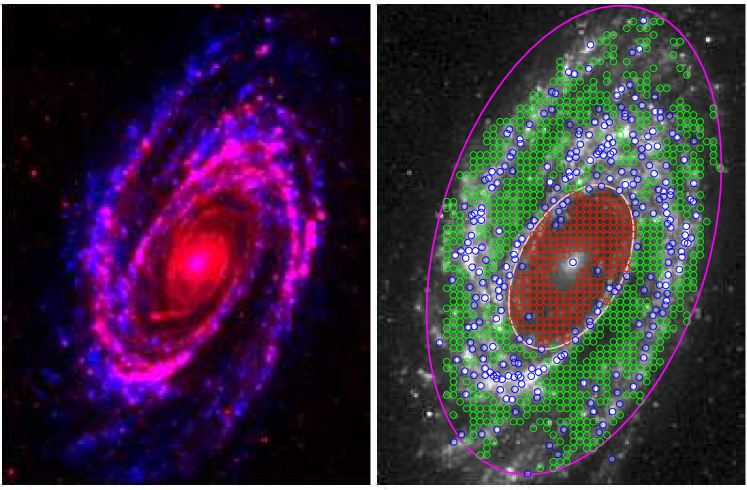
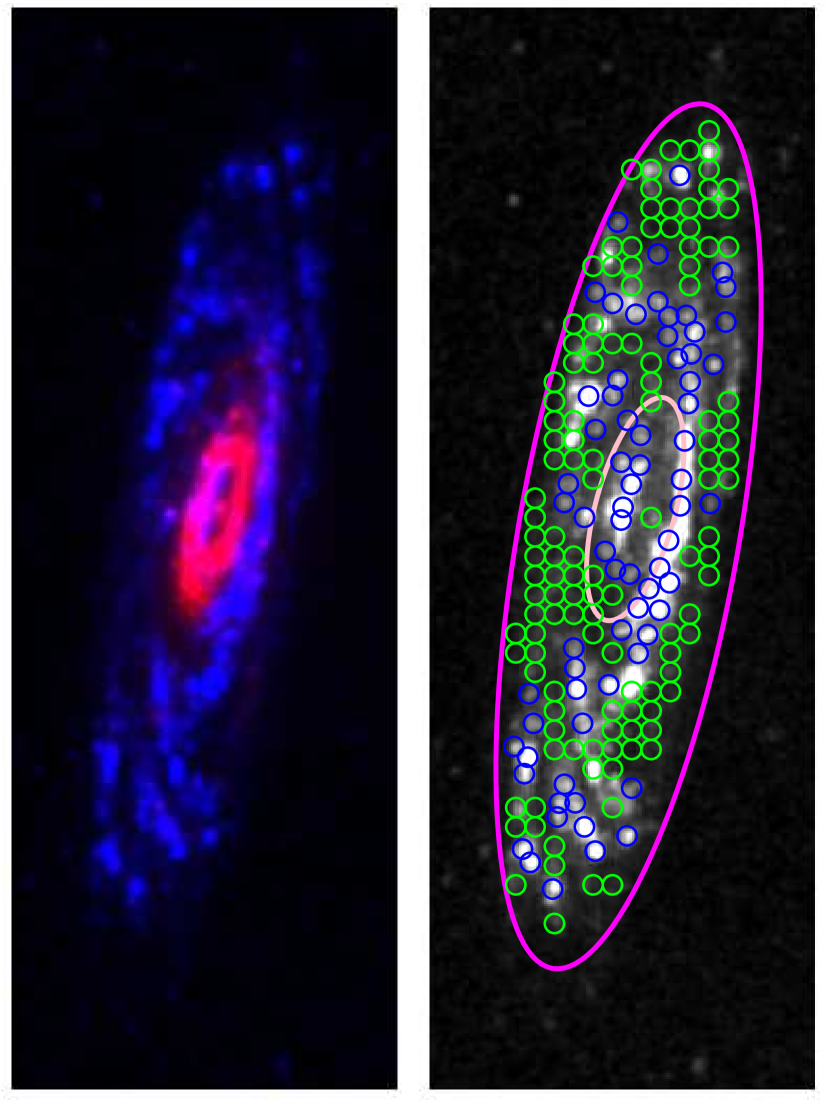
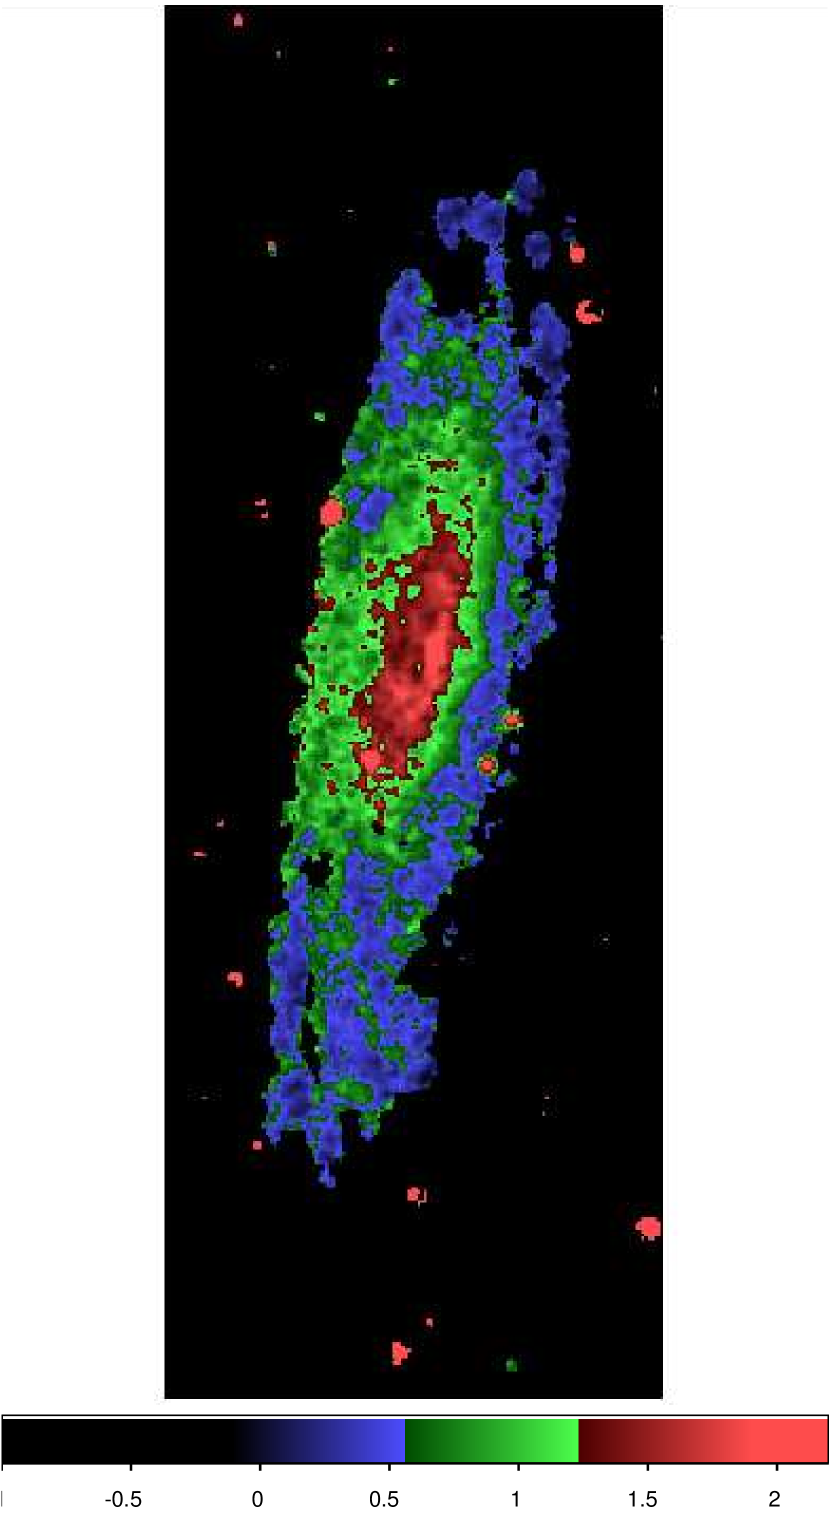
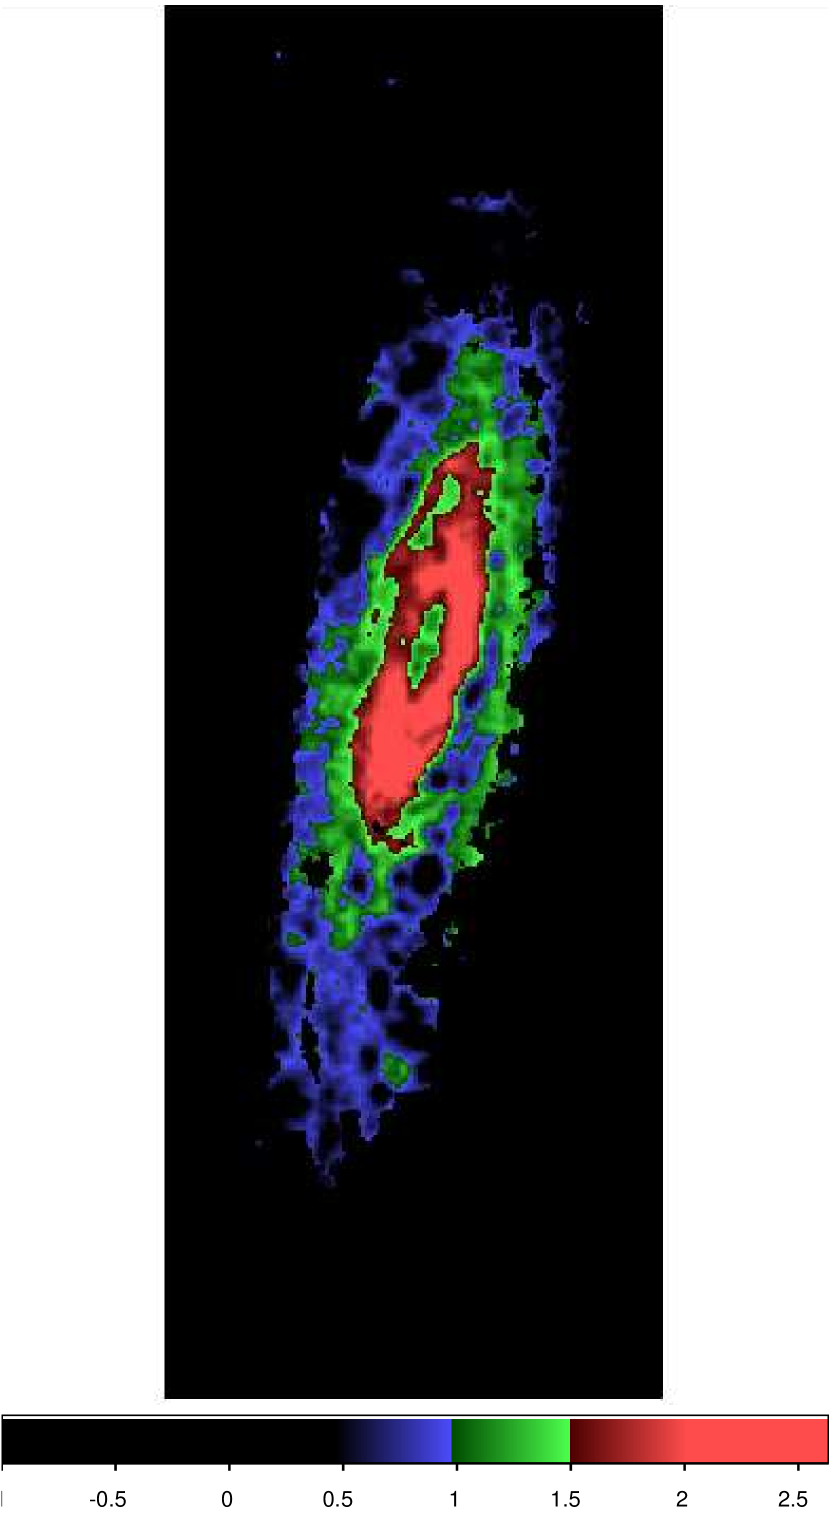
Figure 2 depicts the appearance of the galaxy NGC 3031 from the UV and IR points of view and the photometric apertures applied to this galaxy as an example. Since for this galaxy the bulge can be clearly resolved at all wavebands which is believed as the oldest part of the galaxy, we further divide the sampled local background regions into disk regions and bulge regions to distinguish the oldest populations in this galaxy. The left panel of this figure shows a two-color composite image of NGC 3031, where we can see FUV and 24 m emission radiate predominantly along the spiral arms, and in the bulge the FUV starlight mostly vanishes but the 24 m dust emission retains a considerable amount. In the right panel of Figure 2, the photometric apertures employed for the UV clusters, the local background regions in disk and bulge, the whole bulge area, and the entire galaxy are illustrated. Similarly, we present the two-color composite image and the exhibition of apertures for NGC 7331 in Figure 3. This galaxy hosts a dust ring in the center, and we can see this prominent character in the left panel of Figure 3.
The FUV and NUV photometric fluxes are corrected for Galactic foreground extinction by using the conversion factors provided in Gil de Paz et al. (2007): and , and the color excess of Galactic extinction of each galaxy in our sample is obtained from the NASA/IPAC Extragalactic Database444http://ned.ipac.caltech.edu/ where the Schlegel et al. (1998) Galactic dust map is quoted, with the ratio of total to selective extinction (note that is independent on ). In this paper, we use color as a surrogate for the UV spectral slope , on a basis of the conversion between UV spectral slope and UV photometric flux ratio calibrated in K04 paper. Aperture corrections are applied to the 8 and 24 m photometric fluxes following the guidance of the IRAC and MIPS handbooks provided in the Spitzer Science Center555http://ssc.spitzer.caltech.edu/. The parameter IRX is calculated according to its definition , where , and L(IR) ( L(31100 m) as defined in C05 paper) is derived from 8 m and 24 m luminosities via C05 calibration:
| (1) |
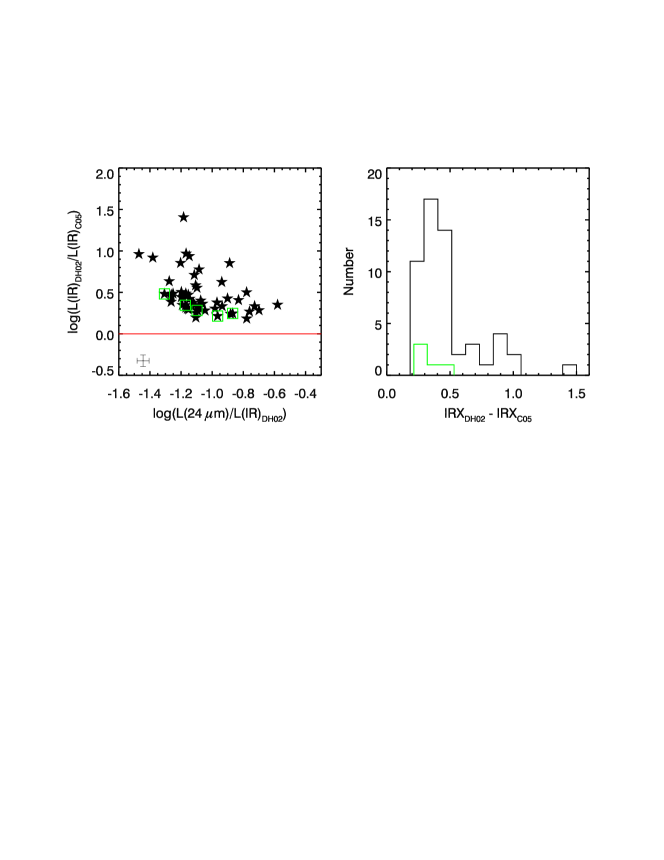
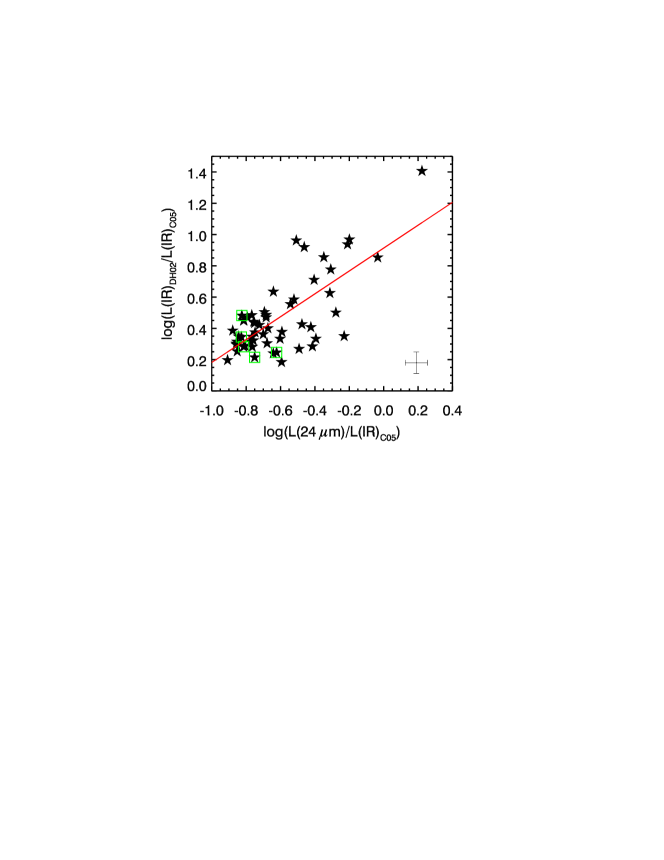
Equation (1) is calibrated on a basis of young star-forming regions (see Calzetti et al., 2005), and thus has the potential to underestimate IR luminosity when evolved stellar populations account for a considerable amount of dust-heating. In the Appendix, we examine the possible bias in this calibration and the impact it has on our conclusions.
In this work, uncertainties assigned to the photometric measurements are estimated as a quadratic sum of the background deviation and calibration uncertainties in relevant images. The background deviation is introduced by the background subtraction process. For the photometry of the UV clusters, the background deviation is calculated from the global-plus-local-background-subtracted images; for the local background regions and the integrated galaxies, the background deviation is derived from the global-background-subtracted images. The calibration uncertainties quoted in the quadrature are 0.05 for GALEX FUV magnitude and 0.03 for GALEX NUV magnitude resulting in an uncertainty of about 0.06 mag in ( errors, Morrissey et al., 2007), 10% for IRAC 8 m flux (Dale et al., 2007), and 4% for MIPS 24 m flux (Engelbracht et al., 2007).
The measured luminosities from the aperture photometry are listed in Tables 2 and 3 for the UV clusters and the local background regions respectively.
| ID | R.A.aa Position of the apertures on the sky, in units of degree. | Dec.aa Position of the apertures on the sky, in units of degree. | L(FUV)b,cb,cfootnotemark: | L(NUV)b,cb,cfootnotemark: | L(8 m-dust)b,db,dfootnotemark: | L(24 m)b,db,dfootnotemark: |
|---|---|---|---|---|---|---|
| (Cluster Number) | (J2000.0) | (J2000.0) | (ergs s-1) | (ergs s-1) | (ergs s-1) | (ergs s-1) |
| NGC 3031-CLU001 | 148.747 | 69.236 | 4.41e+39 2.19e+38 | 2.98e+39 1.19e+38 | 1.01e+39 1.14e+38 | 8.36e+38 4.44e+37 |
| NGC 3031-CLU002 | 148.853 | 69.219 | 1.11e+40 5.27e+38 | 7.46e+39 2.26e+38 | 4.31e+38 6.83e+37 | 1.64e+38 2.99e+37 |
| NGC 3031-CLU003 | 148.755 | 69.216 | 6.34e+39 3.07e+38 | 3.97e+39 1.40e+38 | 4.29e+39 4.32e+38 | 2.97e+39 1.22e+38 |
| NGC 4536-CLU001 | 188.576 | 2.223 | 3.03e+40 1.62e+39 | 2.27e+40 9.08e+38 | 1.04e+40 2.31e+39 | 4.28e+39 1.19e+39 |
| NGC 4536-CLU002 | 188.580 | 2.221 | 8.82e+40 4.23e+39 | 6.02e+40 1.81e+39 | 2.40e+40 3.16e+39 | 1.21e+40 1.27e+39 |
| NGC 4536-CLU003 | 188.575 | 2.214 | 4.18e+40 2.12e+39 | 2.95e+40 1.05e+39 | 3.64e+40 4.19e+39 | 2.06e+40 1.44e+39 |
| NGC 5194-CLU001 | 202.481 | 47.111 | 6.75e+39 1.01e+39 | 3.95e+39 9.41e+38 | 1.25e+40 2.36e+39 | 4.04e+39 1.19e+39 |
| NGC 5194-CLU002 | 202.515 | 47.264 | 3.03e+40 1.72e+39 | 2.29e+40 1.13e+39 | 2.78e+40 3.42e+39 | 1.96e+40 1.41e+39 |
| NGC 5194-CLU003 | 202.517 | 47.260 | 3.46e+40 1.89e+39 | 2.78e+40 1.22e+39 | 4.29e+40 4.73e+39 | 3.50e+40 1.83e+39 |
| NGC 6946-CLU001 | 308.719 | 60.213 | 1.11e+41 5.29e+39 | 8.98e+40 3.08e+39 | 3.94e+40 4.01e+39 | 2.68e+40 1.14e+39 |
| NGC 6946-CLU002 | 308.727 | 60.213 | 8.61e+40 4.14e+39 | 6.47e+40 2.55e+39 | 1.20e+40 1.44e+39 | 8.23e+39 5.17e+38 |
| NGC 6946-CLU003 | 308.730 | 60.210 | 4.40e+40 2.23e+39 | 3.69e+40 2.06e+39 | 6.76e+39 1.04e+39 | 2.53e+39 4.12e+38 |
| NGC 7331-CLU001 | 339.257 | 34.481 | 3.55e+40 1.72e+39 | 2.71e+40 9.22e+38 | 2.07e+40 3.43e+39 | 1.00e+40 1.42e+39 |
| NGC 7331-CLU002 | 339.271 | 34.472 | 9.75e+39 5.94e+38 | 7.90e+39 5.66e+38 | 1.43e+40 3.08e+39 | 4.59e+39 1.38e+39 |
| NGC 7331-CLU003 | 339.246 | 34.462 | 1.54e+40 8.16e+38 | 1.16e+40 6.14e+38 | 2.38e+40 3.62e+39 | 4.86e+39 1.38e+39 |
Note. — The aperture radius is 8.5 for NGC 3031 and NGC 6946, and 6.8 for NGC 4536, NGC 5194, and NGC 7331. This table is available in its entirety in the online journal. A portion is shown here for guidance regarding its form and content.
| ID | R.A.aa Position of the apertures on the sky, in units of degree. | Dec.aa Position of the apertures on the sky, in units of degree. | L(FUV)b,cb,cfootnotemark: | L(NUV)b,cb,cfootnotemark: | L(8 m-dust)b,db,dfootnotemark: | L(24 m)b,db,dfootnotemark: |
|---|---|---|---|---|---|---|
| (Region Number) | (J2000.0) | (J2000.0) | (ergs s-1) | (ergs s-1) | (ergs s-1) | (ergs s-1) |
| NGC 3031-BKG001 | 148.953 | 68.919 | 1.64e+39 7.83e+37 | 1.16e+39 1.10e+38 | 3.21e+38 5.36e+37 | 5.66e+37 1.11e+37 |
| NGC 3031-BKG002 | 148.926 | 68.919 | 9.12e+38 4.51e+37 | 7.09e+38 1.07e+38 | 4.32e+38 6.09e+37 | 1.35e+38 1.21e+37 |
| NGC 3031-BKG003 | 148.926 | 68.924 | 7.42e+38 3.75e+37 | 6.10e+38 1.07e+38 | 3.28e+38 5.40e+37 | 1.26e+38 1.20e+37 |
| NGC 4536-BKG001 | 188.653 | 2.144 | 1.92e+40 9.14e+38 | 1.29e+40 7.11e+38 | 4.42e+39 4.90e+38 | 1.38e+39 1.58e+38 |
| NGC 4536-BKG002 | 188.672 | 2.148 | 5.30e+39 2.77e+38 | 5.96e+39 6.35e+38 | 5.30e+39 5.71e+38 | 3.82e+39 2.13e+38 |
| NGC 4536-BKG003 | 188.653 | 2.148 | 2.69e+40 1.27e+39 | 1.93e+40 8.17e+38 | 4.55e+39 5.03e+38 | 7.35e+38 1.51e+38 |
| NGC 5194-BKG001 | 202.475 | 47.113 | 3.22e+39 1.58e+38 | 2.70e+39 1.02e+38 | 5.87e+39 5.94e+38 | 2.21e+39 9.72e+37 |
| NGC 5194-BKG002 | 202.469 | 47.113 | 4.40e+39 2.12e+38 | 3.08e+39 1.10e+38 | 8.38e+39 8.43e+38 | 3.45e+39 1.44e+38 |
| NGC 5194-BKG003 | 202.463 | 47.113 | 2.52e+39 1.27e+38 | 1.97e+39 8.74e+37 | 4.82e+39 4.91e+38 | 2.11e+39 9.37e+37 |
| NGC 6946-BKG001 | 308.680 | 60.078 | 1.23e+40 7.71e+38 | 1.29e+40 3.08e+39 | 3.65e+39 5.36e+38 | 1.72e+39 9.66e+37 |
| NGC 6946-BKG002 | 308.765 | 60.083 | 2.09e+40 1.11e+39 | 1.72e+40 3.10e+39 | 2.54e+39 4.68e+38 | 1.02e+39 7.92e+37 |
| NGC 6946-BKG003 | 308.680 | 60.083 | 1.14e+40 7.38e+38 | 1.12e+40 3.08e+39 | 9.55e+39 1.03e+39 | 3.65e+39 1.61e+38 |
| NGC 7331-BKG001 | 339.286 | 34.335 | 7.08e+39 3.56e+38 | 7.38e+39 1.78e+39 | 1.28e+40 1.30e+39 | 3.63e+39 2.04e+38 |
| NGC 7331-BKG002 | 339.295 | 34.342 | 8.20e+39 4.06e+38 | 8.61e+39 1.78e+39 | 9.28e+39 9.56e+38 | 3.40e+39 1.97e+38 |
| NGC 7331-BKG003 | 339.277 | 34.342 | 6.00e+39 3.09e+38 | 6.39e+39 1.77e+39 | 1.76e+40 1.78e+39 | 5.95e+39 2.77e+38 |
Note. — The aperture radius is 8.5 for NGC 3031 and NGC 6946, and 6.8 for NGC 4536, NGC 5194, and NGC 7331. This table is available in its entirety in the online journal. A portion is shown here for guidance regarding its form and content.
2.3. Stellar Population Synthesis Modeling
We construct stellar population spectra with a series of ages via the STARBURST99 library of evolutionary population synthesis (Leitherer et al., 1999; Vázquez & Leitherer, 2005). The simulation is on assumptions of simple stellar populations born with an instantaneous burst, the solar metallicity of , and the Kroupa (2002) initial mass function (IMF) with exponents of 1.3 over 0.10.5 and 2.3 over 0.5100 for stellar populations in the modeled spectra. The assumption of an instantaneous burst is a simplified account for stellar populations contained in galactic subregions, and this scenario of simple stellar populations highlights the age signature in the IRX-UV function. However, in view of any possible variation in SFH within the measured regions inside galaxies, descriptions with such a scenario are not sufficient to make realistic estimates of age. We will discuss more complex SFHs by adopting scenarios of composite stellar populations in Section 6.
All the modeled stellar population spectra are charged with a series of dust attenuation, and in this procedure we employ the starburst attenuation law (Calzetti et al., 2000, hereafter denoted as C00) to produce such attenuation with . Dust attenuation and stellar population age are the variables in the products of modeling. C00 starburst attenuation law is based on the same sample as fitted with K04 empirical relation, and the reproduced IRX-UV curves are an extension of K04 empirical curve in the age space, i.e., the IRX-UV relation with age as the second parameter. In this way, we establish an IRX-UV function with two parameters: dust attenuation and stellar population age, for the purpose of comparison with observational data. It is possible for attenuation law to vary with different environments, and the application of a common attenuation law to different galaxies and different galactic subregions aims at simplicity. In the second paper of this series (Paper II, Ye-Wei Mao et al. 2012, in preparation), we will focus on the issue of the IRX-UV properties related to attenuation/extinction law.
By convolving the modeled spectra with transmission curves of the GALEX FUV and NUV filters, we obtain FUV and NUV luminosities, and colors; the total IR luminosity in the modeling is calculated as a sum of all the attenuated stellar emission, on a basis of the energy balance assumption that the attenuated starlight is re-emitted by interstellar dust as IR continuum of a equal amount. As a result we reproduce the IRX-UV relation as a function of stellar population age.
3. THE IRX-UV RELATION
With the measurements described above, in this section, we analyze the IRX-UV diagrams for the galaxies in our sample: NGC 3031, NGC 4536, NGC 5194, NGC 6946, and NGC 7331. Figures 48 show the IRX-UV diagrams for the UV clusters and the local background regions inside these galaxies, with relevant empirical and modeled curves superimposed. Taking a general view of each of these diagrams we can see that the data points in each plot compose a continuous locus and spread in a redder color range or a lower IRX level than K04 starburst empirical reference. In the following subsections, we present respective descriptions for these galaxies.
3.1. NGC 3031 (M81)
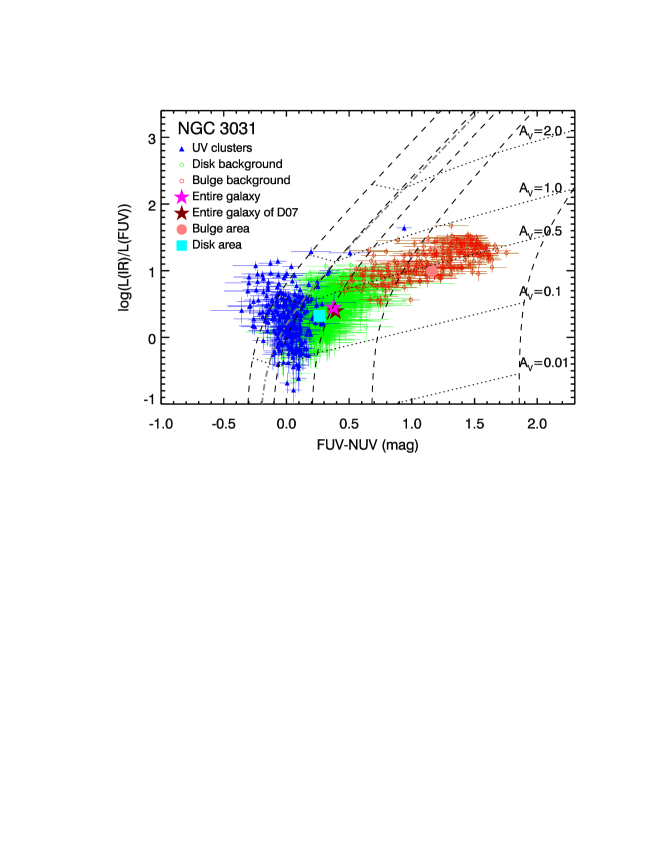
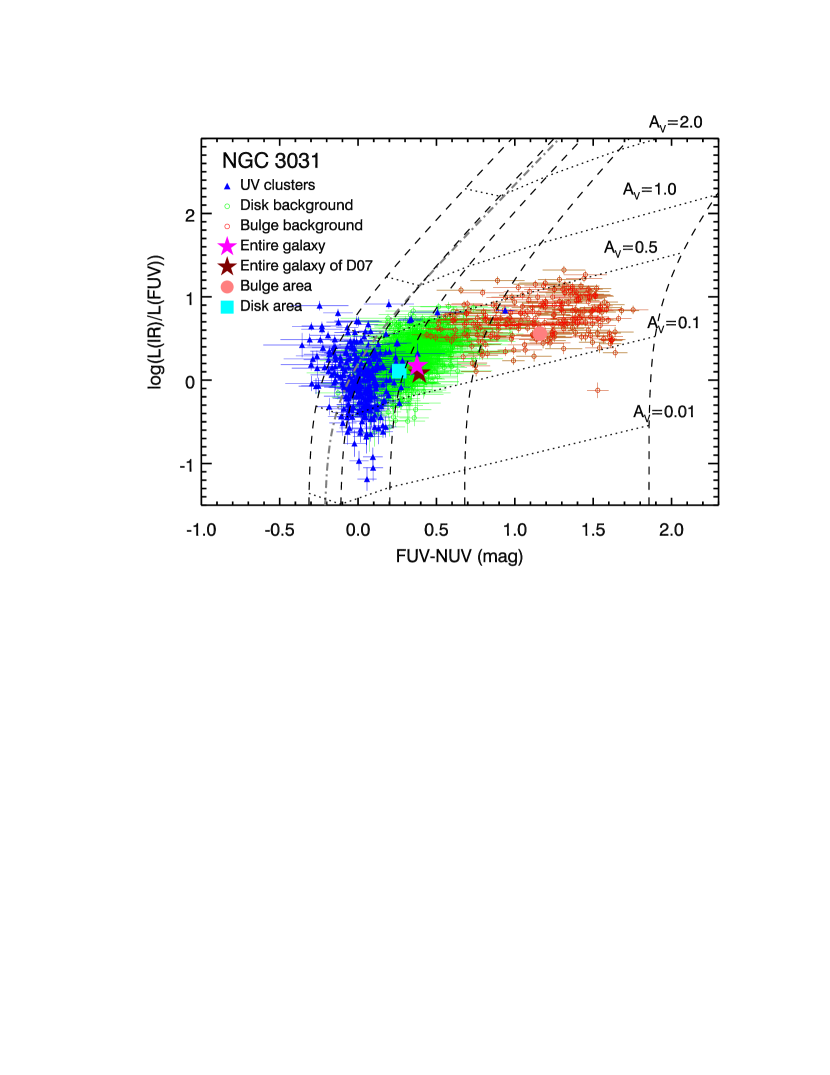
For NGC 3031, we divide the measured subregions into three populations: UV clusters, disk background regions, and bulge background regions, representing young, evolved, and the oldest populations in this galaxy, respectively, as described in the above section. Figure 4 shows the IRX-UV distributions for the three populations, the integrated galaxy, and the integrated bulge, with K04 empirical curve and the C00-attenuation-modeled curves for constant ages superimposed. The locus composed of all the data points presents a large departure from K04 empirical curve, and appears to have flatter IRXs with increasing colors. The most remarkable feature in this figure is the clear separation of different populations. Most of the data points populate in the IRX range between 0.0 and 1.0, but the different populations appear to lie in possession of their own UV color ranges: the UV clusters occupy the range between -0.3 and 0.2 mag, the disk background regions spread in the range of 0.20.7 mag, and the bulge background regions extend from 0.7 to 1.8 mag in , and are thus embedded in the reddest zone of the panel. The population classification enables us to obviously see the increasing perpendicular distances from the starburst empirical curve with aging of stellar populations, and this behavior is in rough similarity to K04 prediction. The separation of different populations provides a robust interpretation of the wide spread of the data points with the effects of stellar population age.
In Figure 4, we overplot the IRX-UV curves at five certain stellar population ages: 2 Myr, 8 Myr, 100 Myr, 300 Myr, and 500 Myr, reproduced by the two-parameter modeling. In the diagram, the modeled curves are displayed in parallel with K04 empirical line, and the 8 Myr-age curve overlaps well with this empirical line. With stellar populations evolving, the relevant IRX-UV curves shift towards redder colors, due to the inherently red UV colors of evolved stellar populations. We also connect constant dust attenuation on each age-fixed curve, and the tracks appear to be slightly steeper than horizontal (see the dotted lines in Figure 4), which shows that IRX is not perfectly independent on age. The curves at fixed age and the tracks of constant dust attenuation are in agreement with the model products from the same attenuation law in Calzetti et al. (2005) and Boquien et al. (2009). The modeled grid illustrates clearly the behaviors of dust attenuation and age parameters in the IRX-UV function. The model here is based on the SFH of an instantaneous burst, and Section 6 will present the cases of more complex SFHs.
| Galaxy | L(FUV) | L(NUV) | L(8 m-dust) | L(24 m) | L(IR) | |
|---|---|---|---|---|---|---|
| ( ergs s | ( ergs s-1) | ( ergs s-1) | ( ergs s-1) | ( ergs s-1) | ||
| UV Clusters/Entire Galaxy | NGC 3031 | 0.272 0.013 | 0.203 0.006 | 0.226 0.023 | 0.351 0.015 | 0.236 0.022 |
| NGC 4536 | 0.227 0.011 | 0.203 0.006 | 0.557 0.070 | 0.771 0.040 | 0.592 0.070 | |
| NGC 5194 | 0.291 0.014 | 0.287 0.008 | 0.329 0.033 | 0.437 0.018 | 0.346 0.033 | |
| NGC 6946 | 0.242 0.012 | 0.199 0.006 | 0.207 0.021 | 0.254 0.010 | 0.213 0.020 | |
| NGC 7331 | 0.239 0.011 | 0.217 0.006 | 0.240 0.024 | 0.295 0.012 | 0.249 0.024 | |
| Galaxy Center/Entire Galaxy | NGC 3031 | 0.087 0.006 | 0.178 0.007 | 0.185 0.026 | 0.352 0.020 | 0.211 0.028 |
| NGC 4536 | 0.234 0.016 | 0.270 0.011 | 0.774 0.109 | 0.881 0.050 | 0.795 0.106 | |
| NGC 5194 | 0.103 0.007 | 0.152 0.006 | 0.216 0.031 | 0.255 0.014 | 0.224 0.030 | |
| NGC 6946 | 0.021 0.001 | 0.026 0.001 | 0.203 0.029 | 0.313 0.018 | 0.222 0.030 | |
| NGC 7331 | 0.157 0.010 | 0.265 0.011 | 0.584 0.083 | 0.629 0.036 | 0.593 0.079 | |
| Galaxy Luminosity (OURs) | NGC 3031 | 4.76 0.224 | 4.50 0.126 | 2.57 0.257 | 0.94 0.038 | 7.08 0.668 |
| NGC 4536 | 8.47 0.399 | 7.68 0.216 | 15.0 1.500 | 11.1 0.442 | 47.7 4.490 | |
| NGC 5194 | 20.2 0.952 | 21.2 0.593 | 27.0 2.700 | 11.6 0.463 | 76.8 7.240 | |
| NGC 6946 | 18.9 0.890 | 21.9 0.628 | 16.9 1.690 | 8.61 0.344 | 49.8 4.690 | |
| NGC 7331 | 6.61 0.311 | 8.84 0.251 | 31.8 3.180 | 12.1 0.482 | 88.1 8.310 | |
| Galaxy Luminosity (D07) | NGC 3031 | 5.23 0.726 | 5.05 0.697 | 2.24 0.637 | 0.95 0.037 | 6.34 1.470 |
| NGC 4536 | 8.63 1.200 | 7.52 1.040 | 14.7 2.050 | 11.2 0.454 | 47.1 5.750 | |
| NGC 5194 | 23.9 3.310 | 26.2 3.630 | 27.5 3.780 | 12.0 0.504 | 78.6 9.530 | |
| NGC 6946 | 15.2 2.120 | 19.4 2.700 | 17.0 2.330 | 8.93 0.355 | 50.3 6.040 | |
| NGC 7331 | 7.48 1.040 | 9.59 1.330 | 31.7 4.640 | 13.3 0.764 | 89.6 12.30 |
By comparing the observational data and the model-based curves in Figure 4, we can see that a vast number of the data points are enclosed in the attenuation range between and . Although the separate distributions of different populations offer an obvious evidence of the age effects on the IRX-UV relation, the population separation in the diagram cannot quantitatively correspond to the model indicators. The data locus of any single population is not in agreement with the modeled IRX-UV curves with fixed ages. According to the modeled grid, about a half of the disk background regions have to be partitioned into the age range younger than 100 Myr and therefore cannot be age-distinguished from most of the UV clusters in this situation, while a few number of UV clusters with blue color lie out of the model coverage. Error bars of the data points are displayed in this diagram. The typical uncertainties in are 0.07 mag for the UV clusters and 0.14 mag for the local background regions, and in IRX the typical uncertainty is 0.06 for either the UV clusters or the local background regions. We inspect the blue clusters located out of the model coverage and find the median uncertainty in is 0.13 mag and the maximum is 0.25 mag. Although these clusters have relatively large errors which would cause dispersion in the data distribution, the photometric uncertainties are inadequate to account for the systematic discrepancy between the data distribution and the model expectation. Conclusively, the IRX-UV diagram for NGC 3031 shows the impacts of stellar population age, but there are insufficiencies in the interpretation of the data distribution even though stellar population age is addressed as the second parameter in the IRX-UV function. It should be note that, in this section we characterize the observational results with the scenario assuming simple stellar populations with an instantaneous burst, which is an simplification of stellar populations for the subregions inside galaxies. More complicated SFHs with exponentially decreasing SFRs will be discussed in Section 6, and offer complementary scenarios for interpreting the observational properties.
The integrated galaxy of NGC 3031 is located at = 0.38 0.06 mag and IRX = 0.17 0.05, encompassed with the disk background regions, while the integrated bulge populates at = 1.16 0.06 mag and IRX = 0.56 0.05, in large disparity from the entire galaxy. In Table 4, we provide the luminosity contributions of the UV clusters and the center areas to the integrated measurements of entire galaxies. From this table, we can see that the total luminosity of the UV clusters account for 35% of 24 m and less than 30% of any other waveband integrated luminosity of NGC 3031. This percentage presentation indicates that the primary fraction of the integrated luminosities of NGC 3031 comes from the local background including the local background regions we have measured, the areas between the photometric apertures we are unable to extract, and the local background at the positions of the UV clusters we have subtracted. The contributions of the UV clusters are of less but non-negligible significance, while the contributions of the whole bulge area are quite trivial, which further suggests the dominant role of the disk background in the integrated measurements, and offers an explanation of the location of the integrated galaxy in the IRX-UV diagram.
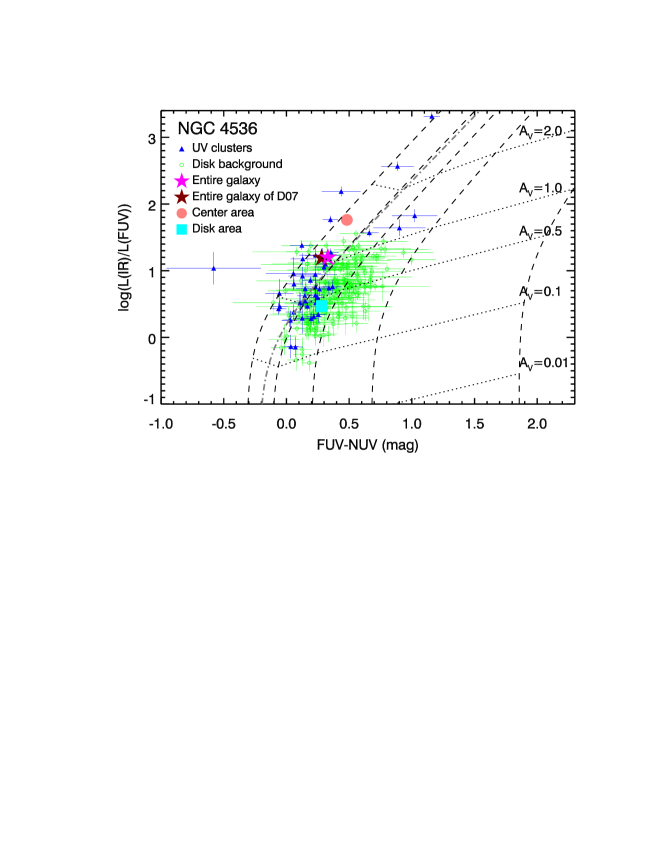
3.2. NGC 4536
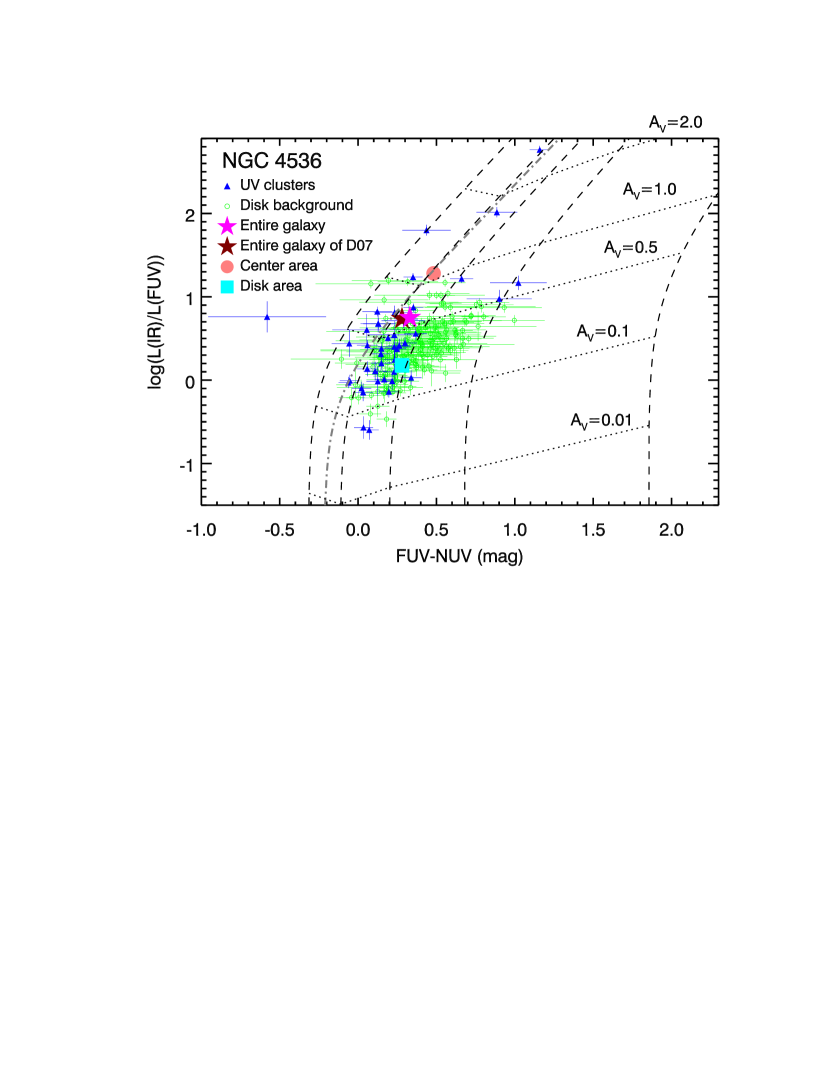
Figure 5 shows the IRX-UV relation for the UV clusters and the local background regions within the galaxy NGC 4536. We can see the locus of the UV clusters coincidentally follows K04 curve with an offset of 0.3 mag on average towards redder colors at fixed IRX, and the data points distribute along the modeled tracks of constant ages. The studies of this galaxy on the radial profile (Muñoz-Mateos et al., 2009) and on the pixel-by-pixel basis (Boquien et al., 2012) have obtained the consistent result: the distribution of data points for this galaxy is coherent with the starburst empirical relation. The UV clusters span a wide range in this diagram approximately from 0.1 to 1.2 mag in and from 0.7 to 2.8 in IRX, and the most number of the UV clusters are enclosed in the age range 100 Myr and extend over a large scale of the attenuation amount. The cluster with IRX 2.8 in this figure is extracted at the core of this galaxy, where intense star-forming activities occur and manufacture the strong IR emission by dust-heating. The local background regions systematically shift to redder colors than the UV clusters by a mean factor of 0.3 mag at fixed IRX. Consequently they extend to even older ages of over 300 Myr. The offset between the UV clusters and the local background regions in the diagram presents an obvious behavior of the age parameter in the modeled IRX-UV function.
The typical uncertainties in are 0.07 mag for the UV clusters and 0.12 for the local background regions, and in IRX are 0.08 for the UV clusters and 0.06 for the local background regions. There is no effective influence on the results in consideration of the photometric uncertainties.
The integrated galaxy lies at = 0.33 0.06 mag and IRX = 0.75 0.05, and the galactic center populates at = 0.48 0.06 mag and IRX = 1.28 0.05. Both of the points abut on the starburst empirical line as shown in Figure 5. Table 4 shows that the UV clusters contribute 20% of UV emission and more than a half of IR luminosity of the galaxy. This large IR contribution is due to the UV clusters in the center star-forming area. We can see that the whole center area accounts for even 80% of the total IR luminosity and 88% of the 24 m monochromatic luminosity of the galaxy, but the integrated FUV and NUV luminosities of NGC 4536 are dominated by the disk area. The contribution of the star-forming center to the integrated galaxy introduces the adjacency of the integrated galaxy to the starburst empirical line. As a result the star-forming center plays a primary role in the integrated IRX-UV feature for NGC 4536.
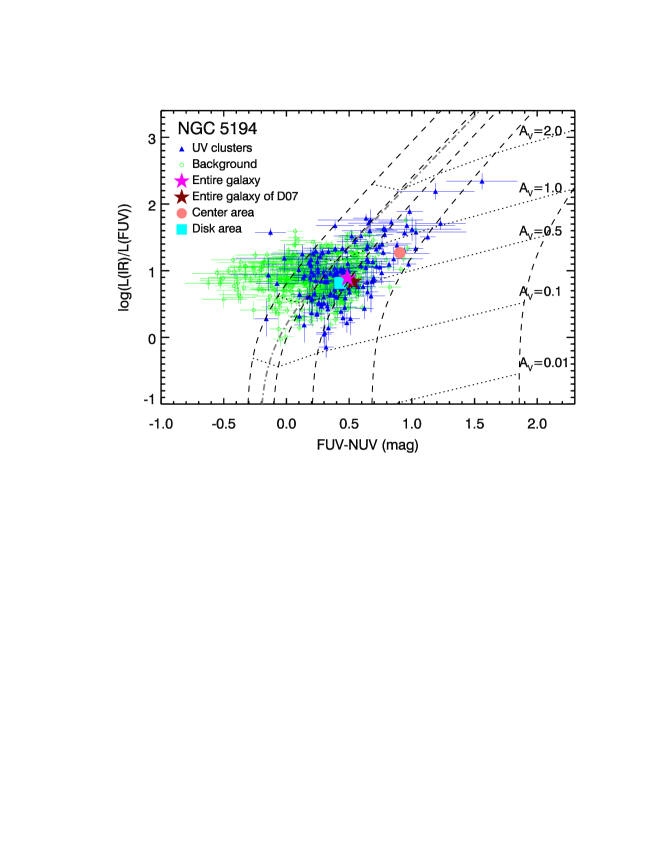
3.3. NGC 5194 (M51a)
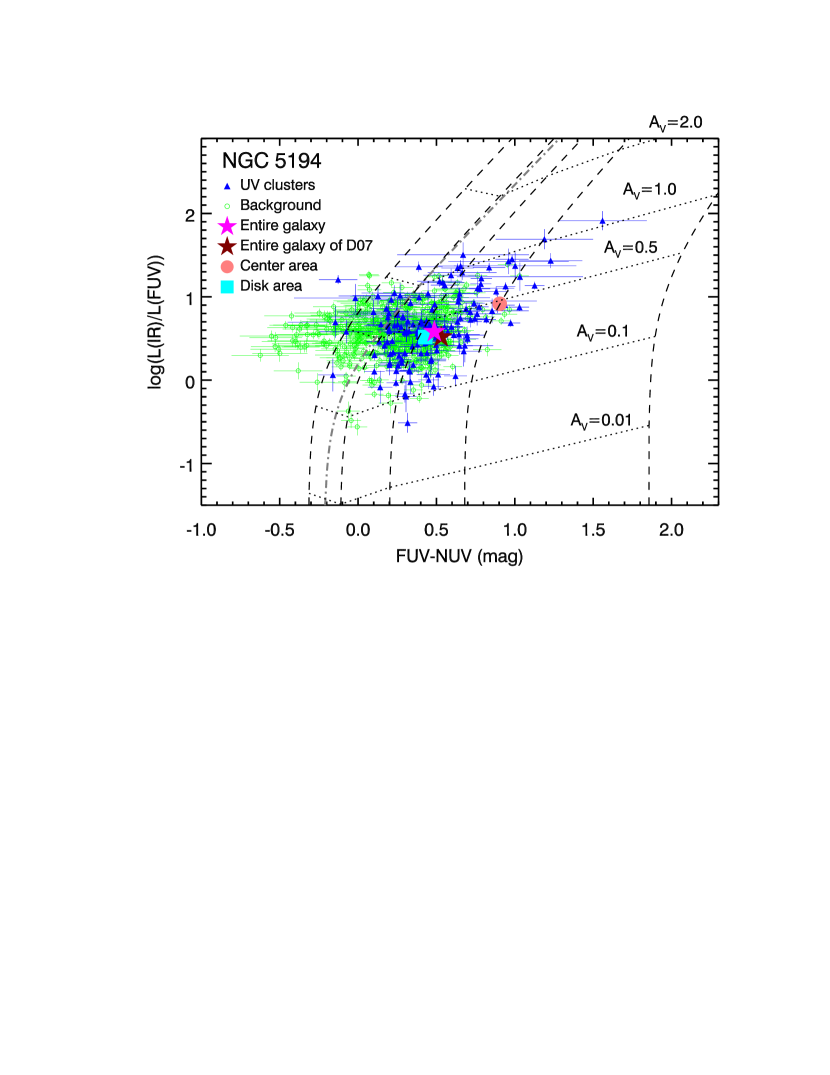
In Figure 6, the IRX-UV locus for the UV clusters of NGC 5194 appears to have redder UV colors with increasing IRX and in consequence a shallower trend than the empirical relation and the modeled curves. In the two-parameter scenario of model, the UV clusters with red color driving the locus shallower fail to reach high attenuation levels, and therefore leak into the old regime. The typical uncertainties for the UV clusters are 0.08 mag in and 0.07 in IRX. The uncertainties for the red clusters with mag and IRX 1.0 are relatively larger: 0.28 mag in and 0.11 in IRX. However, including the photometric uncertainties, the model description still tends to give an overestimate of age for the UV clusters, in particular, about a half number of the UV clusters have to be unreasonably enclosed in the age range of 100300 Myr. This phenomenon shows a discrepancy in characterizing the IRX-UV relation for NGC 5194 by the two-parameter scenario.
In contrast to NGC 3031 and NGC 4536, the NGC 5194 background regions are mixed with the UV clusters in the IRX-UV diagram, and even about a half of the local background regions show bluer UV colors than the bulk of the UV clusters. Hence, any age effect disappears. Through a visual inspection in images, we find that the typical background of diffuse emission is extremely weak within NGC 5194. Instead, in the areas of inter-arms and outskirts (the background regions with bluer color than the UV clusters populate mainly in outskirts of the galactic body), there are a great number of UV knots in small size with low luminosity. It is likely for the local background regions inside this galaxy to experience different SFHs, where long-term or even continuous star formation is supposed to take place. In this situation, the measured regions in background ought to contain a large number of young populations, and as a result, they should present properties similar to those of the UV clusters. More complex SFHs will be addressed in our discussion in Section 6.
The quantification of luminosity contributions in Table 4 suggests a very dim center area of NG5194 at UV and IR wavelength bands which accounts for 10% of FUV, 15% of NUV, and 22% of total IR luminosities of the entire galaxy. The integrated photometry of this galaxy is dominated by the disk luminosity, and the UV clusters contribute about 30% of FUV, NUV, and 8 m, and 44% of 24 m, and 35% of total IR luminosities to the integrated measurements of NGC 5194, which implies the local background contributes more than half of the integrated luminosities of the galaxy at all observational bands. However, in Figure 6, the point of the integrated galaxy is located at the position of = 0.49 0.06 mag and IRX = 0.58 0.05, not at the average position of the local background regions. The possible reason is that a number of the green points in the plot are not good proxies for representing the local background. They populate in the outskirts of the galactic body, and thus in a special instance of the background. The background regions which populate in between cluster-apertures, and at the positions of the UV clusters are unable to be extracted. These missed regions are believed to better signify the background properties in integrated measurements. Provisionally, in Figure 6 the extracted inter-arms regions are mixed with the UV clusters and considered to be relatively more representative.
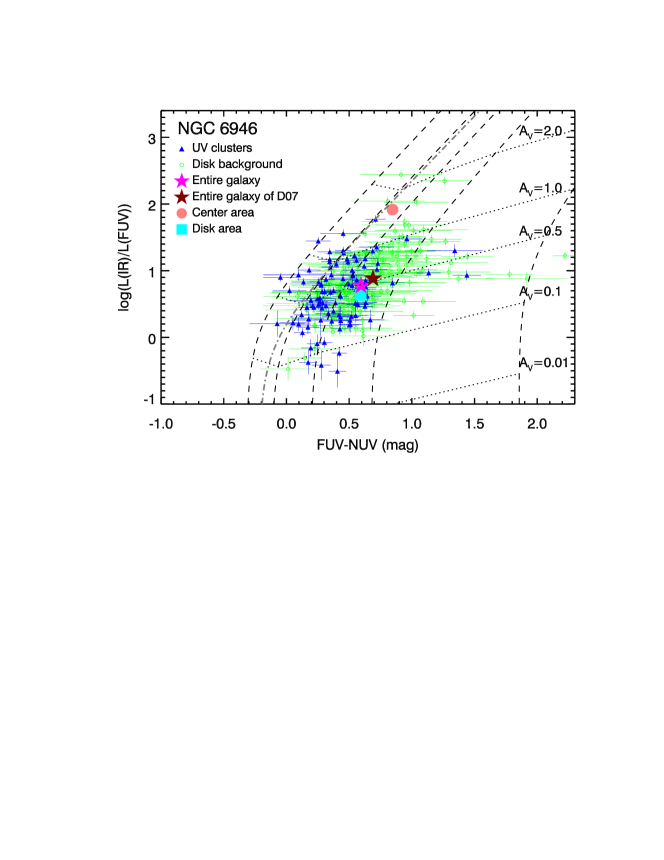
3.4. NGC 6946
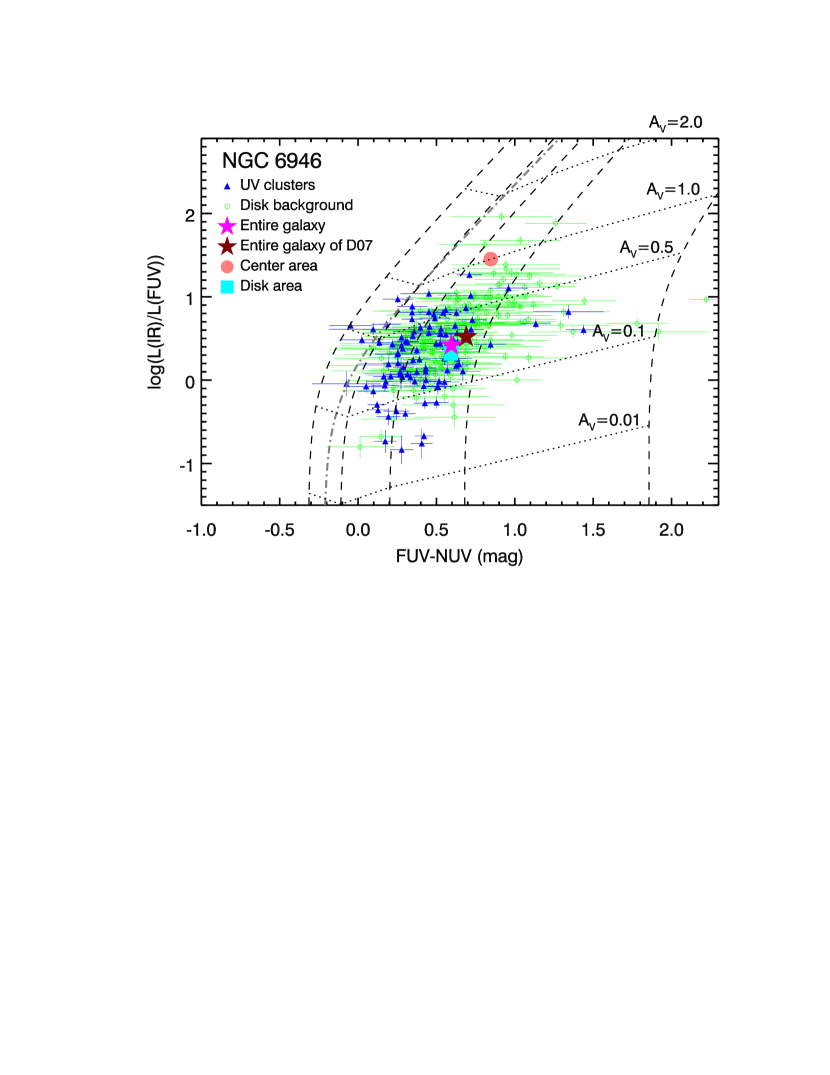
The IRX-UV diagram for NGC 6946 is displayed in Figure 7. The local background regions present a shift towards redder UV color than the UV clusters, even up to mag. However, the large scatter in the data distribution (0.5 mag in at fixed IRX) appears of more significance, and the signature of the age parameter tends to be faded by the dispersion. The photometric uncertainties for this galaxy are relatively larger than others in our sample. The typical uncertainty is 0.09 mag for the UV clusters and 0.25 mag for the local background regions, and the typical IRX uncertainty is 0.05 for either the UV clusters or the local background regions. The photometric uncertainties are one of the main sources of the scatter. It is worth noting that, the foreground Galactic extinction for this galaxy is extremely high, (see Table 1), in equivalency to . The accuracy for the Galactic dust map provided by Schlegel et al. (1998) is 16%, corresponding to an uncertainty of 0.055 in for NGC 6946. By inspecting the Schlegel et al. (1998) map, we obtain a standard deviation of 0.002 around the mean value of 0.342 in within the sky coverage of NGC 6946 (, see Table 1). The two contributions introduce additional uncertainties of 0.435 in FUV magnitude and 0.440 in NUV magnitude, and propagate to 0.005 mag in (due to the association between the uncertainties in FUV and NUV magnitudes) and 0.174 in IRX. These uncertainties have a very trivial influence on the IRX-UV relation. Nevertheless, if there is any significant variation in extinction law at the low Galactic latitude, FUV and NUV extinctions are likely to be biased for such a high level of .
It is shown in Table 4 that, at each waveband the total luminosity of the UV clusters accounts for 20%25% of the integrated luminosity of the galaxy, and a considerable amount of integrated emission of the galaxy comes from the galactic background; similar to NGC 5194, the center area of NGC 6946 presents no prominent feature, and the contribution of the center to the integrated measurements of the galaxy is insignificant. Correspondingly, the integrated galaxy lies at = 0.60 0.06 mag and IRX = 0.42 0.05 which is the average position of the local background regions, and the point of the center area populates at a remote place. The integrated NGC 6946 follows the scatter of its subregions and therefore presents the largest deviation in the IRX-UV location from the starburst empirical line in our sample (Figure 1).
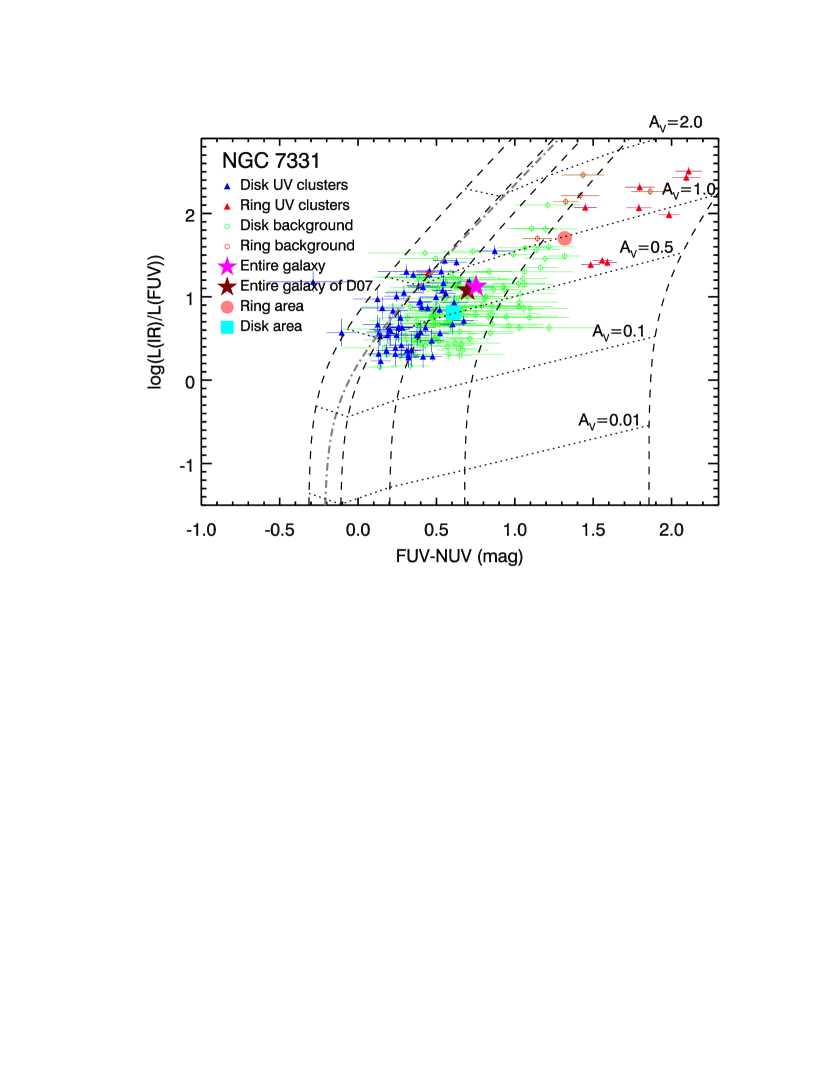
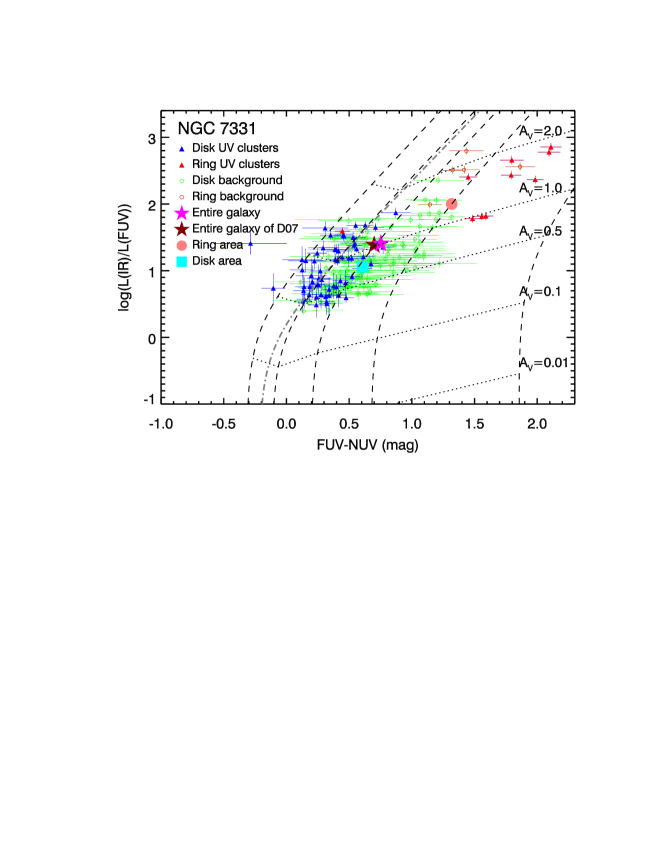
3.5. NGC 7331
In our sample, the galaxy NGC 7331 hosts a ring structure in the central area which consists of dust and gas. This striking morphological feature is obvious from the IR imaging observations (see the right panel of Figure 3 in this paper, or see Regan et al., 2004, for more panchromatic pictures). Stellar emission from the ring area is therefore heavily attenuated. Figure 8 shows the IRX-UV relation for NGC 7331, with the same curves as superimposed on the above diagrams. The data points of the ring regions in this plot are marked in red. One can clearly see a systematic offset between the disk UV clusters and the disk background regions. The disk background regions cover a redder space than the disk UV clusters of about 0.3 mag in . The two-parameter scenario of model provides a good characterization of this distribution: the two populations have comparable amounts of dust attenuation; the UV clusters lie in the age range 100 Myr, while the background regions have evolved into the older scale, with several regions at 300 Myr. Nevertheless, the same scenario gives an inexplicable description of the locations of ring regions. All the ring regions are located in the range of mag in the diagram. In particular the ring UV clusters lie in the extremely red range beyond to over 2.0 mag (this feature has also been found in Thilker et al., 2007). In the two-parameter scenario of model, the dust attenuation parameter is set into to fit most of the ring regions, which is in agreement with the high attenuation property of the ring area; but the age over 100 Myr suggested by the model grid in this figure is clearly inconsistent with the presence of strong H emission in the regions (as displayed in Regan et al., 2004; Thilker et al., 2007) which requires stellar population age in principle younger than approximately 5 Myr (O-type stars dominating environments). The error bars in this plot show that the photometric uncertainties of the ring clusters are comparable to the typical values of all the UV clusters (0.07 mag in and 0.08 in IRX), which indicates that the photometric uncertainties are not responsible for the deviation of the ring points, and their locations are supposed to be physical. Again, the scenario with stellar population age as the second parameter is confronted with a discrepancy in the characterization for the NGC 7331 dust ring.
In Figure 8, the point of the integrated galaxy is located at the position of = 0.75 0.06 mag and IRX = 1.12 0.05, and the integrated ring area populates at = 1.32 0.06 mag and IRX = 1.70 0.05. As can be seen from Table 4, the ring area accounts for 16% of FUV, 26% of NUV, and about 60% of the total IR luminosities of the integrated measurements of NGC 7331. The total UV clusters contribute less than 30% of the integrated luminosity of the galaxy at every photometric band. This quantification of fractional contributions offers a demonstration of the IRX-UV location of the integrated galaxy. The point is located at the average position of the disk regions on the axis but between the disk and ring regions on the IRX axis, due to the trivial UV contributions but strong IR emission from the ring area.
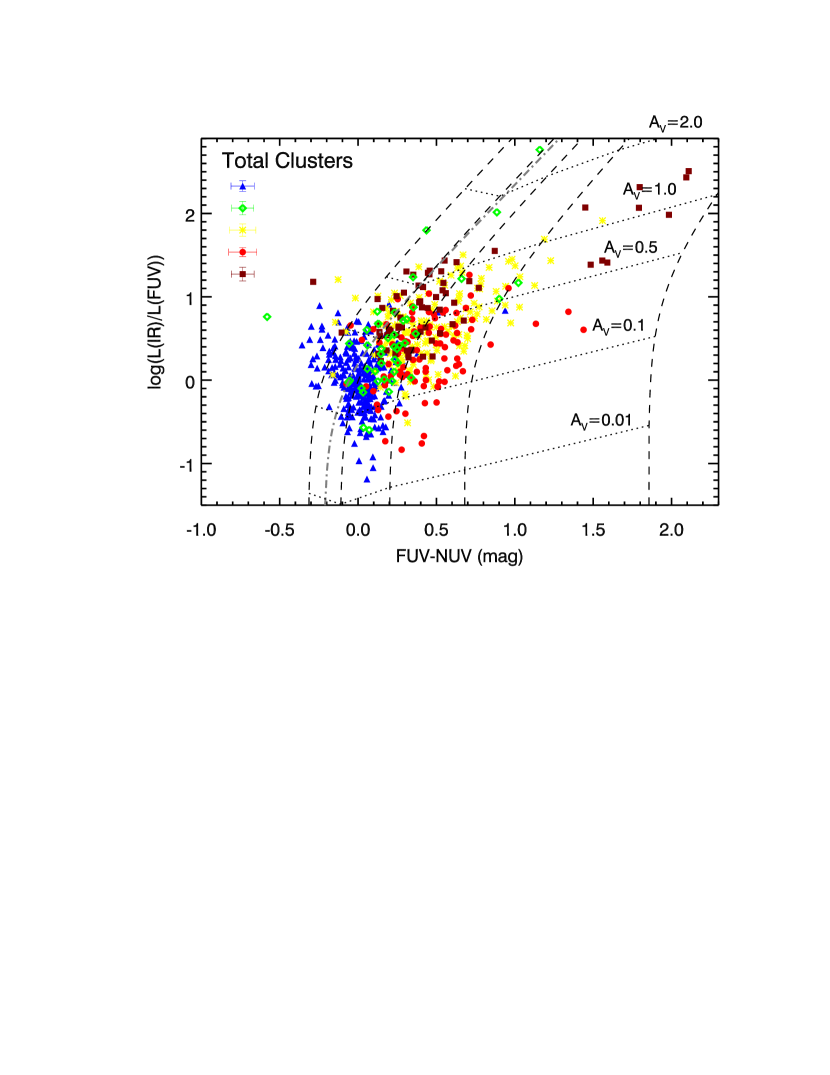
3.6. IRX-UV Relation for All The UV Clusters
In our work, we divide the aperture-extracted sources inside each galaxy into UV clusters and local background regions, for the purpose of separating the age parameter from the IRX-UV function. Although in many cases UV emitters are still likely to evolve to over 100 Myr, compared with the galactic background, the UV clusters are in a good position to represent young and relatively simpler populations in galaxies. In Figure 9, we plot IRX-UV relation for all the UV clusters inside the galaxies in our sample in order to examine the data distribution when the variation in the age parameter is constrained. However, we cannot see any uniform trend in the diagram. Instead, all the data points spread in a wide extent, and the composite distribution of all the UV clusters presents a scatter that is more vast than that for each individual galaxy. This figure highlights all the discrepancies between the data distributions and the scenario of model we have presented in the preceding paragraphs, and proposes a challenge to the second IRX-UV parameter. In agreement with other studies of normal star-forming galaxies (Johnson et al., 2007) or extragalactic star-forming regions (Boquien et al., 2009), there has not been any consistent trend at constant age ranges observed for different galaxies. In such cases, the age effect becomes weak, and it is necessary to suspect other causes of the scatter in the IRX-UV relation. In Section 6, we will present additional scenarios with more complicated SFHs than the instantaneous burst we have adopted, and discuss the possible contribution of variations in SFH to the scatter in the IRX-UV relation.
4. THE DEPENDANCE ON LUMINOSITY AND RADIAL DISTANCE
Statistic studies of galaxies have implied a luminosity trend in the IRX-UV distribution. They suggest that the sources with the lowest luminosity lie at the bottom of the relational locus and the bright objects tend to populate closer to the starburst empirical line (Gil de Paz et al., 2007). This finding brings forward a caveat that in the sampling process the preferential selection of bright sources has the potential to omit a certain section of low luminosities in the whole distribution of this relation. In addition, roughly declining radial profiles of IRX and have been found in galaxies (Boissier et al., 2007; Muñoz-Mateos et al., 2009). If a radial trend exists in galaxies, the IRX-UV locations for galactic subregions tend to be associated with their spatial positions in galaxies in spatially resolved studies.
In order to examine the effects of luminosity and radial distance, we plot the IRX-UV diagrams for the subregions within the galaxies in our sample, color-coded according to different luminosities and different radial distances respectively. The radial distance is defined as follows: for each galaxy, we employ four ellipses positioned at the galactic center to define five scales of galactocentric distance; ellipticity and position angle of the ellipses are equal to those of the isophote of 25 mag arcsec-2 in B band surface brightness () obtained from the NASA/IPAC Extragalactic Database; axis lengths of the ellipses are set into 1/6, 2/6, 3/6, and 4/6 of for the sake roughly equalizing the number of objects in each distance range. By this approach, we obtain five ranges of radial distance for the galactic subregions.
The resulting diagrams display a weak dependence on FUV luminosity or radial distance. The luminosity-dependent trend is contrary to the statistic studies, whereas the radial trend coincides with results from the previous work. In our sample, the trends are relatively obvious for NGC 3031 where there is a distinct separation between disk and bulge. We take this galaxy as an example to show the luminosity and radial distance trends in Figure 10.
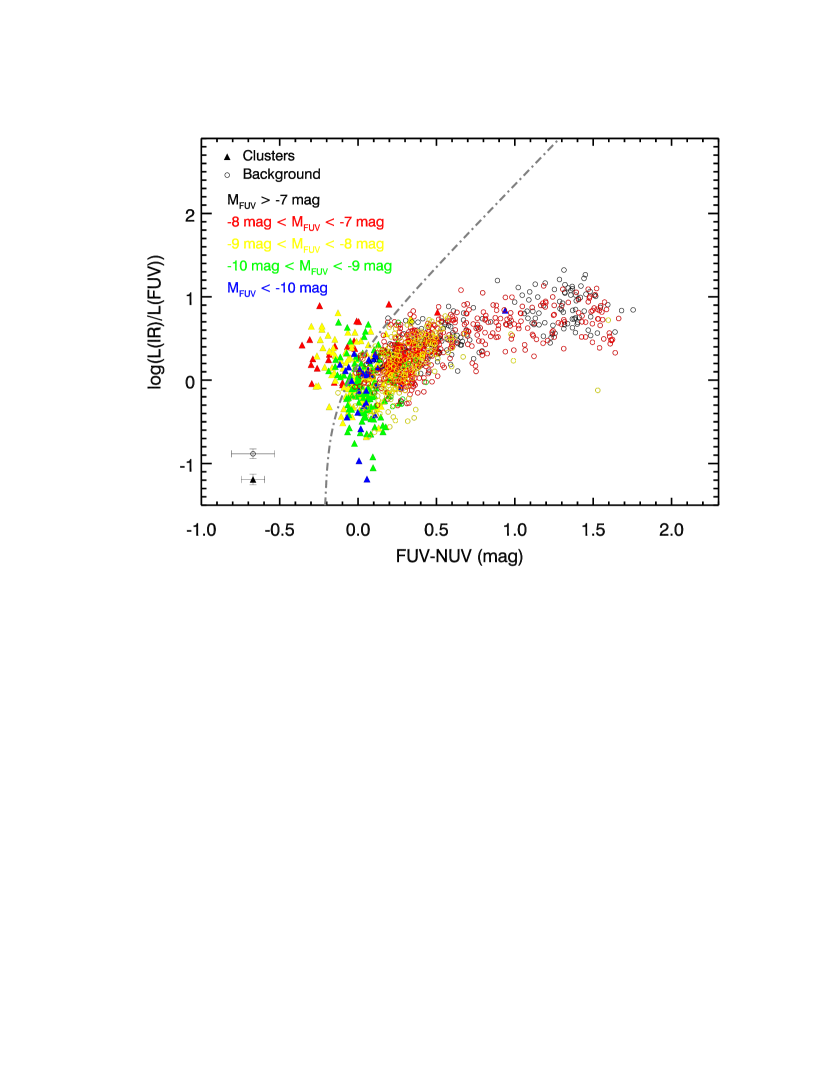
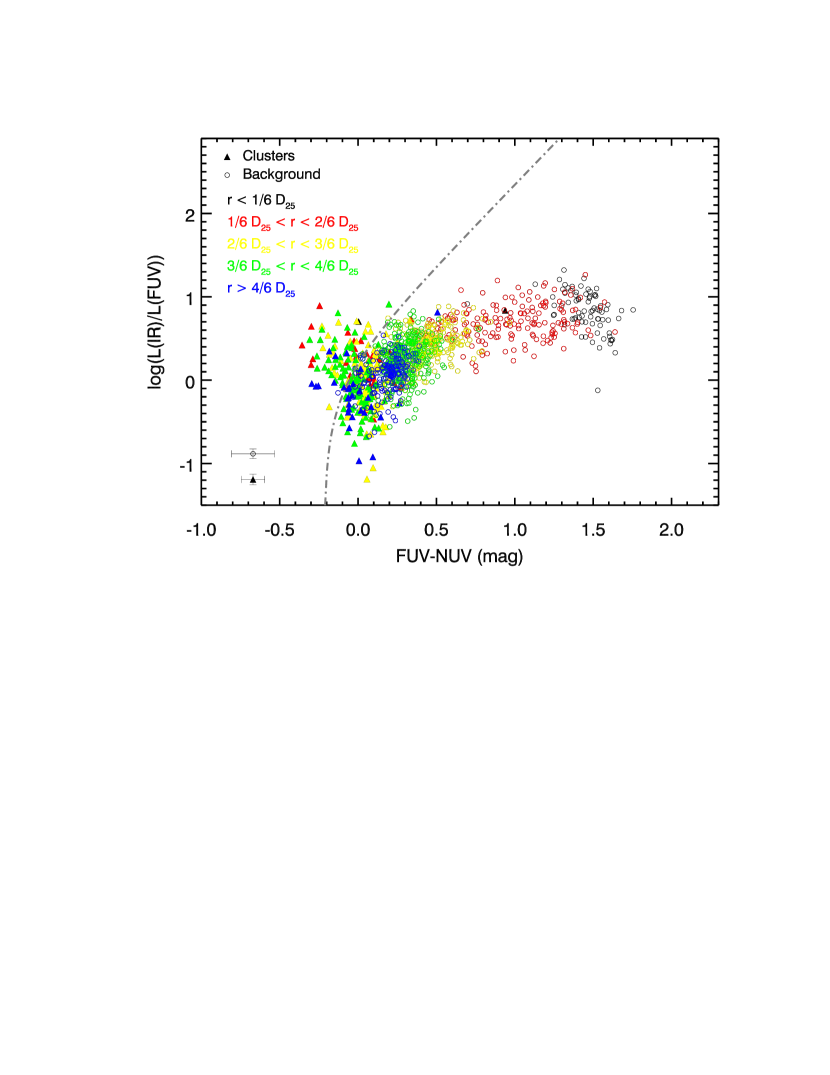
The left panel of the figure presents the luminosity trend in the IRX-UV relation. The regions with high FUV luminosity appear to have low IRXs and blue UV colors, and the low FUV objects are located in the range with relatively large values of IRX and . The inconsistency to the studies of integrated galaxies is due to different natures of the targets in the respective work. In the integrated results, most of the FUV-brighter objects close to the starburst empirical relation are starburst or star-forming galaxies, while dwarf and irregular galaxies with faint luminosities and low IRX make up the bottom part of the diagram due to their low mass and dust-poor state (Gil de Paz et al., 2007; Dale et al., 2009; Lee et al., 2009). In our work, the regions with low FUV luminosity are defined as dust-rich sources or evolved stellar populations with large infrared-to-ultraviolet ratios and red colors, and therefore located at the top part of the diagram; whereas the strong UV emission arises from dust-poor regions and young clusters which lead to the declining trends of the IRX and . The radial dependance of the IRX-UV relation is shown at the right panel of the figure. It is apparent that the both parameters in the relation decrease at larger radii, in accordance with the studies of galactic radial profiles (Boissier et al., 2007; Muñoz-Mateos et al., 2009). For NGC 3031, the apparent trend is better indicated by the disk-bulge separation: the central bulge contains the oldest populations in the galaxy with intrinsically low FUV luminosity and short radial distance.
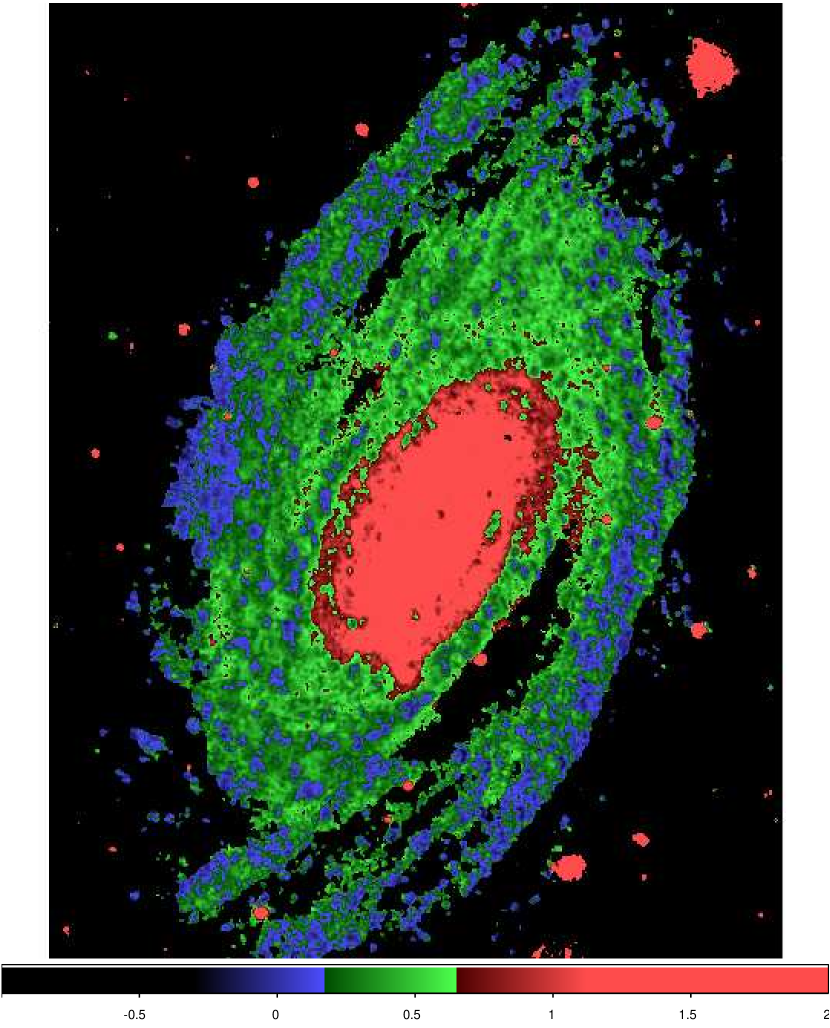
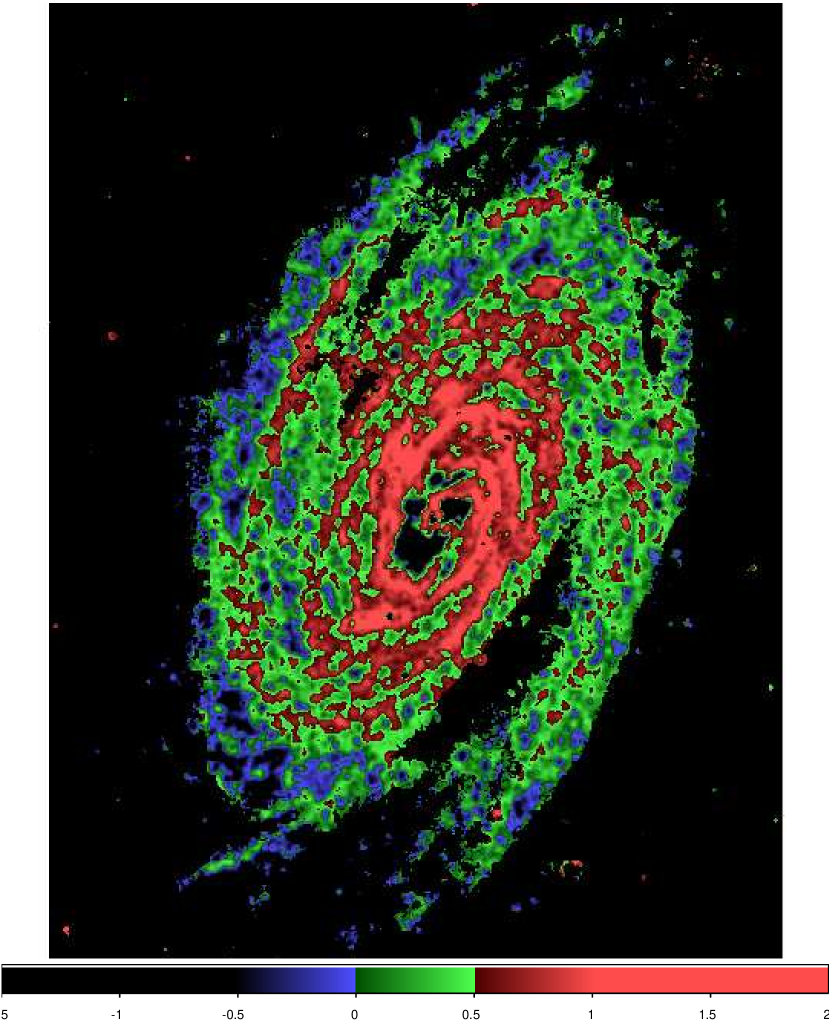
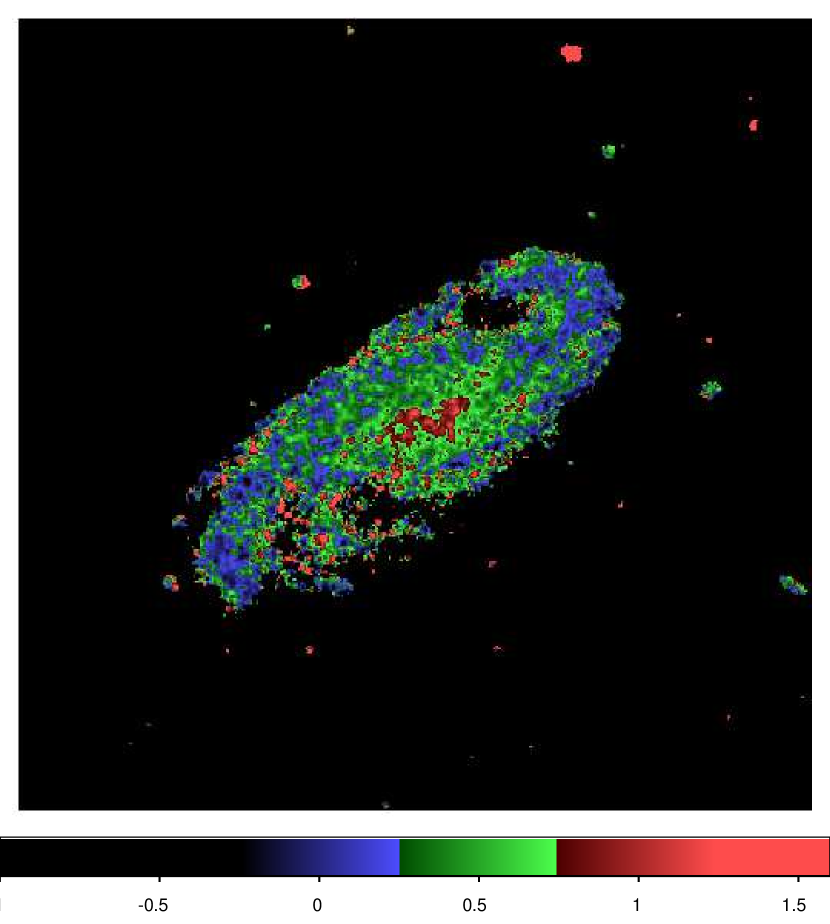
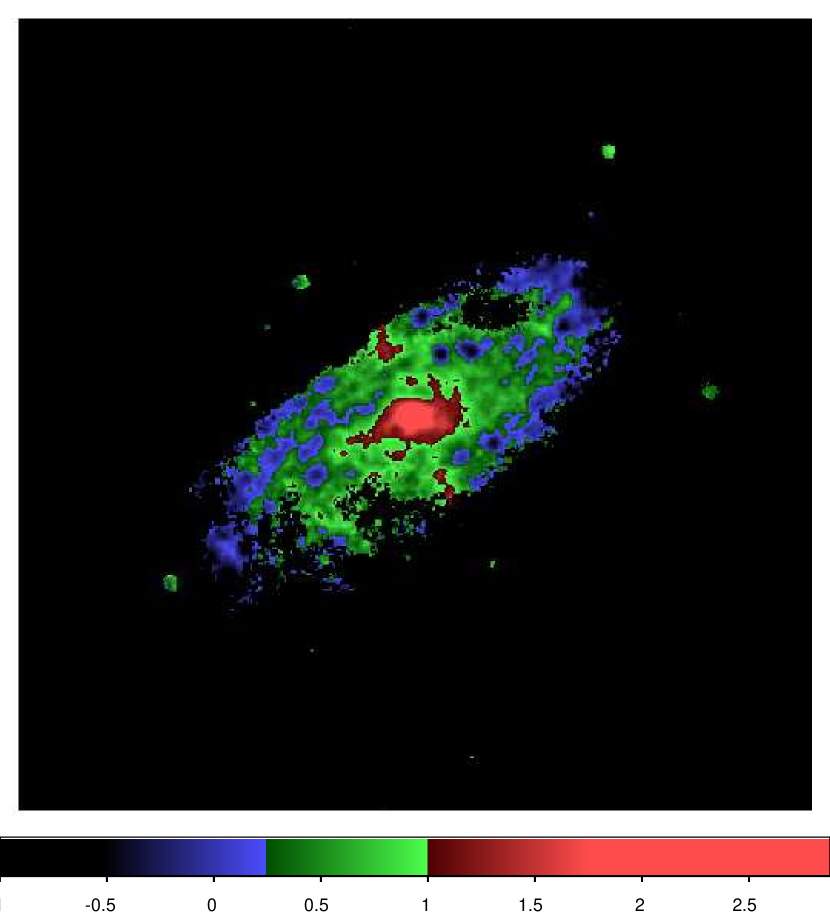
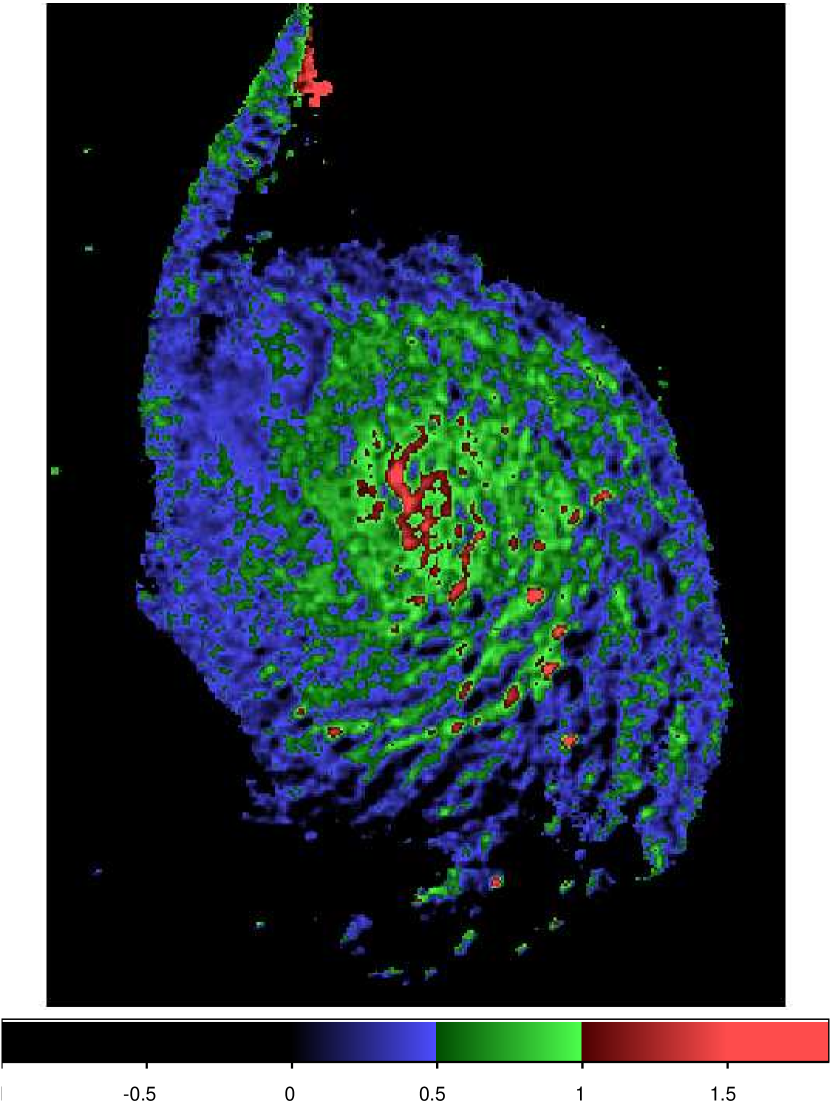
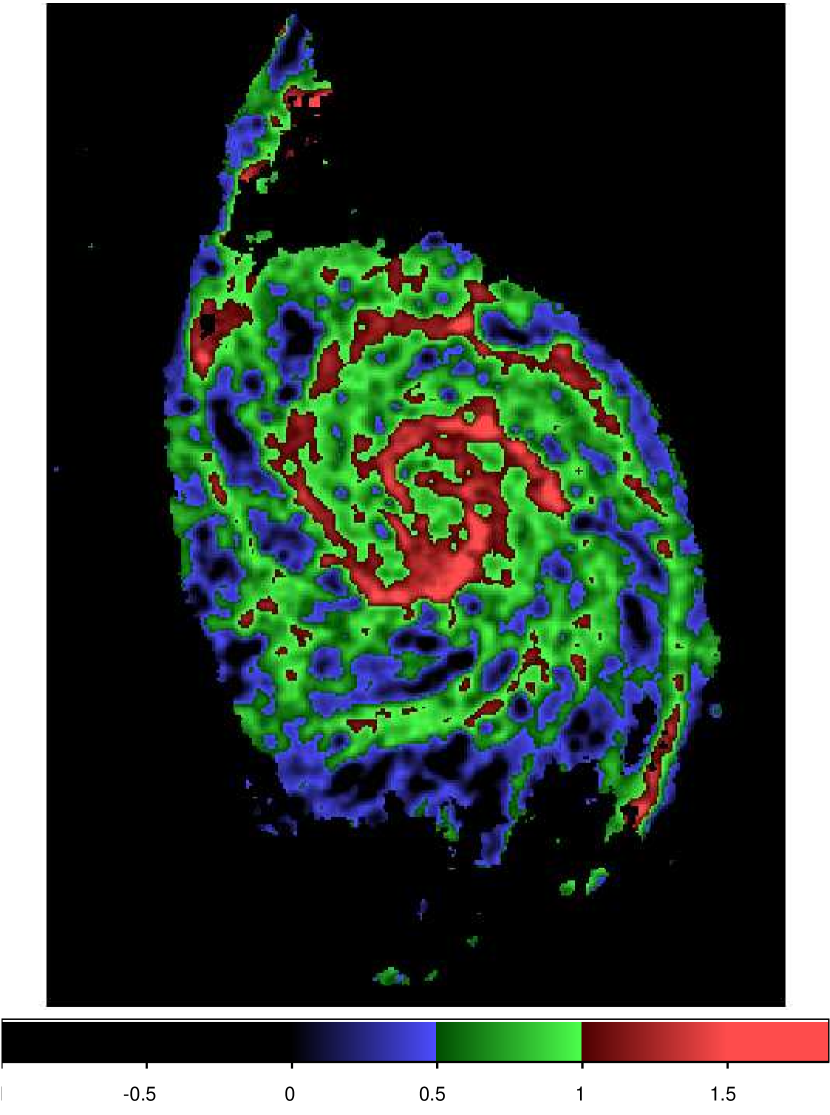
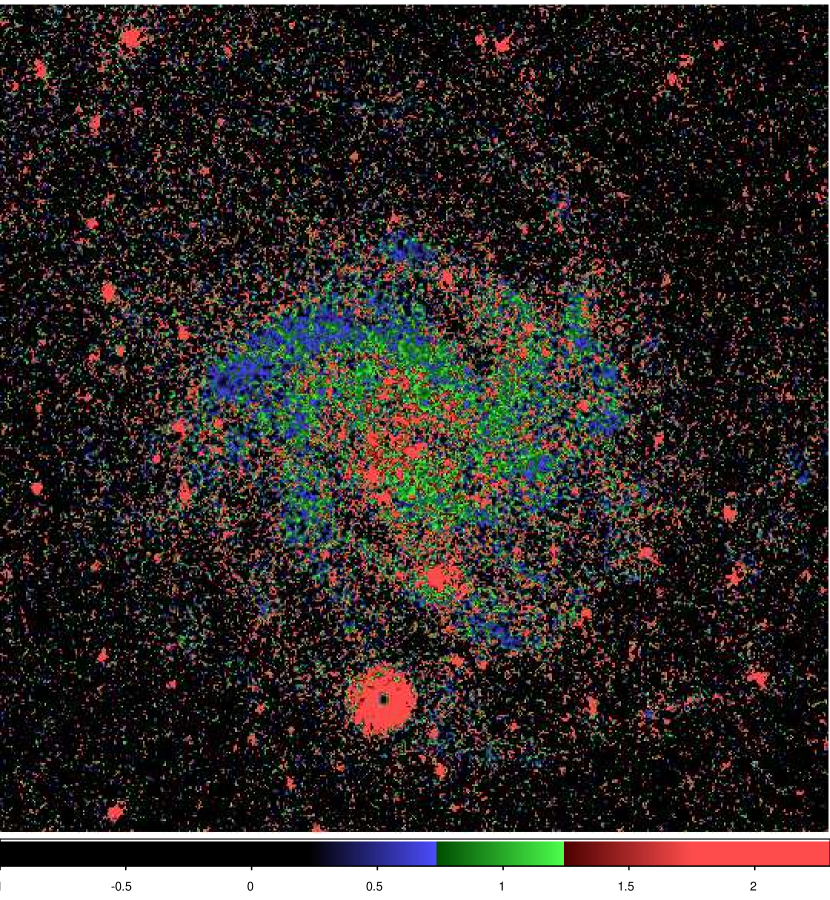
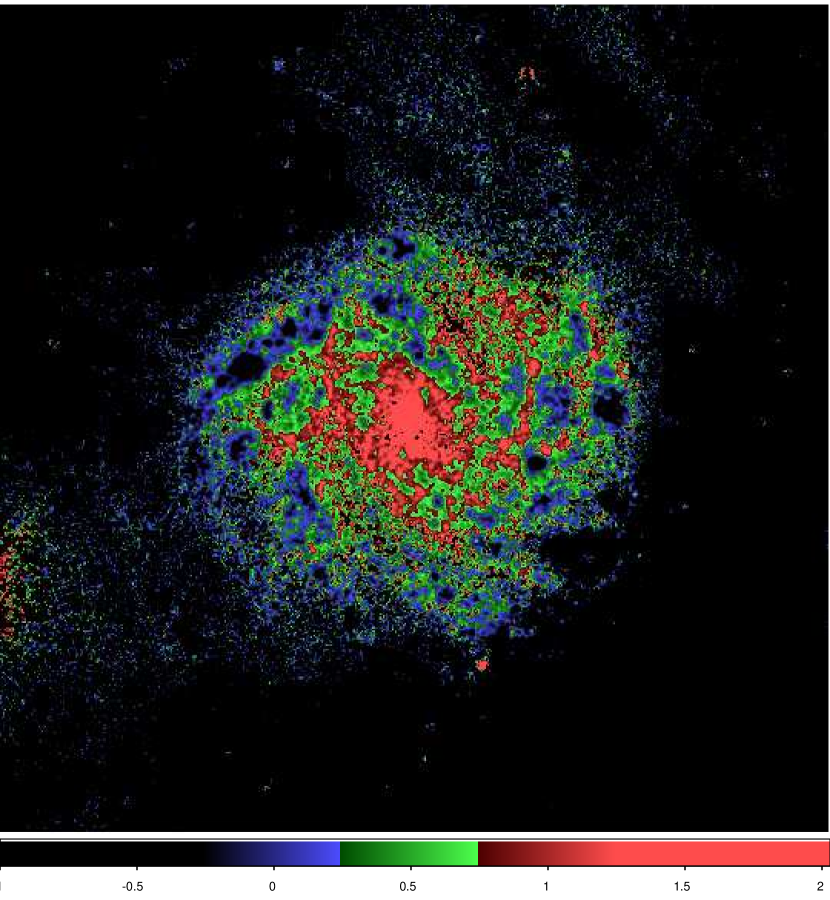
5. TWO-DIMENSIONAL MAPS OF FUV NUV AND IRX
In order to scan the spatial distributions of color and IRX with clear circumstance, we plot the two-dimensional maps of the two parameters for each galaxy in Figures 1115. In each figure, the highest values of the color is in the center, and at larger radii the value decreases finally falling to the minimum at the galactic edge. The IRX presents the similar descending gradient to the UV color but a differentiation in pattern. There is no obvious fluctuation of the along galactic radii, and the color change along the radius is quite smooth; whereas on the IRX maps we can clearly see spiral arm-like structures, and in addition, the inner parts of spiral arms seem to exhibit higher IRXs than the outer parts in some cases. This feature is more obvious in the face-on galaxies NGC 3031, NGC 5194, and NGC 6946. Although the edge-on galaxies fail to illuminate the same details, in our sample NGC 4536 still exhibits the central clump and NGC 7331 displays the ring structure in centers on their respective IRX maps. The diversity in the spatial distributions between UV color and IRX can be elucidated with the different natures between the two parameters. The infrared-to-ultraviolet ratio is in tight correlation to dust attenuation in general cases compared to the UV color, and thus the IRX maps are believed to take better pictures of dust attenuation distributions in galaxies. On the contrary, the UV color is sensitive to not only one single parameter, and the degeneracy of parameters in UV color is very likely to erase any character of single factor. The smooth gradients in the maps are a reflection of the compromise. The mismatch in spatial positions for the two parameters is the visual presentation of the scatter in the IRX-UV diagram.
6. DISCUSSION
The main goal of this work is to have a better understanding of the two parameters (dust attenuation and stellar population age) in the IRX-UV function. In Section 3, we present the spatially resolved results of the IRX-UV diagrams. We can see the age effects appearing as the displacements between the locations of the UV clusters and the local background regions inside galaxies in these diagrams, and the deviations of the age parameter in the interpretations of the IRX-UV distributions. The two-parameter scenario adopted for characterizing the observational data in Section 3 assumes simple stellar populations with an instantaneous burst. This assumption is an approximation of stellar populations contained in galactic subregions. As a matter of fact, although subregions inside galaxies are simpler in SFH than integrated galaxies, stellar populations still tend to be born beyond the instantaneous burst on a scale of several hundreds parsecs, which has the potential to oversimplify the stellar populations and introduce inaccuracies in the resulting descriptions of age for the measured regions. In this section, we will propose a series of composite stellar populations for the modeled scenarios, and discuss potential influences of the complexities in SFH on the IRX-UV properties.
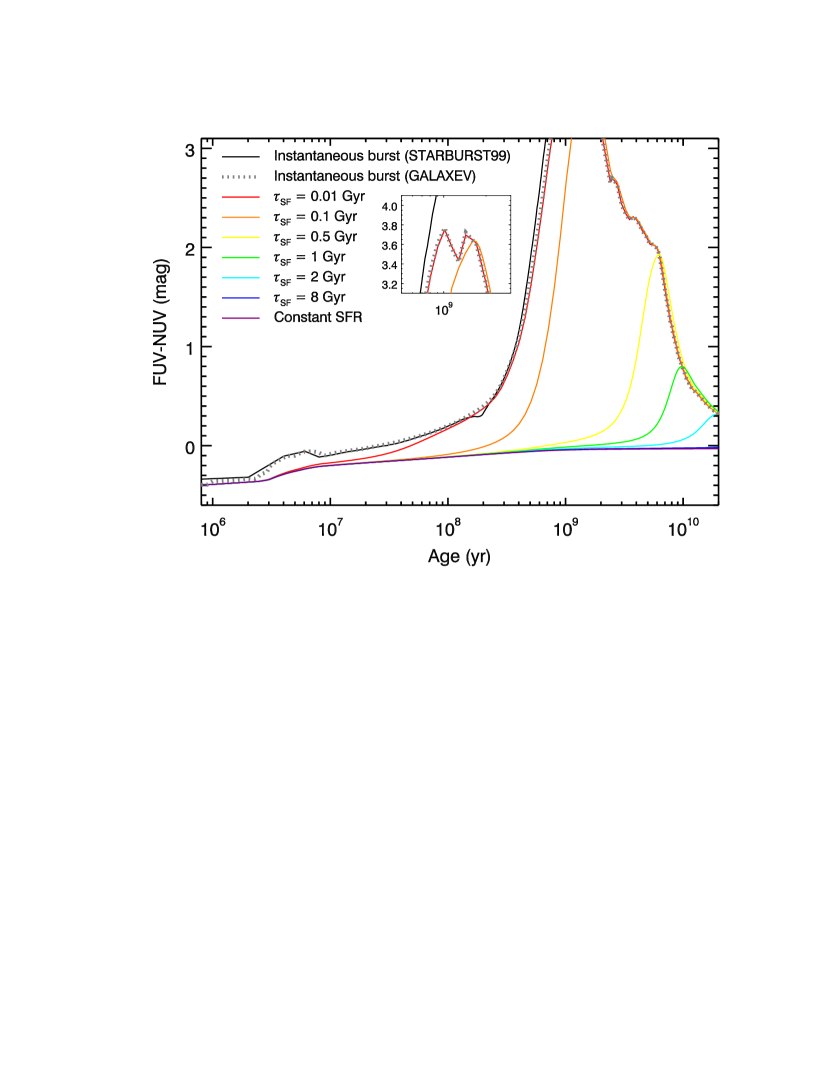
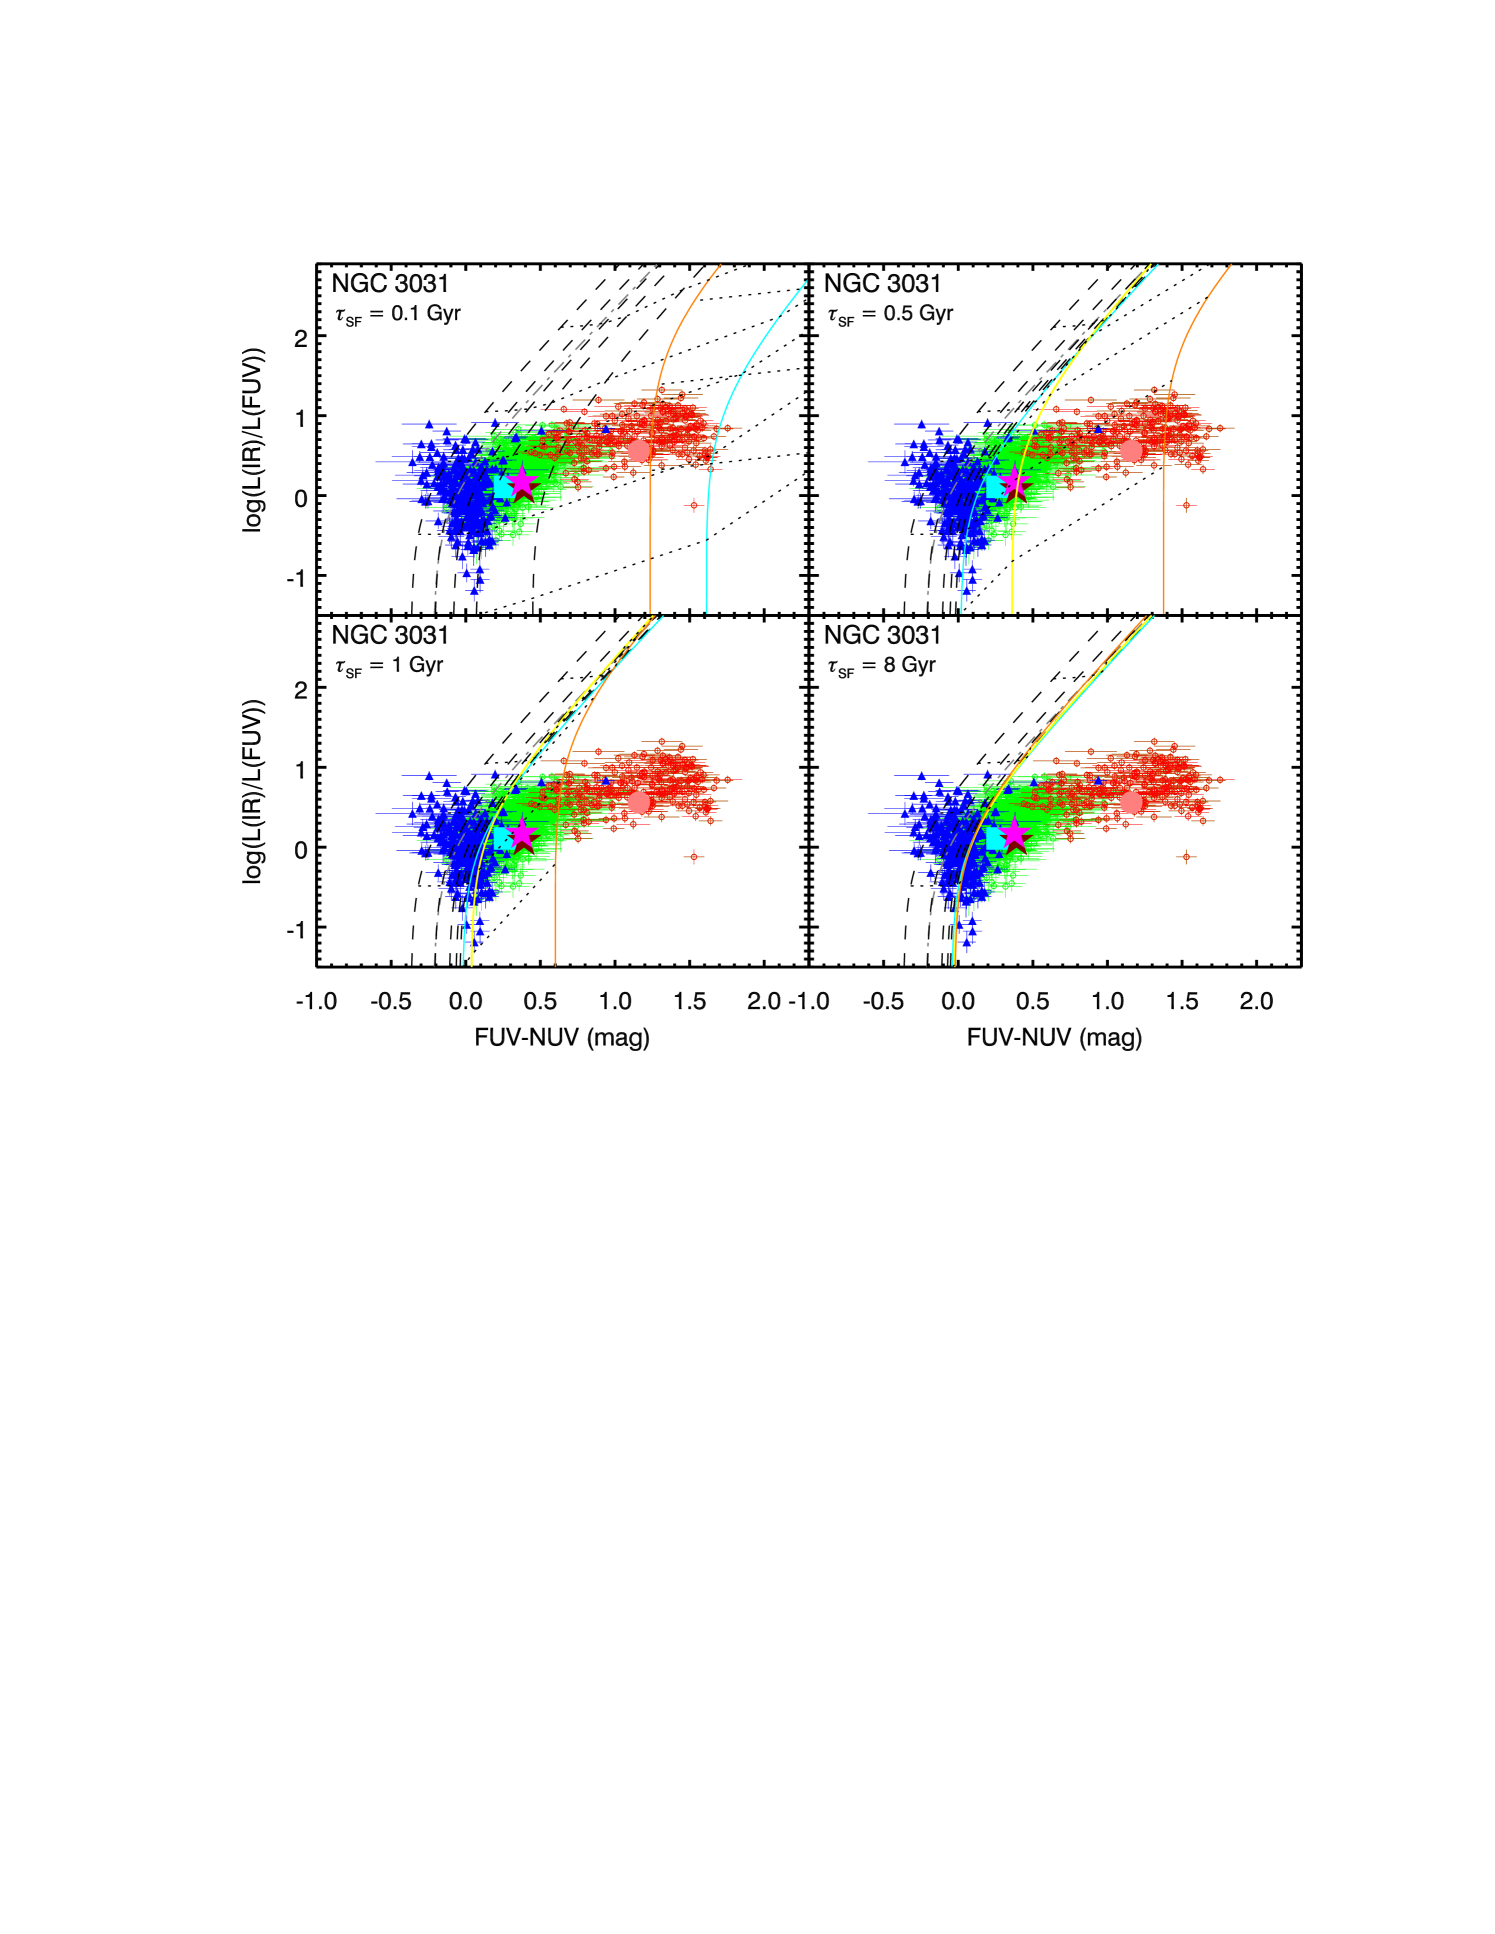
Spectra of the composite stellar populations are constructed via the GALAXEV library of evolutionary population synthesis (Bruzual & Charlot, 2003), on an assumption of exponentially decreasing SFR (, where is stellar population age and is constant of star formation timescale), with the Chabrier (2003) IMF 666The GALAXEV spectral library adopts the Chabrier IMF in stellar population synthesis, while the STARBURST99 spectral library offers the Kroupa IMF. Both IMFs are essentially identical for stellar mass . The difference between the two IMFs exists in descriptions of low-mass stars and brown dwarfs, and has no effective influence on UV stellar emission studied in this work. and solar metallicity (). Figure 16 shows intrinsic as a function of stellar population age in various SFH scenarios: simple stellar populations with an instantaneous burst, composite stellar populations with six types of exponential decreases in SFR ( = 0.01, 0.1, 0.5, 1, 2, and 8 Gyr), and constant SFR of 1 . We produce two scenarios of an instantaneous burst in this figure from STARBURST99 and GALAXEV respectively for the purpose of comparison between the two libraries. The exponentially decreasing and constant SFRs are derived from the GALAXEV library. As clearly illustrated in this figure, stellar populations born with an instantaneous burst present the most tremendous reddening of UV color with increasing age, in particular at age 200 Myr: extends from 0.3 to 3.0 mag within an age range of 200700 Myr. The reddening evolution of UV color tends to fade in the scenarios of composite stellar populations, and it is apparent to see at longer star formation time that appears to be more insensitive to age. The exponentially decreasing SFR with = 0.01 Gyr has a color evolution comparable to the instantaneous burst; at = 0.1 Gyr, the reddening of UV color becomes intensive after 500 Myr age; for longer star formation time, retains a constant value 0.0 mag until stellar populations evolve to 2 Gyr at = 0.5 Gyr, 5 Gyr at = 1 Gyr, and 10 Gyr at = 2 Gyr; stellar populations with = 8 Gyr and the constant SFR produce identical evolutionary tracks of UV color, where 0.0 mag during the lifetime up to 20 Gyr. Complex SFHs introduce the degeneracy of stellar population age and star formation timescale in : larger means more extended SFH and results in bluer color than smaller at constant age.
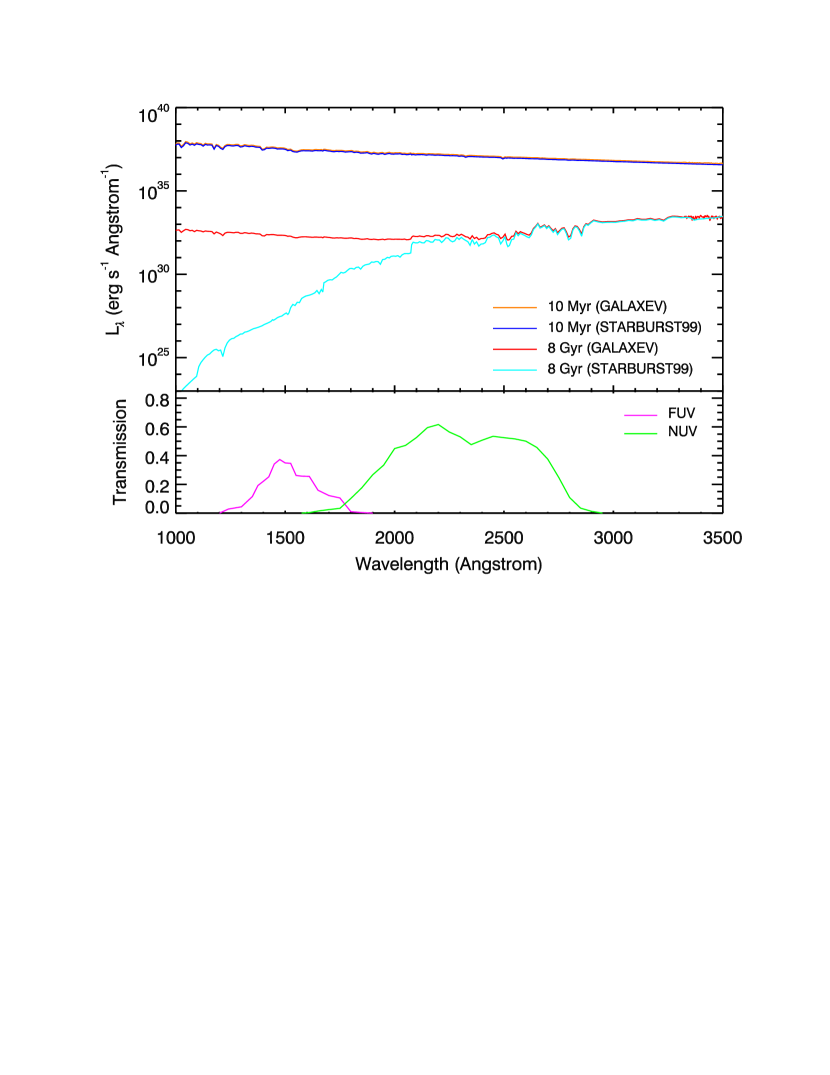
It is worth noting in Figure 16 that, there is a reversing point on each of the evolutionary tracks produced with the GALAXEV library except the SFHs of = 8 Gyr and the constant SFR, which suggests an upper limit for UV color at a certain age, and after this stage the color is supposed to experience a kind of blueing evolution. This feature is different from the STARBURST99 product where is on the monotonic increase during the whole lifetime of stellar populations, by comparison between the two models for the same instantaneous burst in this figure. It is also displayed that the reversing points on the GALAXEV tracks emerge in later periods and the upper limits appear at lower values if stellar populations evolve with larger . As shown in this figure, the SFHs of an instantaneous burst and Gyr yield the reddest colors over 3.6 mag during 12 Gyr; for = 2 Gyr, the maximum in drops to 0.3 mag, and the time falls to 20 Gyr; and between them, the reversing point for longer star formation time appears to locate on the track for lower , and after the reversing point the both SFHs tend to share a common evolutionary track. The presence of the blueing evolution is ascribed to the additional account of FUV emission from late-type post-asymptotic-giant-branch (post-AGB) stars in the GALAXEV library (Bruzual & Charlot, 2003). Figure 17 shows a comparison between UV spectral energy distributions (SEDs) derived respectively from the STARBURST99 and GALAXEV libraries for an instantaneous burst at two specific ages as an example to illustrate the difference in spectral shape. The contribution of the post-AGB stars manifests as the constant spectrum with an even rising trend shortwards from 2000 wavelength derived from the GALAXEV library for 8 Gyr age; whereas the STARBURST99 spectrum for this age presents a steep decline in the same wavelength range.
In Figure 18, we superimpose grids reproduced with composite stellar populations on the IRX-UV diagrams for NGC 3031 as plotted in Figure 4, and four types of exponential decreases in SFR ( = 0.1, 0.5, 1, and 8 Gyr) are shown respectively in each panel. The modeled curves with constant ages are displayed in parallel with each other in the figure, and with increasing ages the equivalent amounts of dust attenuation tend to stand at moderately higher levels of IRX. Compared with the SFH with an instantaneous burst, these curves for composite stellar populations are confined in narrower spaces, and the IRX-UV functions with different ages tend to approach each other with increasing . For instance, in the IRX-UV planes, an age interval between 2 and 500 Myr for Gyr introduces a difference of 0.7 mag in , while in the same age scale but for Gyr, the color differences diminish to less than 0.4 mag. In addition to the five certain ages addressed in Section 3 (Figures 49), we further sample three older ages in Figure 18: 800 Myr, 3 Gyr, and 8 Gyr. In the panel of Gyr, the curve with the age of 800 Myr lies in a range where mag;777In this panel, the curve with the age of 8 Gyr suffers from the color reversing as we have presented in the above paragraph, and due to this factor this curve appears on a bluer location than that of 800 Myr. while for Gyr, the same regimes in the IRX-UV diagrams belong to stellar populations evolving over 8 Gyr; when increases to 8 Gyr, ages ranging from 100 Myr to 8 Gyr are not distinguishable in the IRX-UV planes, and stellar populations in this timescale have intrinsic colors mag.
The model with composite stellar populations manifests substantial disparities in description of the same observational data with different SFH scenarios. In our work, the UV clusters inside the galaxies are measured with the subtraction of underlying diffuse emission (see Section 2.2), which enables the extraction stellar populations with an instantaneous burst or short star formation timescale, and Gyr is not considered to be appropriate for the UV clusters; by contrast, the local background populations are supposed to experience longer-term star formation in SFH. In this situation, we expect to adopt diverse SFH scenarios to characterize the two populations.
The IRX-UV diagram for NGC 3031 shows a clear separation between the UV clusters, the disk background regions, and the bulge background regions (Figure 4). As we have noted in Section 3.1, a considerable number of the disk background regions are categorized in the same age range for the UV clusters in the scenario of simple stellar populations, which is one of the discrepancies between the observational data and the model scenario in this paper. To address this problem, the model of composite stellar populations offers a suggestion from the viewpoint of SFH, where the local background regions are characterized as older stellar populations with increasing star formation timescales. In Figure 18, for instance, the scenario with Gyr offers a description of age 1 Gyr for the local background regions, while in the scenario with Gyr most of these regions correspond to stellar population age extending to 8 Gyr. Due to the variations in SFH, it is very likely for stellar populations with a large disparity in age to lie close to each other or even overlap in the IRX-UV diagram, and in this case, the appearance of the age parameter tends to be of less prominence in the IRX-UV function.
The separation between the UV clusters and the local background regions in the IRX-UV diagram is obviously displayed for NGC 4536 and NGC 7331 (aside from the ring area), visible but not very apparent to distinguish for NGC 6946, and completely absent for NGC 5194 (Figures 68). When the diversity of SFH is applied to these galaxies, the local background regions are expected to have longer star formation timescales than the UV clusters, and the factual difference in stellar population age between the two components inside each galaxy tends to exceed the interpretation of the offset in the IRX-UV diagram on assumption of one identical SFH. Combining the data points in Figures 68 and the modeled curves in Figure 18, we can see that, most of the local background regions are characterized to cover an age range of 18 Gyr with Gyr, and longer star formation timescales assign the same age range for bluer color spaces. In such cases, the UV clusters and the local background regions are able to possess the adjacent or even common regimes in at similar levels of IRX, in spite of possible disparities in stellar population age.
However, the variations in SFH still fail to provide any better solution to the other discrepancies in characterizing the IRX-UV relation for the galaxies with the scenario of simple stellar populations presented in Section 3. It is evident that, a few number of UV clusters inside NGC 3031 and several local background regions inside NGC 5194 which have bluer UV colors at fixed IRX than the prediction of the scenario with an instantaneous burst remain outside the coverage of the grid modeled with any other SFH, and a half of UV clusters inside NGC 5194 and ring clusters inside NGC 7331 which are estimated as several hundreds of megayears assuming an instantaneous burst possess even older regimes in age with increasing star formation timescales.
Figure 9 shows significant dispersion in the composite IRX-UV relation for a total number of the UV clusters, and the scenario with an instantaneous burst fails to provide an adequate interpretation of the data distribution. The variations in SFH are shown in Figure 18 to have an effective impact on the IRX-UV properties for stellar populations with age 100 Myr. For instance, between the SFHs with an instantaneous burst and the Gyr star formation, there is a scatter of 0.3 mag in at fixed IRX for the age of 100 Myr, and a scatter of 0.6 mag in for 300 Myr. Older ages and longer star formation timescales are not taken into consideration for the UV clusters. In this situation, although UV clusters are believed to contain much simpler stellar populations than galactic background, the limited variations in SFH are still likely to introduce a moderate level of dispersion in Figure 9, particularly in view of the different physical scales of the measured regions inside different galaxies (see Section 2.2).
The adoption of various SFHs complements the interpretation of the data distributions with the model assuming simple stellar populations. However, it remains deficient for the current scenarios to well characterize all the data. As a number of studies have suggested, various dust grain properties and diverse spatial geometries are suspected of causing discrepancies in the relationship between attenuation and observed color indices at certain wavebands, which thus leads to different IRX-UV trends (e.g., Witt & Gordon, 2000; Inoue et al., 2006). In Paper II, we will investigate the dependence of the IRX-UV relation on attenuation/extinction law and attempt to discover more parameters in the IRX-UV function, specifically in order to obtain solutions from an alternative viewpoint to the discrepancies between the observational data and the current scenarios.
Statistical studies of integrated galaxies have shown large dispersion in the IRX-UV relation (e.g., Buat et al., 2005; Dale et al., 2007, 2009; Gil de Paz et al., 2007). Although stellar population age has been widely considered as the second parameter for introducing the deviation, until now there has not been sufficient evidence to confirm the age effect on the IRX-UV relation for integrated galaxies (Seibert et al., 2005; Johnson et al., 2007). In this paper, the comparisons between the spatially resolved measurements and the integrated properties of galaxies provide implications about the conundrum in integrated studies of galaxies. The locations of integrated galaxies and galactic subregions in the IRX-UV diagrams (Figures 48) and the fractional contributions of component to integrated luminosities of galaxies (Table 4) indicate that, any single component lacks the ability to dominate the integrated luminosities of galaxies, and integrated measurements of normal galaxies are aggregations of various populations and different components within galaxies. As also implied in Boquien et al. (2012), simple age tracers are not in a good position to estimate stellar population age in such a case. If galaxies exhibit prominent features in sub-structures at certain observational bands, the integrated measurements can have an effective impact. In most cases of integrated measurements which compromise different stellar populations in galaxies and consequently represent more complexities in SFH, contrary to spatially resolved studies, any significant variation in the IRX-UV trend as a function of stellar population age tends to become unclear and probably masked by other potential factors. Moreover, even though in the simple situation any other parameter is negligible, the effects of stellar population age are suggested to be more complicated than we have realized in the IRX-UV plane (Cortese et al., 2008).
7. SUMMARY
In this work, we perform a spatially resolved analysis of five spiral galaxies selected from the SINGS sample, aimed at investigating the impacts of dust attenuation and stellar population age on the IRX-UV relation, and thereby to provide better insights into the influences of dust and stellar population properties on UV and IR observations of galaxies.
Aperture photometry is extracted for all positions within the galaxies. We divide the measured regions into UV clusters and local background regions. For NGC 3031 we further divide the local background regions into disk regions and bulge regions, and for NGC 7331 we mark the regions in the ring area, in order to illuminate their special properties. The classification of different populations can help to distinguish the signature of stellar population age in the IRX-UV function. We also measure the integrated luminosities of the entire galaxies and the galactic center areas in order to compare the integrated and spatially resolved properties of galaxies.
One of our main results is the separation of the effects of age and dust attenuation on the IRX-UV relation which failed to be revealed by studies of integrated galaxies (e.g., Seibert et al., 2005; Johnson et al., 2007). The age signature is indicated by systematic offsets of the local background regions towards redder color ranges from the UV clusters in the IRX-UV diagrams due to the intrinsic redder UV colors for evolved stellar populations. This kind of displacement is clearly seen in NGC 3031, NGC 4536, and NGC 7331; distinguishable but less prominent in NGC 6946; and completely invisible in NGC 5194. When we attempt to constrain variations in the age parameter by plotting all the UV clusters in one diagram, the composite relation doesn’t display a common trend, and instead presents a considerable degree of scatter. Variations in SFH are suggested as a potential cause of weakening the age effects on the IRX-UV relation, and we therefore interpret the different levels of overlapping between the UV clusters and the local background regions, as well as a few portions of the dispersion in the composite relation for all the UV clusters. However, definite discrepancies still appear in the descriptions of the data loci for NGC 3031, NGC 5194, NGC 7331, and the total number of UV clusters by the scenarios assuming any of the SFHs. These difficulties indicate the necessity of other parameters such as attenuation/extinction law in operation of the IRX-UV function. The coincident requirement was suggested in Boquien et al. (2009, 2012). With this in consideration, further examinations involving attenuation/extinction law will be under taken in Paper II.
Through the investigations into the integrated properties of galaxies and the fractional contributions of different components to the integrated measurements, we find that the UV clusters account for of the overall luminosities of galaxies, and the integrated characters are represented by the local background in most cases. If galaxies perform prominent features in substructures, the organizational regime will be reformed, and integrated measurements of galaxies tend to be biased by the substructures in this case: in our sample the star-forming center in NGC 4536 and the dust ring in NGC 7331 play dominant roles in the integrated measurements of their host galaxies. The subregions in NGC 6946 present a vast scatter in the IRX-UV diagram, and consequently, the location of the integrated galaxy has the largest deviation from the starburst empirical curve in our sample.
In addition, the IRX-UV relation depends weakly on luminosity showing that either color or IRX is inversely related to FUV luminosity, differing from the results from the statistical studies of integrated galaxies, which is due to the different natures of the sources sampled between the two kinds of studies. The radial trends for color and IRX present declining gradients from the center to the edge in galaxies. From the two-dimensional maps, the different spatial distributions between the two parameters can be further seen: the color descends with increasing galactic radii more symmetrically and smoothly, whereas the IRX exhibits several sorts of substructures such as spiral arms and clumps. This discrimination provides a spatial mirror of the dispersion in the IRX-UV relation.
References
- Bell (2002) Bell, E. F. 2002, ApJ, 577, 150
- Bertin & Arnouts (1996) Bertin, E., & Arnouts, S. 1996, A&AS, 117, 393
- Bianchi et al. (2003) Bianchi, L., Madore, B., Thilker, D., et al. 2003, The Local Group as an Astrophysical Laboratory, ed. M. Livio & T. M. Brown, 10
- Boissier et al. (2007) Boissier, S., Gil de Paz, A., Boselli, A., et al. 2007, ApJS, 173, 524
- Boquien et al. (2012) Boquien, M., Buat, V., Boselli, A., et al. 2012, A&A, 539, A145
- Boquien et al. (2009) Boquien, M., Calzetti, D., Kennicutt, R., et al. 2009, ApJ, 706, 553
- Bouwens et al. (2009) Bouwens, R. J., Illingworth, G. D., Franx, M., et al. 2009, ApJ, 705, 936
- Bruzual & Charlot (2003) Bruzual, G., & Charlot, S. 2003, MNRAS, 344, 1000
- Buat (1992) Buat, V. 1992, A&A, 264, 444
- Buat et al. (2005) Buat, V., Iglesias-Pramo, J., Seibert, M., et al. 2005, ApJ, 619, L51
- Buat & Xu (1996) Buat, V., & Xu, C. 1996, A&A, 306, 61
- Burgarella et al. (2005) Burgarella, D., Buat, V., & Iglesias-Páramo, J. 2005, MNRAS, 360, 1413
- Calzetti (1997) Calzetti, D. 1997, AJ, 113, 162
- Calzetti et al. (2000) Calzetti, D., Armus, L., Bohlin, R. C., et al. 2000, ApJ, 533, 682
- Calzetti et al. (2005) Calzetti, D., Kennicutt, R. C., Jr., Bianchi, L., et al. 2005, ApJ, 633, 871
- Calzetti et al. (1994) Calzetti, D., Kinney, A. L., & Storchi-Bergmann, T. 1994, ApJ, 429, 582
- Cardelli et al. (1989) Cardelli, J. A., Clayton, G. C., & Mathis, J. S. 1989, ApJ, 345, 245
- Chabrier (2003) Chabrier, G. 2003, PASP, 115, 763
- Cortese et al. (2006) Cortese, L., Boselli, A., Buat, V., et al. 2006, ApJ, 637, 242
- Cortese et al. (2008) Cortese, L., Boselli, A., Franzetti, P., et al. 2008, MNRAS, 386, 1157
- Daddi et al. (2004) Daddi, E., Cimatti, A., Renzini, A., et al. 2004, ApJ, 617, 746
- Daddi et al. (2007) Daddi, E., Dickinson, M., Morrison, G., et al. 2007, ApJ, 670, 156
- Dale et al. (2009) Dale, D. A., Cohen, S. A., Johnson, L. C., et al. 2009, ApJ, 703, 517
- Dale et al. (2007) Dale, D. A., Gil de Paz, A., Gordon, K. D., et al. 2007, ApJ, 655, 863
- Dale & Helou (2002) Dale, D. A., & Helou, G. 2002, ApJ, 576, 159
- Devereux et al. (1995) Devereux, N. A., Jacoby, G., & Ciardullo, R. 1995, AJ, 110, 1115
- Engelbracht et al. (2007) Engelbracht, C. W., Blaylock, M., Su, K. Y. L., et al. 2007, PASP, 119, 994
- Fazio et al. (2004) Fazio, G. G., Hora, J. L., Allen, L. E., et al. 2004, ApJS, 154, 10
- Gil de Paz et al. (2007) Gil de Paz, A., Boissier, S., Madore, B. F., et al. 2007, ApJS, 173, 185
- Goldader et al. (2002) Goldader, J. D., Meurer, G., Heckman, T. M., et al. 2002, ApJ, 568, 651
- Gordon et al. (2004) Gordon, K. D., Prez-Gonzlez, P. G., Misselt, K. A., et al. 2004, ApJS, 154, 215
- Hao et al. (2011) Hao, C.-N., Kennicutt, R. C., Johnson, B. D., et al. 2011, ApJ, 741, 124
- Howell et al. (2010) Howell, J. H., Armus, L., Mazzarella, J. M., et al. 2010, ApJ, 715, 572
- Inoue et al. (2006) Inoue, A. K., Buat, V., Burgarella, D., et al. 2006, MNRAS, 370, 380
- Jogee et al. (2005) Jogee, S., Scoville, N., & Kenney, J. D. P. 2005, ApJ, 630, 837
- Johnson et al. (2007) Johnson, B. D., Schiminovich, D., Seibert, M., et al. 2007, ApJS, 173, 392
- Kennicutt et al. (2003) Kennicutt, R. C., Jr., Armus, L., Bendo, G., et al. 2003, PASP, 115, 928
- Kennicutt et al. (2011) Kennicutt, R. C., Calzetti, D., Aniano, G., et al. 2011, PASP, 123, 1347
- Kennicutt et al. (2009) Kennicutt, R. C., Hao, C.-N., Calzetti, D., et al. 2009, ApJ, 703, 1672
- Kong (2004) Kong, X. 2004, A&A, 425, 417
- Kong et al. (2004) Kong, X., Charlot, S., Brinchmann, J., & Fall, S. M. 2004, MNRAS, 349, 769
- Kong et al. (2006) Kong, X., Daddi, E., Arimoto, N., et al. 2006, ApJ, 638, 72
- Kong et al. (2000) Kong, X., Zhou, X., Chen, J., et al. 2000, AJ, 119, 2745
- Kroupa (2002) Kroupa, P. 2002, Science, 295, 82
- Lee et al. (2009) Lee, J. C., Gil de Paz, A., Tremonti, C., et al. 2009, ApJ, 706, 599
- Leitherer & Heckman (1995) Leitherer, C., & Heckman, T. M. 1995, ApJS, 96, 9
- Leitherer et al. (1999) Leitherer, C., Schaerer, D., Goldader, J. D., et al. 1999, ApJS, 123, 3
- Martin et al. (2005) Martin, D. C., Fanson, J., Schiminovich, D., et al. 2005, ApJ, 619, L1
- Martin et al. (2007) Martin, D. C., Small, T., Schiminovich, D., et al. 2007, ApJS, 173, 415
- Meurer et al. (1999) Meurer, G. R., Heckman, T. M., & Calzetti, D. 1999, ApJ, 521, 64
- Mezger et al. (1974) Mezger, P. G., Smith, L. F., & Churchwell, E. 1974, A&A, 32, 269
- Morrissey et al. (2007) Morrissey, P., Conrow, T., Barlow, T. A., et al. 2007, ApJS, 173, 682
- Muñoz-Mateos et al. (2009) Muñoz-Mateos, J. C., Gil de Paz, A., Boissier, S., et al. 2009, ApJ, 701, 1965
- Panuzzo et al. (2007) Panuzzo, P., Granato, G. L., Buat, V., et al. 2007, MNRAS, 375, 640
- Pérez-González et al. (2006) Pérez-González, P. G., Kennicutt, R. C., Jr., Gordon, K. D., et al. 2006, ApJ, 648, 987
- Pilbratt et al. (2010) Pilbratt, G. L., Riedinger, J. R., Passvogel, T., et al. 2010, A&A, 518, L1
- Regan et al. (2004) Regan, M. W., Thornley, M. D., Bendo, G. J., et al. 2004, ApJS, 154, 204
- Rieke et al. (2004) Rieke, G. H., Young, E. T., Engelbracht, C. W., et al. 2004, ApJS, 154, 25
- Schlegel et al. (1998) Schlegel, D. J., Finkbeiner, D. P., & Davis, M. 1998, ApJ, 500, 525
- Seibert et al. (2005) Seibert, M., Martin, D. C., Heckman, T. M., et al. 2005, ApJ, 619, L55
- Thilker et al. (2007) Thilker, D. A., Boissier, S., Bianchi, L., et al. 2007, ApJS, 173, 572
- Vázquez & Leitherer (2005) Vázquez, G. A., & Leitherer, C. 2005, ApJ, 621, 695
- Werner et al. (2004) Werner, M. W., Roellig, T. L., Low, F. J., et al. 2004, ApJS, 154, 1
- Witt & Gordon (2000) Witt, A. N., & Gordon, K. D. 2000, ApJ, 528, 799
- Xu & Buat (1995) Xu, C., & Buat, V. 1995, A&A, 293, L65
Appendix A ESTIMATION OF TOTAL IR LUMINOSITY
In this work, the observed total IR luminosity L(IR) is estimated from 8 and 24 m luminosities via C05 calibration (Equation (1) in this paper), since the poor resolution of Spitzer MIPS 70 and 160 m observations hinders us from applying longer wavelength imaging. C05 calibration takes the estimation of IR luminosity from 24, 70, and 160 m luminosities in Dale & Helou (2002, Equation (4) therein. Hereafter denoted as DH02) as the reference of L(IR). The sample used in C05 calibration is star-forming regions in NGC 5194, and for these regions a predominant fraction of the total IR luminosity originates from short wavelength components of IR continua. In this situation, C05 calibration is suitable for young stellar populations such as the UV clusters in our work. For more evolved populations such as the local background regions or integrated galaxies, it is not clear whether or not the same prescription can still provide appropriate estimations. In consideration of this question, here we compare total IR luminosities derived from C05 and DH02 methods, and examine the usability of C05 calibration in more general cases.
In Figure 1, we plot the IRX-UV diagram for the D07 integrated measurements of the SINGS galaxies, where the total IR luminosity is calculated by employing C05 calibration (8 and 24 m). For the purpose of comparison, here we plot the same diagram in Figure 19 but estimate L(IR) by adopting DH02 prescription (24, 70, and 160 m). The data loci in the both diagrams hold a consistent degree of scatter, but in Figure 19 the data points lie at a higher level in the diagram and populate closer to the starburst empirical line. In Figure 20, we further compare C05- and DH02-calibrated total IR luminosities, L(IR)C05 (8-24 m calibration) and L(IR)DH02 (24-70-160 m calibration), for the same sample. The left panel of Figure 20 shows as a function of . For all data points, DH02 estimation yields larger L(IR) than C05 prescription, with margins of 0.20.5 dex for most galaxies. At the same time, this diagram shows an obvious trend that, when L(24 m) accounts for a tiny minority of L(IR), there is a vast offset between L(IR)C05 and L(IR)DH02, even as much as 1.0 dex; but if the contribution of L(24 m) to L(IR) increases, the offset tends to become of less significance, and L(IR)C05 is therefore comparable to L(IR)DH02. The offset in IRX introduced by the different IR calibrations is apparently shown in the right panel of Figure 20. The C05-based IRXs appear to be lower by a typical value of 0.4 than DH02 products.
The analysis of IR estimation implies that, the total IR luminosities derived via C05 calibration in this paper are likely to be underestimated, particularly for the local background regions and the integrated galaxies. Figure 21 shows the correlation between vs. for the SINGS galaxies with the D07 measurements, which offers a rough recipe to estimate L(IR)DH02 from L(IR)C05 and L(24 m) and therefore to compensate the possible bias in L(IR)C05. The best-fitting curve for the data points in this figure provides the equation:
| (A1) |
We adopt this equation to re-estimate the total IR luminosities for the galaxies in our sample, and the resulting IRX-UV diagrams are displayed in Figures 2227. The new version of the IRX-UV relations presents shapes of loci generally consistent with those in Figures 49, but the data points systematically shift to higher IRX levels by an average factor of 0.4. The change in total IR luminosity has no impact on the age signature, and the offset between the UV clusters and the local background regions remains to be seen for NGC 3031, NGC 4536, NGC 6946, and NGC 7331, with different levels of overlapping. The discrepancies existing in the distributions for NGC 3031, NGC 5194, and NGC 7331 are still unsolved in the updated diagrams, and the significant dispersion remains in the composite relation for the total UV clusters.
Equation (A1) serves as an approximate modification of C05 calibration applied to evolved stellar populations. The direct purpose of introducing this correction is to examine the potential deviation in the IR estimation in this paper. It is necessary to emphasize that, the conversion between L(IR)DH02 and L(IR)C05 is questionable in more general cases. For young stellar populations such as extragalactic star-forming regions, C05 calibration is still supposed to be an optimal approach to assessing total IR luminosity when only 8 and 24 m data are available.
The difference between the results from DH02 and C05 calibrations arises primarily from different dust temperatures triggered by young and evolved stellar populations. As an example, for NGC 3031 the dust heated by diffuse emission of evolved stellar populations has the temperature of about 19 K and the corresponding IR continuum peaks at around 160 m, whereas young ionizing sources trigger the dust temperature over 100 K with the consequent IR luminosity peaking at around 24 m (Pérez-González et al., 2006); the average dust temperature for the integrated NGC 3031 is about 30 K and the IR continuum peaks at around 100 m (Devereux et al., 1995). Therefore, for galactic background or integrated galaxies where evolved populations dominate stellar contents, the cold dust contributes IR emission, and in this case the estimation of IR luminosity from short waveband monochromatic fluxes calibrated on a basis of warm-dust-dominating sources fails to reach the longer wavelength component of IR continuum and introduces the underestimate of IR luminosity. The left panel of Figure 20 suggests a trend that, when warmer dust contributes IR emission which is reflected by the increasing proportion of 24 m to total IR luminosity, the two estimators tend to match with each other; By contrast, the contribution of colder dust would augment the deviation. The advent of the Herschel observations with high resolution at FIR wavebands will provide perceptive insight into cold dust in galaxies and is expected to fill the gap in longer wavelength components of galactic IR emission (Kennicutt et al., 2011).