Incoherent topological defect recombination dynamics in TbTe3
Abstract
We study the incoherent recombination of topological defects created during a rapid quench of a charge-density-wave system through the electronic ordering transition. Using a specially devised 3-pulse femtosecond optical spectroscopy technique we follow the evolution of the order parameter over a wide range of timescales. By careful consideration of thermal processes we can clearly identify intrinsic topological defect annihilation processes on a timescale ps and find a signature of extrinsic defect-dominated relaxation dynamics occurring on longer timescales.
pacs:
71.45.Lr, 78.47.jh, 63.20.kpTopological defects are non-linear objects which can be created any time a symmetry-breaking transition occurs.(Bunkov and Godfrin, 2000; Kibble, 1976; Zurek, 1985) They can be described theoretically as solutions to systems of nonlinear differential equations based on Ginzbug-Landau theory. They are of great fundamental importance in fields such as cosmology where they appear as strings and condensed matter physics where they appear in the form of vortices and domain walls. While a good understanding of static properties of topological defects (TD) has come from systems such as liquid crystals, the dynamics of TDs are much less understood. Electronic phase transitions in charge-density wave systems(Grüner, 1994) are particularly interesting model systems for studying the general behavior of the dynamics of topological excitations. The collective excitations are not overdamped which allows the observation of both collective and quasiparticle (QP) excitations as they evolve through the transition. In particular, they can be used to investigate the dynamic behavior of topological excitations such as domain walls in real time using ultrafast laser techniques.
Recently, time-resolved experiments have shown that following a quench created by a strong laser pulse the order parameter (OP) oscillates coherently, revealing coherent TD dynamics.(Yusupov et al., 2010) Domain walls are created parallel to the crystal surface which can coherently annihilate on the timescale of a few picoseconds with the accompanying emission of collective modes which have been detected as modulations of reflectivity upon reaching the surface. In addition to coherent defect dynamics, incoherent topological defects created by the Kibble-Zurek mechanism(Kibble, 1976) are also expected, but very little is known about the dynamics of incoherent TD dynamics in CDW systems, and in condensed matter systems in general.
In this paper we investigate the incoherent evolution of TDs using a specially devised 3-pulse femtosecond spectroscopy(Yusupov et al., 2010) technique which allows the direct background free observation of the evolution of the order parameter (OP) as a function of time through the electronic ordering transition. In a rapid quench experiment order emerges in different regions of the sample independently so multiple topological defects can be created. Their presence can be detected in the optical response as a spatial inhomogeneity of the order parameter. The determination of incoherent TD dynamics is a challenging task, however. Because of thermal diffusion processes, which evolve on similar timescales as topological annihilation and also introduce temperature inhomogeneity, careful temperature calibration from independently measured frequencies is needed to accurately account for thermal effects. We deal with the problem by careful calibration of the transient effective temperatures, which enables us to unambiguously distinguish the incoherent dynamics from thermal diffusion effects.
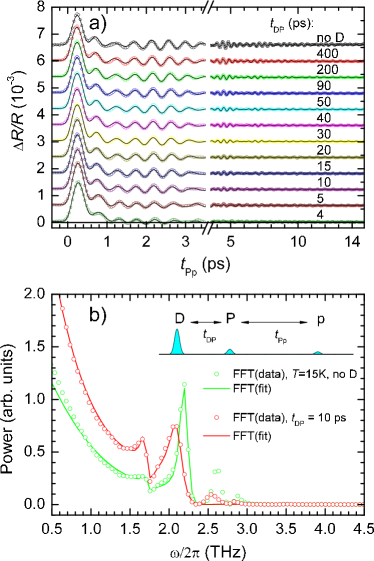
In our experiments, we use a three pulse technique described in refs. [Yusupov et al., 2010; Kusar et al., 2011]: A "destruction" (D) laser pulse at 800 nm excites a cold sample111The growth of the samples by a self-flux technique and subsequent characterization was described elsewhere.(Ru et al., 2008) into the disordered state, breaking up the CDW order. We then monitor the evolution of the transient reflectivity excited with a weaker pump (P) pulse as a function of time delay between the D and P pulse (the pulse sequence nomenclature is illustrated in the insert to Fig. 1b)). The D pulse fluence is adjusted to twice the threshold for causing the destruction of the ordered state (Yusupov et al., 2010). After a quench by the laser pulse, order recovers first through the sub-picosecond recovery of the quasiparticle gap leading to coherent oscillations of the OP and the coherent creation of TDs which decay within 5-8 ps in TbTe3 (Yusupov et al., 2010). Since the CDW coherence length (2 nm) is much shorter than the size of the laser excited volume (m dia), order emerges with different phase in different regions, resulting in the formation of topological defects whose spatial distribution is determined partly by the inhomogeneous excitation and partly by the underlying fluctuations which nucleate the emergence of order by the so called Kibble-Zurek(Kibble, 1976; Zurek, 1985) mechanism. The resulting inhomogeneity of the OP leads to observable temporally resolvable effects in the frequency, linewidth and amplitude of the collective amplitude mode, all of which are related to the OP, as shown in previous studies(Yusupov et al., 2008).
In Fig. 1(a) we show the raw data on the transient reflectivity of TbTe3 at different time delays after the pulse. After the initial QP relaxation we observe oscillations due to the coherently excited order parameter amplitude mode (AM) and other phonons.(Schmitt et al., 2008; Yusupov et al., 2008; Lavagnini et al., 2010) The level of noise is very small, due to the the excellent intrinsic properties of the material, which helps us make a detailed quantitative analysis. We analyze the transient reflectivity oscillations using the theory for displacive excitation of coherent phonons:(Zeiger et al., 1992)
| (1) |
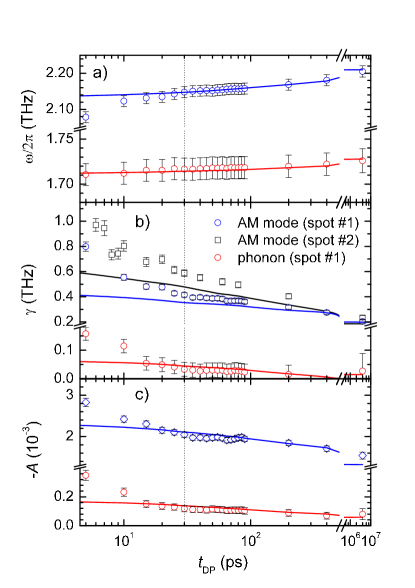
where , and is the laser pulse length. The first integral represents the QP relaxation with the relaxation time , while the sum depicts the response of coherent phonons with frequencies , and effective dampings . corresponds to the QP relaxation amplitude while the residual value at long delays is . To limit the number of fitting parameters we keep only two phonon terms corresponding to the AM at 2.2 THz and the 1.7-THz phonon which strongly interacts with the AM at higher temperatures.(Yusupov et al., 2008) Fig 1(b) shows the fast Fourier transform (FFT) of the raw data and of the fit to the data i) without the D pulse and ii) for a D-P delay of ps, clearly showing that Eq. (1) fits the response very well below THz irrespective of . The -dependence of the frequency, linewidth and amplitude of the AM and 1.7 THz phonon modes are shown in Fig. 2. The linewidth is shown for two sets of data obtained from different spots on the sample in two separate measurements.
In order to obtain a calibration of the effective temperature of the photoexcited sample volume we measured independently, by means of a standard pump-probe experiment, the -dependence of the reflectivity transients in the thermal equilibrium and determine the -dependent amplitude, frequency [] and damping [] for the AM. Using these calibrations we are in a position to determine as a function of time from and and take it into account to obtain the thermal inhomogeneity dynamics. The time-dependence of the is shown in Fig. 3(b). We observe that the two effective temperatures and obtained from the and systematically differ by approximately 20 K indicating an excess AM linewidth with respect to the thermal equilibrium state.
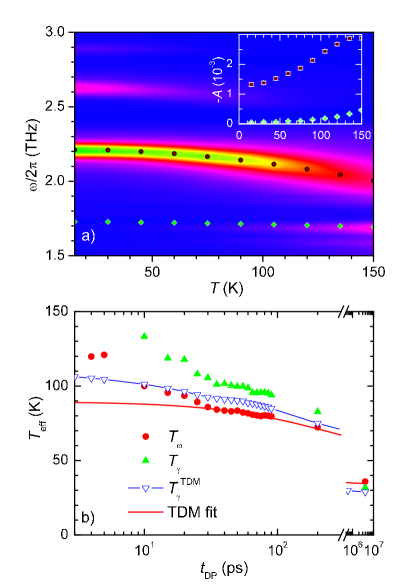
One of the most obvious contributions to the excess AM linewidth is the inhomogeneous broadening caused by the thermal inhomogeneity. In order to be able to determine and analyze any other contributions to the linewidth we therefore determine the contribution of the thermal inhomogeneity to the excess AM linewidth. To do this we first fit a thermal diffusion model(Mertelj et al., 2009; sup, ) (TDM) to the effective temperature obtained from the AM frequency , and then use the TDM parameters to calculate the transient optical reflectivity which fully takes into account inhomogeneity of the temperature in the excited volume.(sup, ) As seen in Fig. 3 (b), can be fit very well over 5 decades of time from 30 ps to 4 s using a one-dimensional222The diameters of the beams are much larger that the optical penetration depth so on the relevant timescale the heat diffusion is 1D. TDM, where , and the fit parameter ps represents the characteristic heat diffusion time(sup, ).
Comparing now the simulation(sup, ) with the experiment in Fig. 2, we see that the validity of the TDM beyond ps is well supported by the good agreement of the simulation for both the AM and the 1.7-THz phonon parameters. We can thus safely conclude, that the recovery of the order parameter on timescales longer than ps is primarily governed by the 1D heat diffusion process.
Below ps however, there is a large discrepancy between the calculated , and other phonon parameters in comparison to the data, even after carefully taking into account the thermal inhomogeneity. The observed magnitude and the evolution of for ps clearly cannot be assigned solely to the temperature inhomogeneity. Subtracting the thermal inhomogeneity contribution from the AM linewidth in Fig. 2 b), we can now isolate the topological-defects inhomogeneity contribution as shown in Fig. 4.
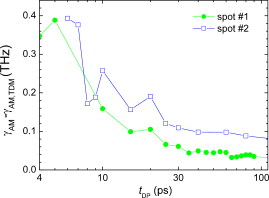
As discussed in the introduction some of the defects created in the quench process annihilate coherently resulting in an aperiodic modulation of the AM intensity and frequency in the first 8 picoseconds(Yusupov et al., 2010). The very low level of experimental noise in the raw data allows us to attribute the observed data scatter in Fig. 4 to the coherent defect dynamics in the material, rather than experimental noise.
The modulation of the AM due to the defects that annihilate incoherently is unfortunately not detected directly by our stroboscopic technique. However, the incoherent topological defects give rise to a spatial inhomogeneity of the order parameter and a decoherence of the AM oscillations leading to an increased linewidth for ps which we have detected in our experiments. Concurrently the defects give rise to a softening of the collective mode , because of the OP suppression which they cause. The increase of the coupled 1.7-THz phonon effective damping at shorter as shown in Fig. 2 is presumably also caused by the inhomogeneity of the OP. A further manifestation of the incoherent annihilation is the increase of the amplitudes of the AM and the phonon with respect to the TDM for ps, which is also consistent with the suppression of the OP when one takes into account that the amplitudes of the modes increase with the decreasing OP amplitude deduced from their -dependence shown in the inset of Fig. 3(a).
Apart from intrinsic topological defect annihilation processes, which we have identified on a timescale of 30 ps, we expect to observe annihilation of domain walls pinned to defects and imperfections at longer times. The timescale of their annihilation may extend well beyond 30 ps. Evidence for such slower extrinsic recombination processes comes from the long time behavior shown in Fig. 4. remains systematically larger than the predicted thermally inhomogeneous linewidth suggesting a slower recombination of the pinned domain walls.(mai, )
Recently the absence of topological defects on ultrafast timescales in highly excited charge ordered (CO) nickelate was suggested.(Lee et al., 2012) A slow relaxation of the CO X-ray diffraction peak intensity, on the timescale of ps, was, due to the absence of any increase of the diffraction peak linewidth, attributed to a depopulation of the phason mode. While, contrary to Lee et al. (2012), our excitation density is clearly high enough to excite topological defects,(Yusupov et al., 2010) there exists a possible anharmonic contribution of the highly excited phason mode to the AM linewidth. The anharmonic processes, however, contribute to both, the linewidth and frequency renormalization of the AM,(Balkanski et al., 1983) and can not lead to the difference between and as observed in the experiment.
In conclusion, these experiments demonstrate the possibility of studying both coherent and incoherent topological defects dynamics in complex materials in which the order parameter can be monitored in real time through the dynamics of the collective mode. The dynamics on a timescale of ps can unambiguously be associated with intrinsic topological defects annihilation in TbTe3 following a laser quench arising from the time-dependent inhomogeneity and suppression of the order parameter. The inhomogeneity causes an increased effective damping of the amplitude mode while the suppression of the order-parameter is indicated by an additional softening of the AM-mode frequency. Beyond ps we find a predominantly thermal-diffusion governed order-parameter dynamics with a signature of extrinsic defect annihilation dynamics.
References
- Bunkov and Godfrin (2000) Y. Bunkov and H. Godfrin, Topological defects and the non-equilibrium dynamics of symmetry breaking phase transitions, vol. 549 (Springer, 2000).
- Kibble (1976) T. W. B. Kibble, Journal of Physics A: Mathematical and General 9, 1387 (1976), URL http://stacks.iop.org/0305-4470/9/i=8/a=029.
- Zurek (1985) W. Zurek, Nature 317, 505 (1985).
- Grüner (1994) G. Grüner, Density waves in solids (Addison-Wesley New York, 1994).
- Yusupov et al. (2010) R. V. Yusupov, T. Mertelj, P. Kusar, V. Kabanov, S. Brazovskii, J.-H. Chu, I. R. Fisher, and D. Mihailovic, Nature Physics 6, 681 (2010).
- Kusar et al. (2011) P. Kusar, T. Mertelj, V. V. Kabanov, J.-H. Chu, I. R. Fisher, H. Berger, L. Forró, and D. Mihailovic, Phys. Rev. B 83, 035104 (2011), URL http://link.aps.org/doi/10.1103/PhysRevB.83.035104.
- Yusupov et al. (2008) R. V. Yusupov, T. Mertelj, J.-H. Chu, I. R. Fisher, and D. Mihailovic, Phys. Rev. Lett. 101, 246402 (2008), URL http://link.aps.org/doi/10.1103/PhysRevLett.101.246402.
- (8) Please see supplemental information.
- Schmitt et al. (2008) F. Schmitt, P. Kirchmann, U. Bovensiepen, R. Moore, L. Rettig, M. Krenz, J. Chu, N. Ru, L. Perfetti, D. Lu, et al., Science 321, 1649 (2008).
- Lavagnini et al. (2010) M. Lavagnini, H.-M. Eiter, L. Tassini, B. Muschler, R. Hackl, R. Monnier, J.-H. Chu, I. R. Fisher, and L. Degiorgi, Phys. Rev. B 81, 081101 (2010), URL http://link.aps.org/doi/10.1103/PhysRevB.81.081101.
- Zeiger et al. (1992) H. J. Zeiger, J. Vidal, T. K. Cheng, E. P. Ippen, G. Dresselhaus, and M. S. Dresselhaus, Phys. Rev. B 45, 768 (1992), URL http://link.aps.org/doi/10.1103/PhysRevB.45.768.
- Mertelj et al. (2009) T. Mertelj, A. Ošlak, J. Dolinšek, I. R. Fisher, V. V. Kabanov, and D. Mihailovic, Phys. Rev. Lett. 102, 086405 (2009), URL http://link.aps.org/doi/10.1103/PhysRevLett.102.086405.
- (13) In the standard 2-pulse pump-probe experiments we observe some spatial variation of the AM linewidth which we assign to the intrinsic structural-defect/impurity density spatial variation in the sample. Since, in the absence of 2-pulse -dependent data for spot #2, the TDM simulation for spot #2 was based on -dependent scans from spot #1 the offset between the spots can be attributed to the systematic error due to the spatial variation of the AM linewidth.
- Lee et al. (2012) W. Lee, Y. Chuang, R. Moore, Y. Zhu, L. Patthey, M. Trigo, D. Lu, P. Kirchmann, O. Krupin, M. Yi, et al., Nature Communications 3, 838 (2012).
- Balkanski et al. (1983) M. Balkanski, R. F. Wallis, and E. Haro, Phys. Rev. B 28, 1928 (1983), URL http://link.aps.org/doi/10.1103/PhysRevB.28.1928.
- Ru et al. (2008) N. Ru, C. Condron, G. Margulis, K. Shin, J. Laverock, S. Dugdale, M. Toney, and I. Fisher, Physical Review B 77, 035114 (2008).