Data management and analysis with WRF and SFIRE
Abstract
We introduce several useful utilities in development for the creation and analysis of real wildland fire simulations using WRF and SFIRE. These utilities exist as standalone programs and scripts as well as extensions to other well known software. Python web scrapers automate the process of downloading and preprocessing atmospheric and surface data from common sources. Other scripts simplify the domain setup by creating parameter files automatically. Integration with Google Earth allows users to explore the simulation in a 3D environment along with real surface imagery. Postprocessing scripts provide the user with a number of output data formats compatible with many commonly used visualization suites allowing for the creation of high quality 3D renderings. As a whole, these improvements build toward a unified web application that brings a sophisticated wildland fire modeling environment to scientists and users alike.
Index Terms— Data preprocessing, Data analysis, Geophysics computing, Client-server systems
1 Introduction
The weather research and forecasting model (WRF) is a full-featured mesoscale weather model used as a research tool and operational forecasting [1]. SFIRE is an add-on wildland fire forecasting model coupled with WRF [2]. An earlier version is available in WRF release as WRF-Fire.111http://www.openwfm.org/wiki/WRF-Fire_development_notes Because WRF is widely used in the research community, there are a large number of standard tools available for creating and visualizing its simulation outputs. However, SFIRE acts on domains that are significantly higher resolution than the typical WRF simulation. In addition, SFIRE uses surface variables on a refined subgrid that is different from the standard atmospheric surface variables. These subgrid variables and the higher resolution modeling typically requires special processing for input and visualization that is not supported by most commonly used tools. For this reason, we have begun to develop new software that mimic and extend standard utilities for data processing and visualization specifically tailored for use with SFIRE.
2 Model initialization and data preprocessing
As computers become more powerful, there is increasing interest in simulating smaller scale phenomena using WRF than is typically associated with mesoscale weather forecasting. In particular, a typical SFIRE simulation occurs at mesh resolutions on the order of 10 m or less. Even the highest resolution surface data provided with WPS is several hundred times coarser. For these fine scale domains, the ability to import custom datasets into WPS is essential for the initialization of a realistic simulation [3]. Resources such as the USGS’s seamless data server that provide open access to high quality surface data are generating a large interest in initializing WRF simulations using custom datasets. WPS provides a mechanism for these datasets through a simple binary file format that is described in the WRF technical documentation [4]; however, there is no standard API or GIS software capable of writing to it. Users who lack sufficient technical knowledge are currently unable to process this data into WRF.
Prior work related to WRF-Fire has lead to small utilities that are able to convert standard GIS GeoTIFF files into Geogrid’s binary file format. The GeoTIFF specification is commonly used and can be provided as output from a wide range of GIS applications. TopoGrabber222http://laps.noaa.gov/topograbber is a Python application based on this work that is capable of downloading and converting topological data automatically. More recently, modifications to Geogrid have been written allowing it to read GeoTIFF files directly, and extensions to WPS standard programs have made it possible to ingest GeoTIFF data directly from the USGS into a WRF simulation [5]. The implemented changes to Geogrid allows a user to import a USGS GeoTIFF dataset directly into the WRF workflow without the (often) difficult and error prone procedure of converting the data. The GeoTIFF interface is compiled in as an optional component and is useful for both experienced GIS users with complicated workflows and those who just want to replace a single data source. The implementation allows overriding erroneous metadata without modification to the source images, and efficient access to the data.
With tools in place to automatically retrieve and integrate known data sources into a simulation, it is now possible to automate nearly all of the steps necessary to initialize a simulation for WRF and SFIRE. A command-line client has been written using Python to generate all required parameter and input files for a simulation given user defined domain and fire ignition specifications. This script is currently being integrated with a web application based on Google Maps, providing users with a fully graphical environment for designing a simulation on real surface imagery. This client application is coupled with a server located on a high performance compute cluster that runs the simulation on demand and returns results back to the client as they are processed.
3 Model evaluation and data postprocessing
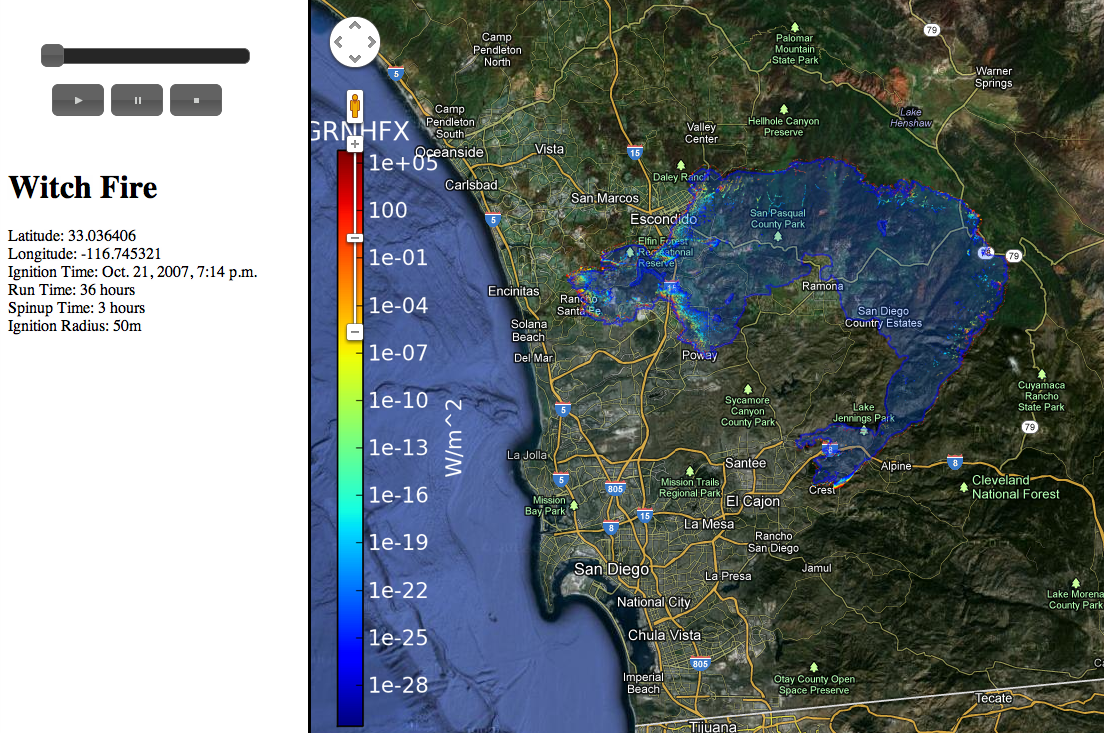
By default, WRF generates NetCDF binary files containing the raw simulation output. These files contain a large number of variables that are useful in analyzing the simulation output; however, they are often too large to be transferred to the user’s computer for visualization. Several utilities have been written that allow users to visualize the simulation without downloading the full output. For a quick overview of the fire propagation, it is possible to generate a KMZ file containing a raster image of any surface variable or a georeferenced polygon outlining the burning region at a given timestep. This KMZ file can be opened in a number of GIS applications including Google Earth to be overlaid on a rendering of the earth’s surface. Google Earth allows the user to play back the images in the KMZ files as an animation with a timestamp indicating the simulation time. The web application in development uses this capability to display the results of the running simulation on top of Google Maps.
There are a number of options for rendering a 3D visualization of the simulation. VAPOR is an application developed at NCAR designed for visualization of standard WRF atmospheric simulations. The postprocessing utility wrf2vdf takes a standard WRF NetCDF output file and generates a more compact vdf file containing only the fields the user wishes to investigate. VAPOR features a very fast and easy to use GUI for generation of high quality images; however, it does not support the refined grids used by the fire variables. When using VAPOR with SFIRE, users are limited to low resolution versions of fire variables, which can result in blocky images.
Other popular 3D visualization applications include Paraview, MayaVI, and VisTrails. These applications all use the Visualization Toolkit (VTK) as a backend and do not have any built in capability for reading WRF output files. SFIRE contains a Python script wrf2vtk that can generate VTK compatible files from WRF outputs at full resolution. This script is much like VAPOR’s wrf2vdf in that it converts the data to a more compact representation and compresses the files for transfer to a local computer.
4 Toward a fire forecasting web portal
Automated scripting of the model setup procedure has lead to the development of a web portal providing users with a simple interface for running SFIRE simulations using real data. The user registers with the site with a username and password. Upon logging in, he or she is presented with a Google Maps interface with instructions to click on a point on the map to create a new ignition. When clicked, a dialog box appears allowing the user to customize the parameters of the simulation. The user is notified by email on completion of the simulation when the user can return to the web portal to view the output of this and all prior simulations. Currently, the output of the simulation displays as an animation the heat flux into the atmosphere from the fire. In the future, we plan to add the ability to visualize other surface variables such as fuel types, winds, and fire danger ratings.
The web frontend is built on top of a Google Maps interface using its javascript interface. The core web application including user and content management is served by Django. The backend component is executed at a remote site on a compute cluster accessible via ssh from the web server. The web application passes a string in the form of simple keyword=value pairs specifying parameters of the fire simulation. These parameters include the ignition location and time chosen by the user, domain size and resolution, and simulation run time among others. The web server executes an application script on the compute server providing the simulation parameters and a session ID. The compute server initializes and executes the simulation while a post processing daemon watches for new output files. Whenever a new output file is detected, a visualization script is executed generating a KMZ file, which is then uploaded to the web server to be displayed to the user.
5 Conclusion and future work
The utilities presented here are designed to enhance the usability of SFIRE for the average user by eliminating the need for complex data conversion or an in depth understanding of the underlying code. They are leading to a unified application where a user can design a simulation through a series of graphical dialogs, spawn the simulation on a remote compute cluster, and visualize the output of the running simulation locally. The development of such an application would provide an invaluable tool for research and education.
References
- [1] J. Michalakes, J. Dudhia, D. Gill, T. Henderson, J. Klemp, W. Skamarock, and W. Wang, “The Weather Reseach and Forecast model: Software architecture and performance,” 2004, Proceedings of the 11th ECMWF Workshop on the Use of High Performance Computing In Meteorology, 25-29 October 2004, Reading U.K. Ed. George Mozdzynski.
- [2] Jan Mandel, Jonathan D. Beezley, and Adam K. Kochanski, “Coupled atmosphere-wildland fire modeling with WRF 3.3 and SFIRE 2011,” Geoscientific Model Development, vol. 4, pp. 591–610, 2011.
- [3] Georgi Jordanov, Jonathan D. Beezley, Nina Dobrinkova, Adam K. Kochanski, and Jan Mandel, “Simulation of the 2009 Harmanli fire (Bulgaria),” 8th International Conference on Large-Scale Scientific Computations, Sozopol, Bulgaria, June 6-10, 2011, 2011, Lecture notes in Computer Science, Springer, to appear. Prepring available at arXiv:1001.1588.
- [4] Wei Wang, Cindy Bruyère, Michael Duda, Jimy Dudhia, Dave Gill, Hui-Chuan Lin, John Michalakes, Syed Rizvi, Xin Zhang, Jonathan D. Beezley, Janice L. Coen, and Jan Mandel, “ARW version 3 modeling system user’s guide,” Mesoscale & Miscroscale Meteorology Division, National Center for Atmospheric Research, July 2010, http://www.mmm.ucar.edu/wrf/users/docs/user_guide_V3/ARWUsersGuideV3.pdf.
- [5] Jonathan D. Beezley, A. K. Kochanski, V. Y. Kondratenko, and J. Mandel, “Integrating high-resolution static data into WRF for real fire simulations,” Paper 6.3, Ninth Symposium on Fire and Forest Meteorology, Palm Springs, October 2011, 2011, http://ams.confex.com/ams/9FIRE/webprogram/Paper192276.html, retrieved December 2011.