Associated Hi absorption towards the core of the radio galaxy 3C 321–LABEL:lastpage
Associated Hi absorption towards the core of the radio galaxy 3C 321
Abstract
We report the results of Giant Metrewave Radio Telescope (GMRT) observations of Hi absorption towards the FRII radio galaxy 3C321 (J1531+2404), which is associated with an active galaxy interacting with a companion. The absorption profile towards the radio core is well resolved and consists three components, of which the two prominent ones are red-shifted by 186 and 235 km s-1 relative to the optical systemic velocity. The neutral hydrogen column density towards the core is estimated to be (Hi)=9.231021(/100)(/1.0) cm-2, where and are the spin temperature and covering factor of the background source respectively. We also present radio continuum observations of the source with both the GMRT and the Very Large Array (VLA) in order to understand the properties of a plume of emission at an angle of 30∘ to the source axis. This feature appears to have a steep high-frequency spectrum. The current hotspots and jet are active and seen in X-ray emission. The spectral ages of the lobes are 26 Myr. We discuss the possibility that the plume could be relic emission due to an earlier cycle of activity.
keywords:
galaxies: active – galaxies: nuclei – galaxies: individual: 3C321 – radio continuum: galaxies – radio lines: galaxies1 Introduction
Studying the properties of the gaseous environments of radio galaxies and quasars on different scales are important for understanding the interactions of the radio jets with the external environment and the evolution of these sources. Such studies could also provide useful insights towards understanding the triggering of radio activity, and examining consistency of these properties with the unified schemes for active galactic nuclei (AGN) (Pihlström, Vermeulen & Conway 2003; Gupta & Saikia 2006b). A useful way of probing the cold neutral component of this gas is via 21-cm Hi absorption towards radio sources, which range in size from the sub-galactic sized compact steep-spectrum (CSS) and gigahertz peaked-spectrum (GPS) sources, to the large radio galaxies and quasars which are up to a few Mpc in size. The CSS and GPS objects (O’ Dea 1998) have been inferred to be young (105 yr), while the larger sources could be older than 108 yr (Jamrozy et al. 2008; Konar et al. 2008).
Several Hi absorption line studies have shown that CSS and GPS objects tend to exhibit absorption lines more frequently than larger sources, with the lines being both blue- and red-shifted relative to the systemic velocity and exhibiting complex line profiles. The Hi column densities also appear to be anticorrelated with the source sizes (Pihlström, Conway & Vermeulen 2003; Gupta et al. 2006), and are broadly consistent with the unified scheme for radio galaxies and quasars. The relationship between the Hi column density and core prominence, which is being used as a statistical indicator of source orientation, appears to be consistent with the Hi gas being distributed in a circumnuclear disk on a scale smaller than the size of the compact radio sources (Gupta & Saikia 2006b). Evidence of absorption arising from a circumnuclear disk-like structure has also been inferred from higher-resolution, Very Long Baseline Interferometric (VLBI)-scale spectroscopic observations in several sources such as the CSS object J0119+3210 (4C+31.04) and the cores of a few larger sources, Cyg A, NGC 4261 and Hydra A (e.g. Conway & Blanco 1995; Taylor 1996; Conway 1999; van Langevelde et al. 2000). A comparison of the Hi absorption properties towards the cores of larger sources with those of the CSS and GPS objects might provide insights towards understanding the evolution of the gaseous properties as the source ages. Such a study indicates that the detection of Hi in absorption towards the cores of larger sources is significantly smaller than for CSS and GPS objects suggesting an evolution in the gaseous content of the host galaxies with source age (Chandola et al., in preparation). There have also been suggestions that the torus/disk may be different in FR I and FR II sources, which is likely to be reflected in the Hi absorption properties of these two classes of sources (e.g. Morganti et al. 2001). Given the small number of detections at present, the difference in detection rate between FR I and FR II sources does not appear to be significant (Chandola et al., in preparation).
An important aspect in our understanding of AGN is the episodic nature of their nuclear activity, and the physical processes that might be governing it (Saikia & Jamrozy 2009 for a review). There appears to be a trend for a high rate of detection of Hi absorption in sources with evidence of rejuvenated activity. These include the giant radio galaxy 3C236 which also exhibits evidence of star formation (Conway & Schilizzi 2000), the giant radio galaxy J1247+6723 with a GPS core (Saikia, Gupta & Konar 2007), the misaligned DDRG 3C293 (Beswick et al. 2004; Emonts et al. 2005), the well-studied southern radio galaxy Centaurus A (Sarma, Troland & Rupen 2002; Morganti et al. 2008), 4C 29.30 (Chandola, Saikia & Gupta 2010) and CTA 21 (Salter et al. 2010). The well-known FRII radio galaxy Cygnus A, which has been shown to have two cycles of radio activity from radio and X-ray observations (Steenbrugge, Blundell & Duffy 2008; Steenbrugge, Heywood & Blundell 2010), also exhibits nuclear Hi absorption (Conway 1999).
In this paper we present Hi observations with the Giant Metrewave Radio Telescope (GMRT) to localise and put constraints on the size of the Hi absorber in the FRII radio galaxy 3C321, which has been reported earlier from Arecibo observations (Mirabel 1990). We also present radio continuum observations with the GMRT and the Very Large Array (VLA) of the diffuse plume of emission to explore whether this feature might be relic emission from an earlier cycle of activity.
2 3C321
The radio galaxy 3C321 is an FRII radio galaxy at a redshift of 0.0961 (luminosity distance = 436 Mpc) so that 1 arcsec corresponds to 1.759 kpc in a Universe with H0=71 km s-1 Mpc-1, =0.27 and =0.73. Our observations show that it has two prominent hot-spots at the outer edges with an overall angular size of 286 arcsec, which corresponds to a projected linear size of 503 kpc, similar to that found in the literature (e.g. Baum et al. 1988; Lal, Hardcastle & Kraft 2008). On smaller scales, a VLA image with an angular resolution of 1.4 arcsec by Baum et al. (1988), shows a compact core, a knot towards the north-west separated from the core by 3.5 arcsec (6 kpc), and a somewhat diffuse but bright and prominent jet extending upto 38 kpc. There is also evidence of a weaker counter-jet towards the south-east. A lower-resolution radio image has shown evidence of collimated emission extending all the way to the north-western hot-spot, and a diffuse plume of emission starting beyond the bright emission in the jet and extending for 140 kpc at an angle of 30∘ to the source axis (Evans et al. 2008).
Optical observations show that the galaxy associated with the radio source has a prominent kpc-scale dust lane, and a fainter companion towards the north-west (Hurt et al. 1999; Martel et al. 1999; Roche & Eales 2000; de Koff et al. 2000). The two galaxies are embedded in a common stellar envelope, and the velocity difference between the two galaxies is within 200 km s-1. Optical spectroscopic and X-ray observations suggest that the companion galaxy also hosts an AGN (Filippenko 1987; Robinson et al. 2000; Evans et al. 2008). There are different regions of X-ray emission, with emission from both the hot-spots and regions offset from the radio peaks (Hardcastle et al. 2004; Evans et al. 2008). Hubble Space Telescope (HST) STIS NUV and [Oiii] images, along with the Chandra and Spitzer IRAC 4.5 m images show the complex distribution of gas in the circumnuclear region (e.g. Evans et al. 2008).
3 Observations and data reduction
The results presented here are based on Hi observations made with the GMRT, as well as on archival GMRT and VLA data. The observing log for both the GMRT and VLA observations is listed in Table 1.
| Telescope | Observation | Observed | Bandwidth |
|---|---|---|---|
| date | Freq. | ||
| (MHz) | (MHz) | ||
| (1) | (2) | (3) | (4) |
| GMRTa | 2005 May 31 | 614 | 28 |
| GMRT | 2009 Feb 01 | 1295 | 16 |
| VLA-Ca | 1986 Dec 02 | 1511 | 50 |
| VLA-Da | 1990 Jan 08 | 4860 | 100 |
a archival data
The GMRT Hi observations were made in the standard manner, with each observation of the target-source interspersed with observations of the phase calibrator (J1609+266). 3C286 and 3C48 were observed as the flux density and bandpass calibrators, and all flux densities are on the Baars et al.(1977) scale using the latest VLA values. The source was observed in a full-synthesis run of approximately 8 hours including calibration overheads. The GMRT Hi data, as well as the archival GMRT data were calibrated and reduced using the pipeline developed by one of us (SS). We also reduced the GMRT archival data at lower frequencies but found the image and data quality to be unsatisfactory and have not included these here. The archival VLA data were reduced in the standard way using the Astronomical Image Processing System (AIPS) package.
4 Results and discussion
4.1 Hi absorption spectra
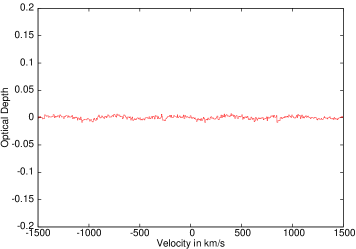
In Fig. 1 we present the GMRT image of 3C321 at 1295 MHz which was obtained from channels free from absorption. This shows the radio core, the knot and a somewhat diffuse jet towards the north-west, and both the hot-spots on opposite sides of the nucleus. The peak flux density of the radio core in our image is 25.2 mJy/beam. The flux densities of the different features are listed in Table 3. The emission from the north-western (NWL) and south-eastern (SEL) lobes are almost entirely from the hotspots seen in these images, while the central region (Cen) includes the core and more extended emission from the jet close to the nucleus which is not well resolved in our lower resolution images.
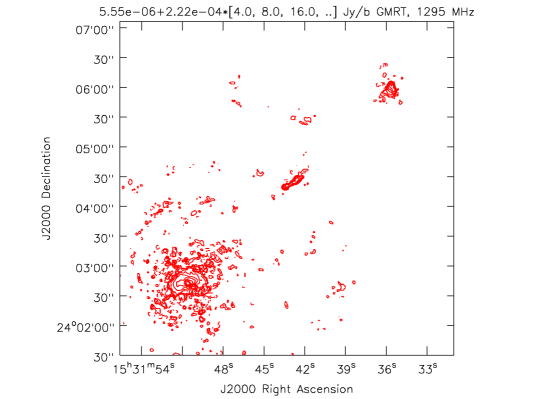
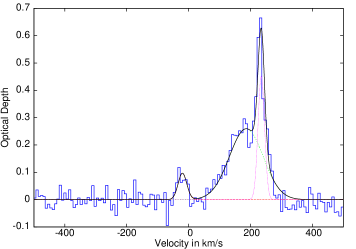
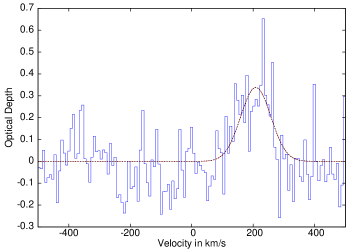
The Hi absorption spectrum towards the core of 3C321 is presented in the lower panel of Fig. 1. The Hi absorption, reported earlier from Arecibo observations (Mirabel 1990) with low spatial resolution (3.6 arcmin), is established to be clearly towards the core of the radio galaxy. There is also evidence of weak absorption towards the knot in the jet (Fig. 1). No absorption has been detected towards the hotspots. The Hi column density, (Hi), integrated over the entire spectrum towards the core using the relation
| (Hi) | = | ||
|---|---|---|---|
| = | (1) |
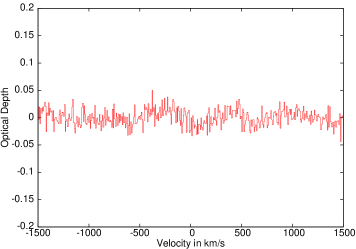
where , and are the spin temperature, optical depth at a velocity and the fraction of background emission covered by the absorber respectively, is 9.23 1021(/100)(1.0/) cm-2. In above equation, and are peak optical depth and FWHM (Full Width at Half Maximum) of the gaussians fitted to the absorption profiles respectively. We have assumed =100 K and =1.0. For non-detections, the upper limits on the Hi column densities were calculated by replacing the in the above equation by 3 upper limits to the peak optical depths estimated from the rms in the spectra, and assuming =100 kms. The absorption profile towards the core has been fitted with three Gaussian components (Fig. 1), and the fit parameters are summarised in Table 2. With similar assumptions, the column density towards the knot in the jet is 7.53 1021(/100)(1.0/) cm-2. The upper limits to the Hi column density for the peaks of emission in the NW and SE lobes are 8.65 and 1.78 1020(/100)(1.0/) cm-2 respectively. All the components of the absorption profile are red-shifted relative to the optical systemic velocity, except for the weak feature at 19 km s-1. Although this feature is relatively weak, there is some evidence of it in the Arecibo spectrum (Mirabel 1990).
Kinematics of the gas in the circum-nuclear regions of the host galaxies may sometimes lead to different velocities for different emission lines, making it difficult to infer precisely the kinematics of the absorbing cloud (e.g. Tadhunter et al. 2001; Vermeulen et al. 2006). In the case of 3C321, the Hi absorbing clouds appear significantly red-shifted by over 200 km s-1. Considering the cores of extended radio sources with Hi absorption, peaks of absorption are known to be red-shifted, blue-shifted or consistent with the velocity of the emission line gas (e.g. Conway & Blanco 1995; Morganti et al. 2001; Gupta & Saikia 2006a; Chandola et al., in preparation), similar to what has been seen in the case of CSS and GPS objects (Vermeulen et al. 2003; Gupta et al. 2006). In addition, fast and broad outflows in Hi with velocities extending up to several thousand km s-1 have been reported for a number of radio galaxies (Morganti, Tadhunter & Oosterloo 2005; Emonts et al. 2005), possibly due to outflowing gas caused by jet-cloud interactions. The blue-shifted tail seen in 3C452 (Gupta & Saikia 2006a), is perhaps caused by interaction of the jet with the absorbing gas. The redshift-components towards the core in 3C321 suggest that these might be due to infalling gas.
| Id. | Velocity | FWHM | (Hi) | |
| no. | 1020( | |||
| km s-1 | km s-1 | cm-2 | ||
| core | ||||
| 1∗ | 19.9(3.8) | 32.9(9.0) | 0.097(0.023) | 6.1(3.1) |
| 2 | 186.4(3.9) | 128.8(7.1) | 0.259(0.013) | 64.5(6.8) |
| 3 | 235.0(0.7) | 24.9(2.0) | 0.452(0.029) | 21.7(3.2) |
| knot | ||||
| 1 | 208.5(7.5) | 115.2(17.6) | 0.339(0.045) | 75.4(21.5) |
∗This feature is weak. However, there appears to be a similar weak feature in the Arecibo spectrum (Mirabel 1990).

4.2 Radio images
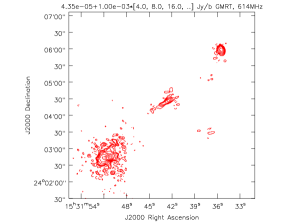
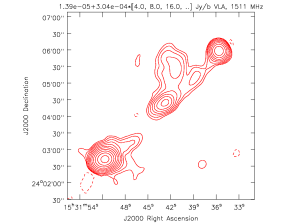
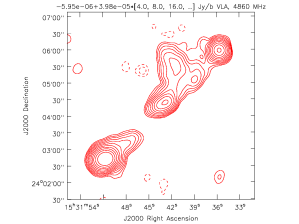
The GMRT images at 614 MHz and the VLA images at 1511 and 4860 MHz are shown in Fig. 3. The flux densities estimated from the images with an angular resolution of 16 arcsec are presented in Table 3. The errors in the flux densities are approximately 7 per cent at 614 MHz and 5 per cent at higher frequencies. These errors are mainly flux density scale uncertainities and calibration errors. All other errors are negligible. Spectral index error due to error propagated from these uncertainities is 0.13. The spectra of the different components are shown in Fig. 4. The lobes and the central region are seen clearly in all the images. The plume of emission is best seen in the VLA images at 1511 and 4860 MHz. The overall extent is smaller in the GMRT 614-MHz image. The spectral index () of both lobes between 600 and 5000 MHz is 0.99. The spectra of the lobes appear straight, and assuming that the break frequency is above 5 GHz, we can estimate an upper limit to their spectral ages. Assuming a proton to electron energy ratio of unity, and integrating from 10 MHz to 100 GHz, using the standard equations (e.g. Miley 1980) yields an equipartition magnetic field of 8.0 G for both the lobes, suggesting a spectral age of 26 Myr for the lobes. Detection of X-ray emission from the hot-spots, which is likely to be of synchrotron origin, suggests that these are young features, continuously being supplied with relativisitic plasma from the nucleus (Hardcastle et al. 2004; Evans et al. 2008).
The spectral index of the central region between 1500 and 5000 MHz is 0.66. The flux density of the central region appears to flatten towards higher frequencies. This is due to the increased contribution of the radio core which is not well resolved in our low resolution observations. The core has a flux density of 30 mJy at 5 GHz (Giovannini et al. 1988) while our GMRT observations at 1295 MHz yield a peak flux density of 25.2 mJy beam-1. Subtracting these values from the total flux densities of the central regions gives a straight spectrum between 600 and 5000 MHz with a spectral index of 0.98.
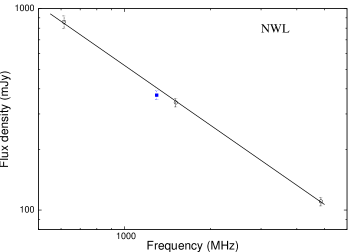
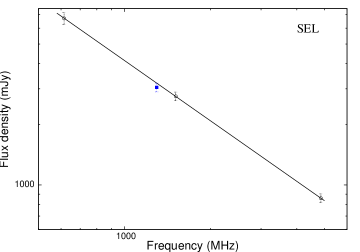
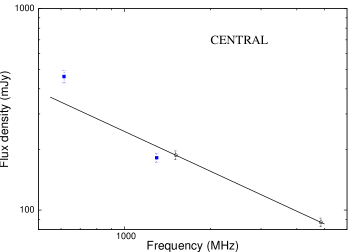
| Obs. | NWL | SEL | Plume | Cen | Total |
|---|---|---|---|---|---|
| Freq. | |||||
| (MHz) | (mJy) | (mJy) | (mJy) | (mJy) | (mJy) |
| (1) | (2) | (3) | (4) | (5) | (6) |
| 614 | 860 | 6718 | 100∗ | 460 | 8197 |
| 1295 | 372 | 3048 | 66∗ | 182 | 3686 |
| 1511 | 342 | 2751 | 82 | 187 | 3384 |
| 4860 | 110 | 858 | 33 | 87 | 1096 |
∗ Flux density has been estimated over same area as the VLA images, and the total flux density of the plume is likely to be higher.
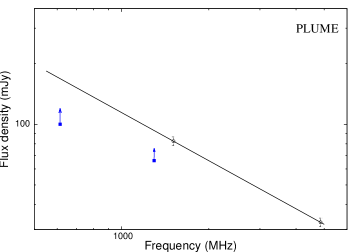
4.2.1 The plume of emission
The spectrum of the plume between 1511 and 4860 MHz, estimated from similar resolution VLA images, is steep with a spectral index of 0.8. The flux density of the plume at 614 MHz has been estimated over same area as at the higher frequencies. The plume is seen over a smaller extent at 614 MHz compared with the VLA images, and our estimate of the flux density at this frequency is 100 mJy. Lal, Hardcastle & Kraft (2008) estimate the flux density of the plume which they term the ‘north wing’ to be 32.1 and 17.2 mJy from their high- and low-resolution images at 610 MHz, and a spectral index of 0.30 between 1500 and 610 MHz. Our flux density estimate is clearly significantly higher than those of Lal et al. We imaged the archival GMRT data at the lower frequencies to determine the spectrum of the plume, but the images were not of satisfactory quality to give reliable estimates of the flux densities of the plume (see for example the 240-MHz image of Lal et al. 2008). The plume is also barely seen in the TIFR GMRT Sky Survey (TGSS; Sirothia et al., in preparation) image at 148 MHz; clearly better quality data are required to determine the low-frequency spectrum of the plume reliably. This would help determine any break in the spectrum and explore the possibility of whether the plume might be relic emission due to an earlier cycle of activity. Although the present suggestion is that the plume is caused by the deflection of the jet (e.g. Evans et al. 2008), the detailed spectrum of the plume would help examine the alternate possibility of this being relic emission. If the plume of emission is indeed due to an earlier cycle, the detection of Hi in absorption would be consistent with the trend for a high incidence of absorption in sources with evidence of recurrent activity (cf. Saikia & Jamrozy 2009 for a review; Salter et al. 2010 and references therein).
5 Concluding remarks
The GMRT Hi observations show that the absorption occurs towards the core component, with also a suggestion of absorption towards the knot in the jet 6 kpc north-west of the nucleus. This would indicate the size of the absorber to be 6 kpc if it is a single absorber. The absorption profile towards the core has multiple components with a total column density of (Hi)=9.231021(/100)(/1.0) cm-2. The column density towards the knot is (Hi)=7.541021(/100)(/1.0) cm-2. No absorption is seen towards the hot-spots.
Radio continuum observations of lobes with similar resolution show that their spectra are straight up to 5 GHz, suggesting spectral ages of 26 Myr for the lobes. The detection of X-rays from the hot-spots suggests that these are being continuously fed by the jets, consistent with their spectral ages. The full extent of the plume is not seen in our 614-MHz GMRT and also barely seen in the TGSS image at 148 MHz. However, better quality data are required to determine the spectrum of the plume reliably over a large frequency range to try and examine a possible break in the spectrum and explore whether the plume might be relic emission from an earlier cycle of activity.
Acknowledgments
We thank George Privon for useful discussions and sharing his results on 3C321 with us, Dave Green, the reviewer for many useful comments which helped improve the presentation of the paper, and the staff of GMRT for their help with the observations. The GMRT is a national facility operated by the National Centre for Radio Astrophysics of the Tata Institute of Fundamental Research. We thank the NRAO for use of the archival data. The National Radio Astronomy Observatory is a facility of the National Science Foundation operated under co-operative agreement by Associated Universities Inc. This research has made use of the NASA/IPAC extragalactic database (NED) which is operated by the Jet Propulsion Laboratory, Caltech, under contract with the National Aeronautics and Space Administration.
References
- (1) Baars J.W.M., Genzel R., Pauliny-Toth I.I.K., Witzel A., 1977, A&A, 61, 99
- (2) Baum S.A., Heckman T.M., Bridle A., van Breugel W.J.M., Miley G. K., 1988, ApJS, 68, 643
- (3) Beswick R.J., Peck A.B., Taylor G.B., Giovannini G., 2004, MNRAS, 352, 49
- (4) Chandola Y., Saikia D.J., Gupta N., 2010, MNRAS, 403, 269
- (5) Conway J.E., 1999, ASPC, 156, 259
- (6) Conway J.E., Blanco P.R., 1995, ApJ, 449, L131
- (7) Conway J.E., Schilizzi R.T., 2000, Proceedings of the 5th european VLBI Network Symposium, p. 123
- (8) de Koff S., et al. 2000, ApJS, 129, 33
- (9) Emonts B.H.C., Morganti R., Tadhunter C.N., Oosterloo T.A., Holt J., van der Hulst J.M., 2005, MNRAS, 362, 931
- (10) Evans D.A., et al. 2008, ApJ, 675, 1057
- (11) Filippenko A.V., 1987, IAUS, 124, 761
- (12) Giovannini G., Feretti L., Gregorini L., Parma P., 1988, A&A, 199, 73
- (13) Gupta N., Saikia D.J., 2006a, MNRAS, 370, L80
- (14) Gupta N., Saikia D.J., 2006b, MNRAS, 370, 738
- (15) Gupta N., Salter C.J., Saikia D.J., Ghosh T., Jeyakumar S., 2006, MNRAS, 373, 972
- (16) Hurt T., Antonucci R., Cohen R., Kinney A., Krolik J., 1999, ApJ, 514, 579
- (17) Hardcastle M.J., Harris D.E., Worrall D.M., Birkinshaw M., 2004, ApJ, 612, 729
- (18) Jamrozy M., Konar C., Machalski J., Saikia D.J., 2008, MNRAS, 385, 1286
- (19) Konar C., Jamrozy M., Saikia D.J., Machalski J., 2008, MNRAS, 383, 525
- (20) Lal D.V., Hardcastle M.J., Kraft R.P., 2008, MNRAS, 390, 1105
- (21) Martel A.R., et al. 1999, ApJS, 122, 81
- (22) Miley G., 1980, ARA&A, 18, 165
- (23) Mirabel I. F., 1990, ApJ, 352, L37
- (24) Morganti R., Oosterloo T.A., Tadhunter C.N., van Moorsel G., Killeen N., Wills K.A., 2001, MNRAS, 323, 331
- (25) Morganti R., Tadhunter C.N., Oosterloo T.A., 2005, A&A, 444, L9
- (26) Morganti R., Oosterloo T., Struve C., Saripalli L., 2008, A&A, 485, L5
- (27) O’Dea C.P., 1998, PASP, 110, 493
- (28) Pihlström Y., Conway J., Vermeulen R., 2003, PASA, 20, 62
- (29) Robinson T.G., Tadhunter C.N., Axon D.J., Robinson A., 2000, MNRAS, 317, 922
- (30) Roche N., Eales S.A., 2000, MNRAS, 317, 120
- (31) Saikia D.J., Jamrozy M., 2009, BASI, 37, 63
- (32) Saikia D.J., Gupta N., Konar C., 2007, MNRAS, 375, L31
- (33) Sarma A.P., Troland T.H., Rupen M.P., 2002, ApJ, 564, 696
- (34) Salter C.J., Saikia D.J., Minchin R., Ghosh T., Chandola Y., 2010, ApJ, 715, L117
- (35) Steenbrugge K.C., Blundell K.M., Duffy P., 2008, MNRAS, 388, 1465
- (36) Steenbrugge K.C., Heywood I., Blundell K.M., 2010, MNRAS, 401, 67
- (37) Tadhunter C., Wills K., Morganti R., Oosterloo T., Dickson R., 2001, MNRAS, 327, 227
- (38) Taylor G.B., 1996, ApJ, 470, 394
- (39) Vermeulen R. C., et al. 2003, A&A, 404, 861
- (40) Vermeulen R.C., Labiano A., Barthel P.D., Baum S.A., de Vries W.H., O’Dea C.P., 2006, A&A, 447, 489
- (41) van Langevelde H.J., Pihlström Y.M., Conway J.E., Jaffe W., Schilizzi R.T., 2000, A&A, 354, L45