Correlations between the peak flux density and the position angle of inner-jet in three blazars
Abstract
Aims. We aim to investigate the relation between the long-term flux density and the position angle (PA) evolution of inner-jet in blazars.
Methods. We have carried out the elliptic Gaussian model-fit to the ‘core’ of 50 blazars from 15 GHz VLBA data, and analyzed the variability properties of three blazars from the model-fit results.
Results. Diverse correlations between the long-term peak flux density and the PA evolution of the major axis of the ‘core’ have been found in 20% of the 50 sources. Of them, three typical blazars have been analyzed, which also show quasi-periodic flux variations of a few years (T). The correlation between the peak flux density and the PA of inner-jet is positive for S5 0716+714, and negative for S4 1807+698. The two sources cannot be explained with the ballistic jet models, the non-ballistic models have been analyzed to explain the two sub-luminal blazars. A correlation between the peak flux density and the PA (with a T/4 time lag) of inner-jet is found in [HB89] 1823+568, this correlation can be explained with a ballistic precession jet model. All the explanations are based mainly on the geometric beaming effect; physical flux density variations from the jet base would be considered for more complicated situations in future, which could account for the no or less significance of the correlation between the peak flux density and the PA of inner-jet in the majority blazars of our sample.
Conclusions.
Key Words.:
BL Lacertae objects: individual: S5 0716+714, 3C 371, 4C +56.27 – radio continuum: galaxies – galaxies: jets1 Introduction
Blazars are thought of the extreme of active galactic nuclei (AGNs), which consist of flat-spectrum radio quasars and BL Lac objects. They are variable in almost whole electromagnetic spectrum from radio to gamma-ray. The extreme properties of blazars are mainly attributed to their jets which are pointing closely to our line of sight, according to the unified model of AGN (Urry & Padovani 1995). With very long baseline interferometry (VLBI) – the highest angular resolution to date in astronomy – blazars can be resolved into a bright core and often one-sided jet components in parsec scale or sub-parsec scale (Lister et al. 2009a). In the VLBI scales, the blazar jets frequently show fast outward motions, with an apparent advancing speed of greater than the speed of light – namely super-luminal motion (Rees 1966). This is due to the so-called relativistic Doppler boosting – relativistic beaming effect (e.g. Cohen et al. 2007; Hovatta et al. 2009). Such high flux variability and VLBI structure changes together provide us an effective means to study the inner-jet property and probably the central engine’s property of the blazars in further.
Recently, Britzen et al. (2009) found there seems to be evidence for an apparent stationarity of jet components (with regard to their core separation) with time, in blazar S5 0716+714, while the inner-jet components exhibit strong changes in their position angles. This indicates that the jet components move non-radially (or non-ballistic) with regard to their position angle. These authors attributed such sub-luminal motions to a geometric origin, although the geometric models were not well defined yet. Furthermore, they found that the long-term flux density and the position angle of the jet in 0716+714 show a significant positive correlation. The similar phenomena of the apparent stationarity of jet components with time have also been reported in BL Lac objects S5 1803+784 and PKS 0735+178, by Britzen et al. (2010a, 2010b). From CJF sample (Caltech-Jodrell Bank flat-spectrum sample of radio loud active galaxies), Karouzos et al. (2012) investigated the morphologies and pc-scale jet kinematics of more than 200 sources by using the so-called jet ridge-line method. They found that about a half of the sample show jet widths , with BL Lac jet ridge lines showing significantly larger apparent widths than both quasars and radio galaxies, indicating that the BL Lacs have more significant position angle changes of jets in their evolution.
From the study of AGN jet kinematics both in the 2 cm survey (Kellermann et al. 2004) and in the radio reference frame image database (RRFID), about one-third of well-measured component trajectories are non-radial (Piner et al. 2007). In the MOJAVE (monitoring of jets in active galactic nuclei with VLBA experiments) sample, 166 out of the 526 robust components (32%) show non-radial motions, indicating that non-radial motion is a common feature of the jet flow in blazars (Lister et al. 2009a, 2009b). Three of these non-radial components might be considered inward at the 3 level (Lister et al. 2009b), this could be due to a projection effect of curved jets. With the acceleration measurements of the components of MOJAVE sources, Homan et al. (2009) found the perpendicular accelerations are closely linked with non-radial motions, and about half of the components show ‘non-radial’ motions; but the parallel accelerations are generally larger than the perpendicular accelerations with respect to the component velocities.
To further investigate the relation, which was first discovered in 0716+714 by Britzen et al. (2009), between the long-term flux density and the position angle (PA) evolution of inner-jet in blazars, we model-fitted the ‘core’ components of 50 core-dominated balzars from the MOJAVE data released up to 2011 (Lister et al. 2009a). We aimed at finding more sources which showing correlations between the long-term flux density and the PA evolution of inner-jet. We also analyzed the inner-jet models to explain the typical correlations, if any, in the model-fit results.
2 Model-fit result and analysis
| 1 | 2 | 3 | 4 | 5 | 6 | 7 | 8 | 9 | 10 |
| Source | Peak flux | Major axis | Minor axis | PA of M.A. | Dist. from ref. | PA of comp. | Corr.2&5 | Corr.5&7 | T |
| [Jy/beam] | [mas] | [mas] | [deg] | [mas] | [deg] | [yr] | |||
| 0716+714 | 0.2258/1.4631/3.3709 | 0.11/0.21/0.37 | 0.02/0.05/0.09 | 6.6/20.6/43.0 | 0/0.01/0.09 | -7.3/20.5/50.4 | 0.44(4.6E-4) | 0.62(2.1E-7) | |
| 1807+698 | 0.4826/0.6987/0.9561 | 0.50/0.68/0.91 | 0.09/0.11/0.23 | -110/-105/-99 | 0.04/0.07/0.14 | -112/-104/-97 | -0.45(0.02) | 0.21(0.27) | |
| 1823+568 | 0.5676/1.1359/2.0515 | 0.31/0.40/0.70 | 0.02/0.06/0.13 | -165/-161/-151 | 0.02/0.03/0.08 | -147/-146/-142 | 0.56(1.6E-5)a | 0.29(0.03)a |
2.1 Model-fit to source ‘core’
We selected 50 core-dominated blazars showing one-sided VLBI core-jet and they have been observed with the very long baseline array (VLBA) at 15 GHz in more than 10 years, from the MOJAVE database (Lister et al. 2009a222http://www.physics.purdue.edu/MOJAVE/). We model-fitted the ‘core’ component of each source, with an elliptic Gaussian model in the AIPS task ‘JMFIT’, to get the peak flux density and the PA of the major axis of the Gaussian component, etc. We consider that the ‘core’ in the 15 GHz VLBA images of these core-dominated blazars is the ‘inner-jet’ rather than the true core. Therefore, the inner-jet can be modeled with an elliptic Gaussian component which its major axis is along with the inner-jet orientation or the inner-jet ridge-line on average, thus reflecting the inner-jet PA.
We are interested in the long-term flux density and the PA evolution of the ‘core’ of blazars, 15 GHz MOJAVE datasets are the best because these observations have been spanned over 10 years. With the calibrated visibility of the MOJAVE data we could do the model-fit to whole source structure, however, for the 50 sources with more than 10 epochs of each source we couldn’t complete the multi-components model-fit to all the source structures, as usually did with the modelfit program in the Difmap package. We notice that it is not needed currently to model-fit whole source structure, for that our purpose is studying on average the innermost jet behavior of the sources. An advantage of our approach is that we could get ride of an ambiguity in identifying VLBI components from epoch to epoch which have long been discussed as a potential problem for multi-epoch VLBI observations (see discussions in e.g., Vermeulen et al. 2003; Piner et al. 2007; Britzen et al. 2009). Our approach is similar to that the model-fitting to the ‘core’ of 250 flat spectrum radio sources by Kovalev et al. (2005) with the visibility function.
The solution of the JMFIT in AIPS gives us the peak flux density per beam, the X and Y position of a Gaussian component, the de-convoluted major/minor axis and the PA of the major axis of the Gaussian component. The internal error in the JMFIT is very small. We have done twice the JMFIT for each dataset in order to get a difference as the error of the solution. The final error of each fitting parameter we adopted, is the larger one between the internal fitting error and the difference of the twice fittings.
We have obtained the model-fit results of more than 500 epochs, we here report only for three sources that have shown typical correlations between the long-term flux density and the PA of the major axis of ‘core’. We present the model-fit results for the three sources: namely S5 0716+714, S4 1807+698, and [HB89] 1823+568 in Table 1. The columns give; (1) the source name; (2),(3),(4),(5),(6),(7) the minimum /median /maximum value of peak flux density per beam of elliptic Gaussian component, major axis of the component, minor axis of the component, position angle of the major axis, component position shift from the reference point [0,0], position angle of the component position shift, respectively; (8) linear Pearson correlation coefficient (and significance) between the peak flux density and the position angle of the major axis; (9) linear Pearson correlation coefficient (and significance) between the position angle of major axis and the position angle of component shift; (10) major period of the peak flux variations derived from the power spectrum density analysis.
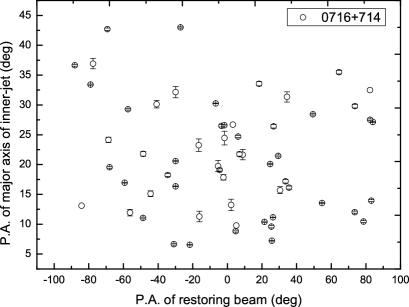
It should be noted that there are no correlations between the parameters of the de-convoluted elliptic Gaussian model from the model-fit and the parameters of the restoring beam of image. For instance, there is no any correlation between the PA of the major axis of the 15 GHz VLBA ‘core’ and the PA of the restoring beam of the 15 GHz VLBA image for 0716+714, as shown in Fig. 1, indicating that the model-fit result is related to the source-intrinsic property rather than related to the restoring beam of image.
2.2 Correlation and PSD analysis
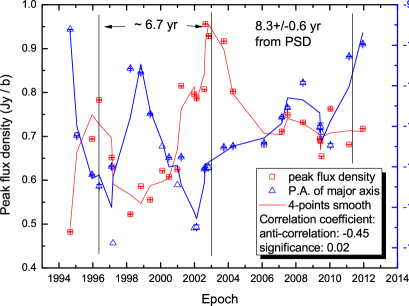
The linear Pearson correlation is analyzed in the model-fit parameters. A diversity of correlations between the long-term peak flux density and the PA evolution of the major axis of the ‘core’ has been found in 20% of 50 sources, including positive correlation, anti-correlation, and correlation with some time delay. There shows the positive, the negative and the time-delayed correlation between the peak flux density and the PA of the major axis for blazars 0716+714, 1807+698 and 1823+568 respectively in Table 1 (also see, Fig. 2, Fig. 3, and Fig. 4). More discussions on the correlations are given in the section 3. However, nearly 80% of the 50 sources have shown no or low significance of correlation between the long-term peak flux and the PA evolution of major axis.
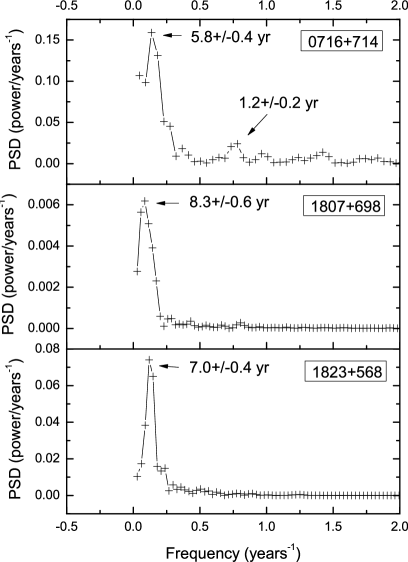
We also analyzed the possible periodicity of the long-term peak flux variations, with the power spectrum density (PSD) method for the three sources. All the three sources show a peak in the PSD plot (Fig. 5), the resulted major periodicity for 0716+714, 1807+698 and 1823+568, is respectively listed in Table 1.
2.3 The three typical sources
2.3.1 S5 0716+714
S5 0716+714 is a well known BL Lac object, with a redshift of 0.31 (Nilsson et al. 2008). The source is variable from radio to gamma-ray (Wagner et al. 1996; Raiteri et al. 2003; Liu et al. 2012; Zhang 2010; Abdo et al. 2010), and it is also a TeV source (Tavecchio et al. 2010). The VLA map at 20 cm shows kpc-scale jets embedded in an oval cocoon (Antonucci et al. 1986). VLBI images exhibit an extremely core-dominated jet pointing to the north and misaligned with the VLA jet by , e.g., at 5 and 8.4/22 GHz (Gabuzda et al. 1998). The 15 GHz MOJAVE images show a bright compact core and a weak jet within 5 mas, with a jet advancing speed of 10 c (Lister et al. 2009b). However, the cross-epoch identification of components is not unique, from some different data Britzen et al. (2009) identified the jet components which are almost stationary respect to the core.
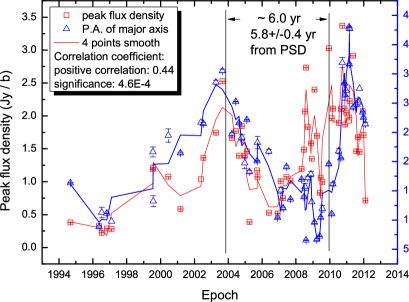
The correlation between the peak flux density and the PA of the major axis of the ‘core’ in 0716+714 is significant (Table 1). Though during the first part of the double-peaks in 2009–2010, the PA is not significantly changed but it does follow the trend of flux density variations (see Fig. 2). From long timescale radio data, a 5.70.5 yr period is reported (Raiteri et al. 2003; Fan et al. 2007). From our model-fit data at 15 GHz, the peak flux density does show a peak in 2003–2004 and double peaks in 2009–2010 (Fig. 2), with an overall periodic flux variations of 5.80.4 yr in the PSD plot (Fig. 5, only data after 2001.0 were used in the PSD, because the VLBA data before 2001.0 are poor). There is also a possible period of 1.20.2 yr in Fig. 5.
2.3.2 S4 1807+698
The source 1807+698 (3C 371, z=0.051) is related to BL Lac objects because of its optical variability and polarization in a large elliptical galaxy whose emission is dominated by the flux from the nucleus (Fan et al. 1999; Katajainen et al. 2000), and it is detected in gamma-ray by Fermi LAT. VLA image at 1.36 GHz shows a kpc scale halo and jets elongated in east-west (Cassaro et al. 1999). VLBI maps reveal a one-sided core-jet at PA , e.g., at 5 GHz (Gómez & Marscher 2000). The jets in the optical with HST and in the X-rays with Chandra have been detected (Pesce et al. 2001), which are roughly aligned with the parsec-scale radio jet. The 15 GHz MOJAVE result shows a sub-luminal jet motion of 0.1 c (Lister et al. 2009b). A 43 GHz VLBA image exhibits a jet flow assembling a wiggling pattern (Lister 2001).
2.3.3 [HB89] 1823+568
The source 1823+568 (4C +56.27, z=0.664), is also a BL Lac object, and it is detected in gamma-ray by Fermi LAT. It shows a halo and one-sided kpc-scale jet to east (Kollgaard et al. 1992). VLA observation at 5 GHz by O’Dea, Barvainis & Challis (1986) shows a curved jet extending southward from the core and turning to the east. The object is highly variable and has a strong linear polarization both in radio and optical bands (Lister 2001). VLBI maps reveal a compact core and jets extending to the south, e.g., at 5 GHz (Fomalont et al. 2000). The 15 GHz MOJAVE result shows a super-luminal jet motion of 20.8 c (Lister et al. 2009b).
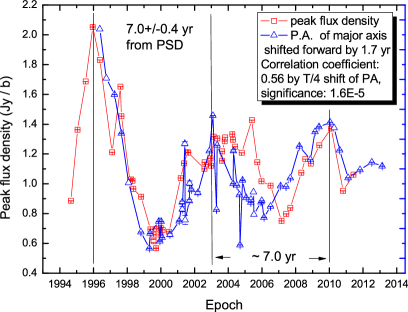
Our model-fit result from the MOJAVE 15 GHz ‘core’, suggests a significant correlation between the peak flux density and the T/4 time-shift-forward PA of the major axis of inner-jet in Table 1. The variability period of T=7.00.4 yr is estimated with the PSD (see, Fig. 4 and Fig. 5).
3 Inner-jet models and discussion
We summarize our findings from the three BL Lac objects. There exhibit diverse correlations between the peak flux density and the PA of the major axis of ‘core’ component in the three sources. They also show quasi-periodic variations of the peak flux density, around a few years.
To explain the correlations and periodicity mentioned above, we have to find the models related to the inner-jet process in the radio loud AGNs. In general, from the literature there are several parameters/factors related to jet models, which should be clarified and clearly defined, e.g., ‘ballistic’ (we define as a single jet component always moving along a straight line once launched from the jet nozzle), ‘non-ballistic’ (we define as a single jet component moving in a curved way), ‘precession’ (this has been confused in the literature, we define it as a precession ‘jet’ in terms of a jet flow (by no means a single jet component), in which every single jet component is ballistically launched from a precession jet-nozzle), ‘non-precession’ (we define as a jet nozzle has no precession). There are four meaningful hybrids of the parameters mentioned above, i.e., ballistic jets with a non-precession nozzle (B+nP), ballistic jets with a precession nozzle (B+P), non-ballistic jets with a non-precession nozzle (nB+nP), non-ballistic jets with a precession nozzle (nB+P). The quasi-periodic changing of the PA of inner-jet in the three sources, could be explained with the hybrid models except the first one (B+nP). A precession of the jet nozzle can be due to e.g., double super-massive black holes or other reasons (see Britzen et al. 2010a and references therein). For the non-ballistic jet, models have been proposed e.g., Gong et al. (2011), also see Lister et al. (2009b) and Britzen et al. (2009, 2010a, 2010b) for discussions. In these models, a non-ballistic motion of jet is largely related to the jet interaction with ambient matter. In the following, we will use the hybrid inner-jet models we classified, for the three sources.
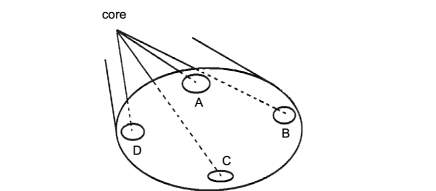
Firstly, we try to apply these models to 1823+568, after analysis below, the B+P model (i.e. ballistic jets with a precession jet nozzle) is applicable to this source, as shown in the schematic diagram of Fig. 6. We are nearly face-on the jet with the estimated jet viewing angle of 8.4°(Savolainen et al. 2009), and the inner-jet PA is oscillating between 151°and 165°(see Table 1 and Fig. 4). In Fig. 6, our line of sight is close to the phase ‘A’ of a precession jet flow. At the phase ‘A’, the relativistic beaming effect is the strongest, so the flux density peaks; on the contrast, the phase ‘C’ of precession jet flow is far from our line of sight, so the flux density is the lowest; at the phase ‘B’ or ‘D’ the flux density has a middle value due to the beaming effect. For the periodic peak flux variations (T7.0 yr in Table 1), and the correlation between the peak flux density and the PA (with a T/4 time-lag) of inner-jet, the precession of the jet flow must be counter-clockwise, i.e. through the phases ‘BADCB’ in Fig. 6. Such that the PA peaks (a minus value) at the phase ‘B’ while the flux density is at a middle level; and the PA has a middle value at the phase ‘A’ while the flux density peaks; and the PA has the smallest (minus) value at the phase ‘D’ while the flux density is at a middle level; and the PA has a middle value at the phase ‘C’ while the flux density is the lowest (also see, Fig. 4). So the correlation between the peak flux density and the PA (with the T/4 time lag) of inner-jet can be well explained. This ‘B+P’ model seems to support the super-luminal motions of 20.8 c (Lister et al. 2009b) or 9.4 c (Savolainen et al. 2009) in this source, because the ballistic motions have generally faster radial speed than that of the non-ballistic motions. The origin of the periodic precession of 7.0 yr in the jet nozzle still needs to be investigated in future.
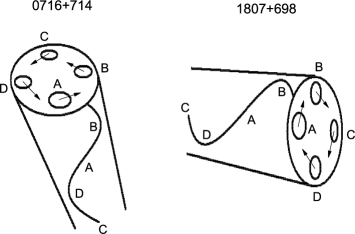
For the source either S5 0716+714 or 1807+698, the correlations between the peak flux density and the PA of inner-jet cannot be explained with a ballistic jet model. For 0716+714, the inner-jet PA is oscillating between 6.6°and 43°(see Table 1 and Fig. 2). We are nearly face-on the jet with the estimated jet viewing angle of 5.3°(Savolainen et al. 2009). The significant positive correlation (Table 1) indicates that the flux density peaks while the PA peaks (i.e. far from North) simultaneously (see Fig. 2), so it is impossible that the jet at the phase ‘A’ in the schematic diagram (Fig. 7 left) has a middle-level of flux density according to the beaming effect within a ballistic model. Non-ballistic jet models have to be invoked, in which a single jet component is moving in a curved way. In the non-ballistic scenario, regardless the jet nozzle is in precession or not, the jet must have a non-radial motion. For 0716+714, in the schematic diagram Fig. 7 (left), for a non-ballistic jet moving along the counter-clockwise helical trajectory ‘ABCD’, i.e. the curved way through which the jet at the phase ‘D’ is pointing the closest to our line of sight, such that the flux density peaks while the PA peaks too. The peak flux density has a middle value while the PA has a middle value too at the phase ‘A’, and so on, the positive correlation between the peak flux density and the PA at other phases ‘B’, ‘C’ can also be explained with the counter-clockwise non-ballistic helical jet model (see Fig.2 and Fig. 7 left). The non-ballistic jet model will lead to a less outward motion speed than that of a ballistic jet model, assuming the originally-launched jet speed is the same. This is consisting with the sub-luminal motion or the ‘stationary scenario’ of 0716+714, as proposed by Britzen et al. (2009). In general, a non-ballistic jet is likely to be formed, through the shocked jet plasma working on the surrounding medium (Gong et al. 2011), and a helical like trajectory of the jet ridge-line would be expected.
For 1807+698, the inner-jet PA is oscillating between 99°and 110°(see Table 1 and Fig. 3). We are not well face-on the jet for the estimated jet viewing angle of 45.3°(Savolainen et al. 2009). A clockwise non-ballistic jet motion can explain the anti-correlation (i.e. a T/2 time lag) between the peak flux density and the PA of inner-jet, i.e. a jet is moving through ‘ABCD’ in Fig. 7 right, the jet through at the ‘D’ is pointing the closest to our line of sight. Such that the flux density peaks due to beaming effect at the ‘D’ while the PA has a smallest (minus) value, and at the phases ‘A’ and ‘C’, both the peak flux density and the PA have middle values, and at the phase ‘B’ the flux density is the lowest while the PA has the largest (minus) value. The source jet is sub-luminal (0.1 c, Lister et al. 2009b), which is the non-ballistic jet model expected. The jet viewing angle of 1807+698 is relatively large (45.3°), so that the beaming effect is reduced. This may have led to the relatively low significance of the correlation between the peak flux density and the PA of inner-jet of this source (see Table 1), and the lower significance of the estimated period of the flux variations.
Among the three sources, the periodicity of flux variability and the correlation between the peak flux density and the T/4-laged PA of inner-jet in 1823+568 is a purely geometric effect according to the ballistic precession jet model ‘B+P’. The quasi-periodicity of flux variability and the correlations between the peak flux density and the PA of inner-jet in 0716+714 and 1807+698, as the non-ballistic models considered above, are also mostly caused by the geometric beaming effect. For the non-ballistic models in particular, however, even if the precession of the jet nozzle is invoked, the repeating periodic flux variability frequently found in blazars still needs to be fully explained. A kind of physical (non-geometric) outburst from the jet nozzle, or a physically periodic flux variations from the jet base would be considered for 0716+714 and 1807+698 in the future, which may be related to perturbations induced by the changes of the accretion mode or by a periodic intervening of a companying object. Multi-bands study of the three blazars on e.g., the SED, is also needed, like that recently being investigated for balzars statistically (see, Meyer et al. 2011; Lister et al. 2011).
4 Summary
We have carried out the elliptic Gaussian model-fit to the ‘core’ of 50 blazars. Diverse correlations between the long-term peak flux density and the PA evolution of the major axis of the ‘core’ have been found in 20% of the 50 sources. Of them, three typical blazars have been analyzed, which also show quasi-periodic flux variations of a few years (T). The correlation between the peak flux density and the PA of inner-jet is positive for 0716+714, and negative for 1807+698. The two sources cannot be explained with the ballistic jet models, the non-ballistic models have been analyzed to explain the two sub-luminal blazars. A correlation between the peak flux density and the PA (with a T/4 time lag) of inner-jet is found in 1823+568, this correlation can be explained by a ballistic precession jet model. All the explanations are based mainly on the geometric beaming effect; physical flux density variations from the jet base would be considered for more complicated situations in future, which could account for the no or less significance of the correlation between the peak flux density and the PA of inner-jet in the majority blazars of our sample.
Acknowledgements.
We thank the reviewer Junhui Fan and also Matthew L. Lister for helpful comments and suggestions on the manuscript, which have improved the paper. This research has made use of data from the MOJAVE database that is maintained by the MOJAVE team (Lister et al., 2009, AJ, 137, 3718). This research has made use of the NASA/IPAC Extragalactic Database (NED) which is operated by the Jet Propulsion Laboratory, California Institute of Technology, under contract with the National Aeronautics and Space Administration. The work is supported by the National Natural Science Foundation of China (Grant No.11073036) and the 973 Program of China (2009CB824800).References
- (1) Abdo, A. A., Ackermann, M., Ajello, M., et al. 2010, ApJ, 722, 520
- (2) Antonucci, R. R. J., Hickson, P., Olszewski, & E. W., Miller, J. S. 1986, AJ, 92, 1
- (3) Britzen, S., Kudryavtseva, N. A., Witzel, A., et al. 2010a, A&A, 511, A57
- (4) Britzen, S., Witzel, A., Gong, B. P., et al. 2010b, A&A, 515, A105
- (5) Brizten, S., Kam, V. A., Witzel, A., et al. 2009, A&A, 508, 1205
- (6) Cassaro, P., Stanghellini, C., Bondi, M., et al. 1999, A&AS, 139, 601
- (7) Cohen, M. H., Lister, M. L., Homan, D. C., et al. 2007, ApJ, 658, 232
- (8) Fan, J. H., Liu, Y., Yuan, H. Y., et al. 2007, A&A, 462, 547
- (9) Fan, J. H., Xie, G. Z., & Bacon, R. 1999, A&AS, 136, 13
- (10) Fomalont, E. B., Frey, S., Paragi, Z., et al. 2000, ApJS, 131, 95
- (11) Gabuzda, D. C., Kovalev, Y. Y., Krichbaum, T. P., et al. 1998, A&A, 333, 445
- (12) Gong, B., Kong, S. W., Xue, F., Li, Y., & Huang, Y. F. 2011, MNRAS, 418, 2451
- (13) Gómez, J.-L. & Marscher, A. P. 2000, ApJ, 530, 245
- (14) Homan, D. C., Kadler, M., Kellermann, K. I., et al. 2009, ApJ, 706, 1253
- (15) Hovatta, T., Valtaoja, E., Tornikoski, M., & Lahteenmaki, A. 2009, A&A, 494, 527
- (16) Katajainen, S., Takalo, L. O., Sillanpää, A., et al. 2000, A&AS, 143, 357
- (17) Karouzos, M., Britzen, S., Witzel, A., Zensus, J. A. & Eckart, A. 2012, A&A, 537, A112
- (18) Kellermann, K. I., Lister, M. L., Homan, D. C., et al. 2004, ApJ, 609, 539
- (19) Kollgaard, R. I., Wardle, J. F. C., Roberts, D. H., & Gabuzda, D. C. 1992, AJ, 104, 1687
- (20) Kovalev, Y. Y., Kellermann, K. I., Lister, M. L., et al. 2005, AJ, 130, 2473
- (21) Lister, M. L., Aller, M., Aller, H., et al. 2011, ApJ, 742, 27
- (22) Lister, M. L., Aller, H. D., Aller, M. F., et al. 2009a, AJ, 137, 3718
- (23) Lister, M. L., Cohen, M. H., Homan, D. C., et al. 2009b, AJ, 138, 1874
- (24) Lister, M. L. 2001, ApJ, 562, 208
- (25) Liu, X., Song, H.-G., Marchili, N., et al. 2012, A&A, 543, A78
- (26) Meyer, E. T., Fossati, G., Georganopoulos, M., & Lister, M. L. 2011, ApJ, 740, 98
- (27) Nilsson, K., Pursimo, T., Sillanpää, A., et al. 2008, A&A, 487, L29
- (28) O’Dea, C. P., Barvainis, R. & Challis, P. 1986, IAUS, 119, 217
- (29) Pesce, J. E., Sambruna, R. M., Tavecchio, F., et al. 2001, ApJ, 556, L79
- (30) Piner, B. G., Mahmud, M., Fey, A. L., & Gospodinova, K. 2007, AJ, 133, 2357
- (31) Raiteri, C. M., Villata, M., Tosti, G., et al. 2003, A&A, 402, 151
- (32) Rees, M. J. 1966, Nature, 211, 468
- (33) Savolainen, T., Homan, D. C., Hovatta, T., et al. 2010, A&A, 512, A24
- (34) Tavecchio, F., Ghisellini, G., Ghirlanda, G., Foschini, L., & Maraschi, L. 2010, MNRAS, 401, 1570
- (35) Urry, C. M., & Padovani, P. 1995, PASP, 107, 803
- (36) Vermeulen, R. C., Ros, E., Kellermann, K. I., et al. 2003, A&A, 401, 113
- (37) Wagner, S. J., Witzel, A., Heidt, J., et al. 1996, AJ, 111, 2187
- (38) Zhang, Y.-H. 2010, ApJ, 713, 180