Received on XXXXX; revised on XXXXX; accepted on XXXXX
Associate Editor: XXXXXXX
Context-specific transcriptional regulatory network inference from global gene expression maps using double two-way t-tests
Abstract
1 Motivation:
Transcriptional regulatory network inference methods have been studied for years. Most of them relie on complex mathematical and algorithmic concepts, making them hard to adapt, re-implement or integrate with other methods. To address this problem, we introduce a novel method based on a minimal statistical model for observing transcriptional regulatory interactions in noisy expression data, which is conceptually simple, easy to implement and integrate in any statistical software environment, and equally well performing as existing methods.
2 Results:
We developed a method to infer regulatory interactions based on a model where transcription factors (TFs) and their targets are both differentially expressed in a gene-specific, critical sample contrast, as measured by repeated two-way -tests. Benchmarking on standard E. coli and yeast reference datasets showed that this method performs equally well as the best existing methods. Analysis of the predicted interactions suggested that it works best to infer context-specific TF-target interactions which only co-express locally. We confirmed this hypothesis on a dataset of more than 1,000 normal human tissue samples, where we found that our method predicts highly tissue-specific and functionally relevant interactions, whereas a global co-expression method only associates general TFs to non-specific biological processes.
3 Availability:
A software tool called TwixTrix is available from http://twixtrix.googlecode.com.
4 Supplementary information
Supplementary Material is available from http://www.roslin.ed.ac.uk/supplementary-data.
5 Contact:
tom.michoel@roslin.ed.ac.uktom.michoel@roslin.ed.ac.uk
6 Introduction
Transcriptional regulatory networks, which emerge from the combinatorial regulation of the expression of all genes in an organism by a limited number of transcription factors (TFs), control the cellular response to internal and external perturbations. At present, direct experimental mapping of complete transcriptional regulatory networks remains infeasible, particularly in higher organisms, especially since the structure of these networks is itself condition-dependent (Harbison et al., 2004; Luscombe et al., 2004). A lot of attention has therefore been devoted to computationally reconstruct transcriptional regulatory networks from compendia of genome-wide gene expression measurements in diverse conditions, time points, cell types or genotypic backgrounds (Friedman, 2004; Zhu et al., 2004; Bansal et al., 2007). However, despite many years of research, it still remains a question which computational methods are most suited to tackle this problem. Moreover, regulatory network inference remains a task firmly in the hands of specialists, and network inference algorithms are still not routinely included in standard statistical software packages, unlike for instance differential expression testing or co-expression analysis. At least in part this is due to the fact that most network reconstruction methods depend on non-trivial mathematical concepts such as mutual information (Margolin et al., 2006; Faith et al., 2007), differential equations (Bonneau et al., 2006), biophysical models (Bussemaker et al., 2007), Bayesian networks (Segal et al., 2003; Friedman, 2004; Zhu et al., 2004; Joshi et al., 2009), ensemble methods (Joshi et al., 2009) or machine learning (Huynh-Thu et al., 2010). While these complex mathematical models are well justified in theory, current gene expression datasets have high levels of noise and are lacking in resolution, making these models prone to over-fitting. Furthermore, the resulting algorithms are difficult if not impossible to re-implement, as they often depend on poorly documented parameter choices and heuristic techniques, for instance to improve convergence rates or avoid local optima.
In order to address these problems, we propose a novel method which is based on a minimal statistical model. The model assumes that TFs and their targets are both differentially expressed in a gene-specific sample contrast, but it makes no assumption on any functional relationship, be it linear or non-linear, between the gene expression profiles of TFs and their targets. It should thus be ideally suited to infer regulatory interactions from noisy, low-resolution gene expression maps. First, the method identifies for each gene its critical contrast, the separation of samples into two sets across which that gene is most significantly differentially expressed (as determined by two-way -tests). Secondly, the method takes a list of TFs or other regulatory proteins, and calculates their differential expression in the critical contrast of each possible target gene (again determined by two-way -tests). The predicted network is the list of TF-gene associations, ranked by these -test -values, either considered as a weighted network or cut off at a desired significance threshold.
The idea to use -tests to predict regulatory interactions was first proposed by Qi et al. (2011). Here, we systematically evaluate the performance of this double two-way -test procedure using benchmark expression data (Faith et al., 2007; Gasch et al., 2000) and networks of known transcriptional regulatory interactions (Gama-Castro et al., 2008; Monteiro et al., 2008) in E. coli and yeast, following standard evaluation protocols established by the DREAM community (Prill et al., 2010). We found that double two-way -testing performs as well as the best current methods, especially in yeast. Next we compared the top-ranked predictions of each method and found that the -test procedure identifies a considerably different set of interactions than the other methods. In particular, whereas the top-ranked predictions of the other methods tend to exhibit high levels of global co-expression between the TFs and their predicted targets, interactions found by the -test procedure tend to only co-express locally and involve TFs that are only expressed under certain experimental conditions.
We therefore hypothesized that the double two-way -test method is particularly useful to predict context-specific networks in multi-cellular organisms. To test this hypothesis we applied it to a global gene expression compendium containing more than 1,000 samples from normal human tissues (Lukk et al., 2010). Although due to a lack of knowledge in human, a systematic evaluation of the predicted network is impossible, manual analysis of the top-ranked TFs showed that the functional enrichment of their predicted targets is indeed highly consistent with known cell-type specific modes of action for these TFs.
7 Methods
7.1 Critical contrast determination
The first step of the double two-way -test procedure consists of determining the critical contrast for each gene in a gene expression data matrix. The differential expression of a gene in a partition of the set of samples in two distinct sets can be determined by the ordinary -statistic,
| (1) |
where and are the means of the expression values of gene in and , respectively, and similarly, and and and denote the standard deviations and the numbers of conditions in and , respectively. The critical contrast of is defined as the partition with highest value of . An ordered partition is defined as a partition where all expression values in are smaller than all expression values in , i.e., . For any non-ordered partition, we can create an ordered one with the same and by repeatedly swapping and . It is not hard to see that the -statistic for this ordered partition must be higher than for the original non-ordered partition. Hence the critical contrast can be determined by taking the maximum over all ordered partitions, of which there are only per gene, where is the total number of samples in the dataset. A minimal number of samples on each side of the partition can be set, although the factor in eq. (1) ensures that the critical contrast will automatically be balanced (see Supplementary Material for details).
7.2 Scoring of regulatory interactions
Given a list of candidate transcription factors or other regulators and a critical contrast for all possible target genes, we define the interaction score between a TF and target gene as the -statistic of in the critical contrast of . The higher , the more confident we are about the predicted regulatory interaction . A confidence -value can be computed from using a Student’s -distribution with degrees of freedom, where is the total number of samples in the dataset.
7.3 Moderated -statistics and background correction
Some transformations of the interaction score are worthwile to consider. Firstly, because for each gene , the differential expression of a relatively large number of TFs is tested in the same critical contrast , while we expect only few of these TFs to have signifcantly high differential expression, moderated -statistics can be used (Smyth, 2004, 2005) to provide a more stable inference in datasets with a limited number of samples. Secondly, to make the interaction scores better comparable between genes with potentially very different critical contrasts, we can apply a background correction defined as
| (2) |
where is the ordinary or moderated -statistic interaction score, and and are the mean and standard deviation of over all TFs for a given gene , respectively. Finally, we can also compute the -statistic of a target gene in the critical contrast of TF and define a symmetric score .
7.4 Algorithm implementation
A software tool called TwixTrix is available from our website, providing two implementations of the double two-way -test procedure. The first implementation (in R) uses the Limma package (Smyth, 2005) to calculate moderated -statistics and background corrected interaction scores and is recommended for datasets with a small number of samples. The second implementation (in R or Matlab) encodes the critical contrast determination and interaction scoring using ordinary -statistics purely as matrix operations. It is ultra-fast and recommended for datasets with a large number of samples.
7.5 Comparison with other network inference methods
We downloaded the latest versions of Inferelator (Bonneau et al., 2006), CLR (Faith et al., 2007), LeMoNe (Joshi et al., 2009) and GENIE3 (Huynh-Thu et al., 2010) from their respective homepages and ran them with default settings. For LeMoNe and Inferelator, which are module network inference algorithms, we assigned each gene to a singleton module to obtain a TF-gene regulatory network. As a baseline, we also reconstructed networks based on the Pearson and Spearman correlations. All methods considered provide a ranked list of predicted regulatory interactions. Keeping the first interactions, recall and precision are defined as
where is the number of true positives, i.e. the number of known interactions, among the first predictions and is the total number of known interactions. The area under the recall-precision curve (AUC) provides a measure for the performance of each method, see (Prill et al., 2010) for details.
7.6 Gene expression data and reference regulatory networks
We tested our method on datasets for E. coli, yeast and human. The E. coli dataset (Faith et al., 2007) contains expression values for 4345 genes under 189 conditions. We considered the same 316 candidate regulators and 1882 differentially expressed genes (sd0.5) as Michoel et al. (2009). Results were evaluated using the reference network of RegulonDB (Gama-Castro et al., 2008). The yeast stress dataset measures the budding yeast’s response to a panel of diverse environmental stresses (Gasch et al., 2000). We used the same list of 321 candidate regulators and 2355 differentially expressed genes as Segal et al. (2003). Results were evaluated using the reference network of YEASTRACT (Monteiro et al., 2008). The human dataset dataset consists of 5,372 samples (Lukk et al., 2010), from which we selected 1033 samples measuring gene expression in 67 diverse tissues under normal conditions. We reconstructed networks using a list of 941 candidate transcription factors from TcoF (Schaefer et al., 2010) and 12,568 differentially expressed genes (sd0.5).
8 Results and Discussion
8.1 Benchmarking on E. coli and yeast datasets
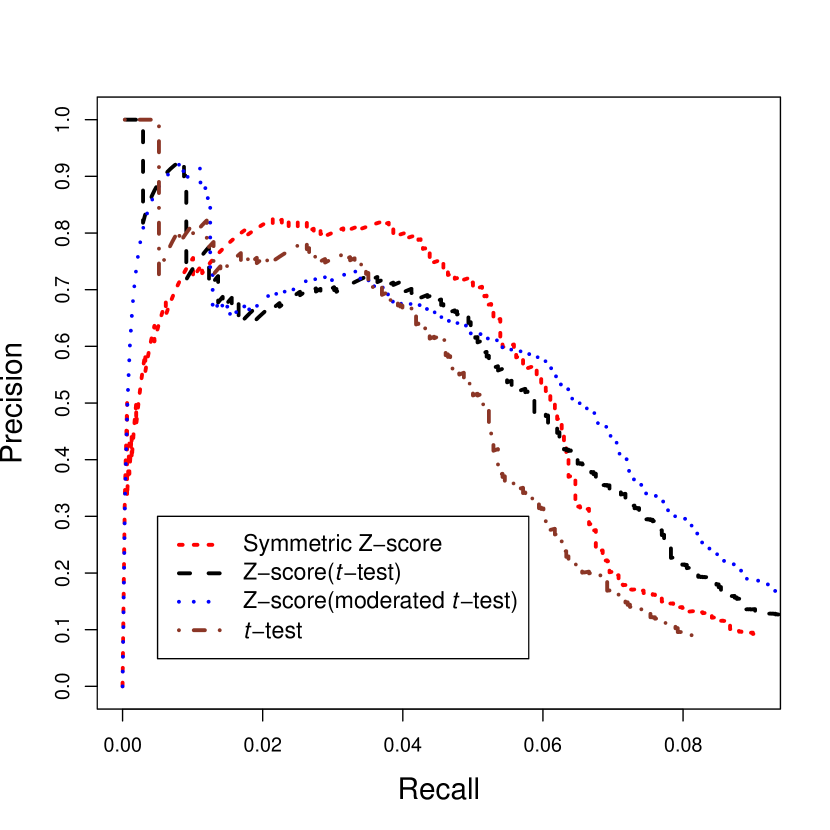
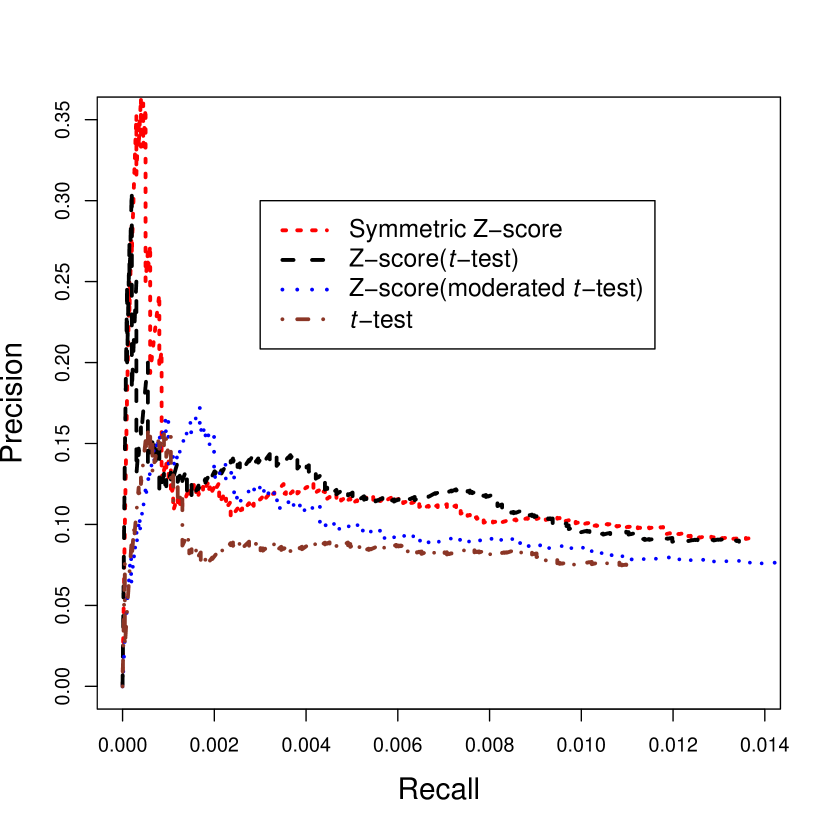
To benchmark the double two-way -test procedure, we analysed its performance on standard E. coli and yeast datasets, by calculating recall vs. precision curves based on the top 3000 predicted interactions (see Methods for details). In Figure 1 and 2, we compared different versions of double two-way -test interaction scores, namely the -statistic of a TF in the critical contrast of a gene , the background corrected score (eq. (2)) for the ordinary -statistic and one for the moderated -statistic, and a symmetrized background corrected score for the ordinary -statistic (cf. Methods section 7.3). Although the symmetrized version works slightly better in yeast, this is not the case in E. coli. In order not to overfit for a specific dataset, we choose the unsymmetric background corrected score for the ordinary -statistic (cf. eq. (2)) as the default score, because it performs well in both datasets and is conceptually the simplest and fastest to compute. All results reported in the remainder of this paper refer to this interaction score.
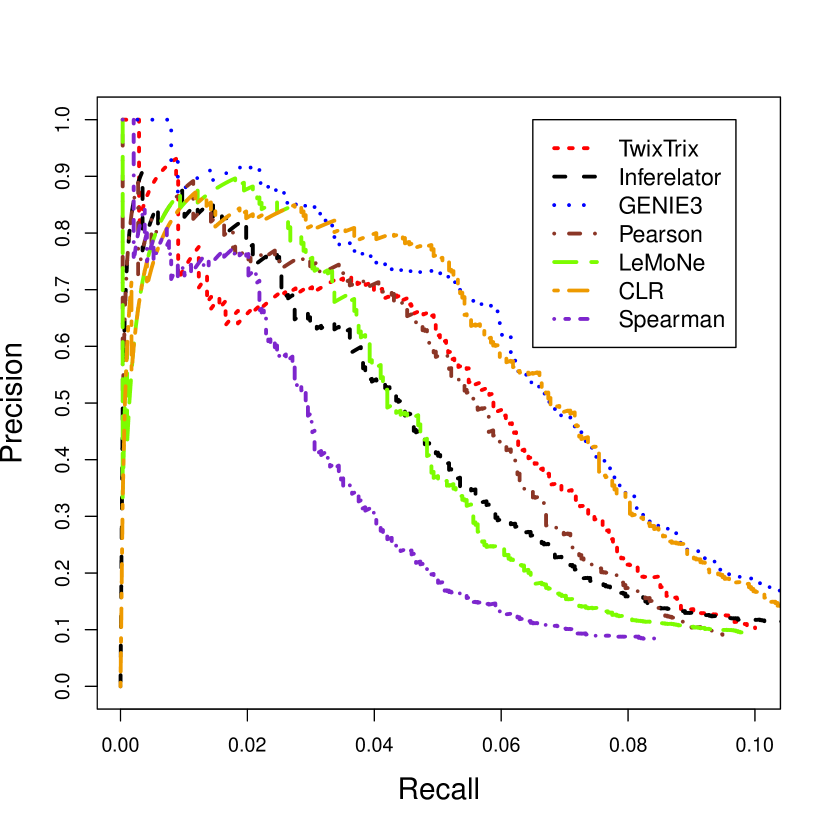
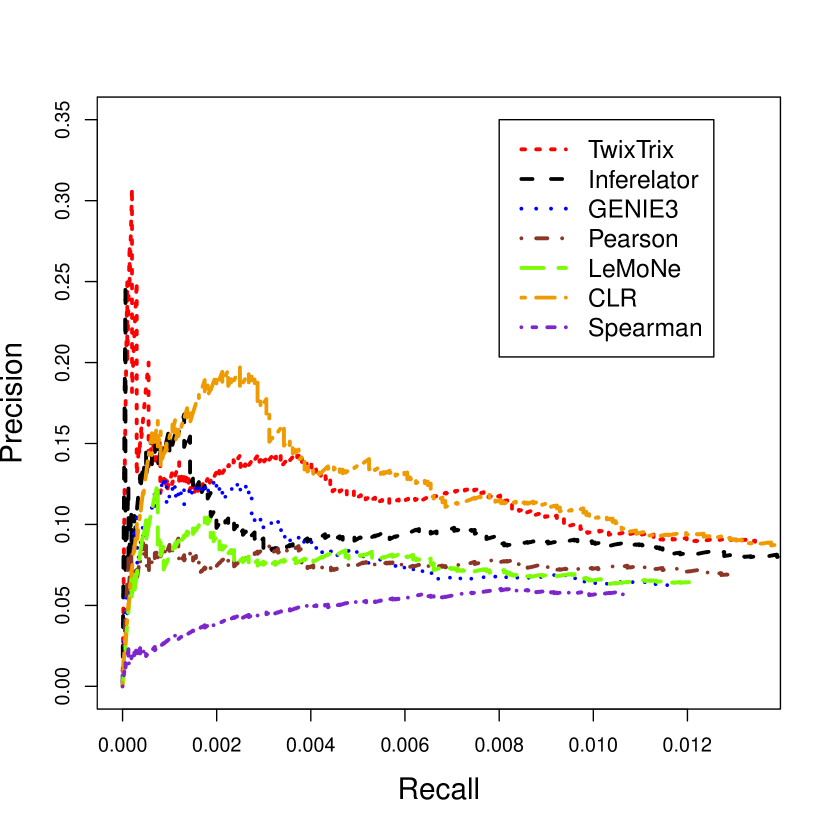
Next we compared the double two-way -test procedure against six other methods on the E. coli and yeast datasets, again calculating recall vs. precision curves based on the top 3000 predicted interactions by each method (Figure 3 and 4). As has been observed before (Michoel et al., 2009), overall performance in yeast compared to E. coli is lower for all methods. This may be due to more complex regulatory mechanisms in eukaryotes vs. prokaryotes, a less accurate reference network against which performance is measured or, most likely, a combination of these two. Most importantly, neither of the algorithms is better than all the others in both organisms (cf. Table 1). TwixTrix, our implementation of the double two-way -test algorithm, performs equally good as the much more complicated algorithms, especially in yeast where it is ranked second best. Also noteworthy is the fact that in E. coli, but not in yeast, regulatory interaction prediction based on the Pearson correlation between TFs and putative target genes also performs similarly well as the other methods. This suggests that, generally speaking, TFs and their targets tend to be globally co-expressed in prokaryotes and the real challenge is to predict regulatory networks in eukaryotes.
| E. coli | Yeast | |
|---|---|---|
| TwixTrix | 0.05182 | 0.00157 |
| Inferelator | 0.04624 | 0.00140 |
| GENIE3 | 0.06767 | 0.00097 |
| LeMoNe | 0.04415 | 0.00091 |
| CLR | 0.06269 | 0.00190 |
| Pearson | 0.05003 | 0.00097 |
| Spearman | 0.03157 | 0.00052 |
8.2 TwixTrix identifies context-specific interactions
An important recent insight has been that different network inference strategies identify different aspects of a regulatory system. Understanding how a method differs from others has therefore become more important than simple recall-precision measurements, with the eventual goal to build meta-networks which integrate predictions from diverse computational methods (Michoel et al., 2009; Marbach et al., 2010). Here we focused on characterizing TwixTrix-predicted interactions in yeast, where it is most successful relative to the other methods. The corresponding figures for E. coli can be found in the Supplementary Material.
First we compared the overall similarity of interactions predicted by each method. The overlap (measured as the number of common interactions among the top 500 predicted interactions) ranges from 31 to 232 common interactions. TwixTrix shares between 31 (with Spearman correlation) and 144 (with LeMoNe) interactions with the other methods. Using the number of non-overlapping interactions as a distance measure, the relative similarities between each of the seven network inference methods is visualised in Figure 5. As expected, the networks based on Pearson and Spearman correlation are most similar. GENIE3 (Huynh-Thu et al., 2010) and LeMoNe (Joshi et al., 2009) both use decision trees to assign regulators to target genes and consequently predict similar networks as well. TwixTrix, CLR and Inferelator each occupy a more unique position in the network inference landscape.
Since TwixTrix is based on differential expression testing, we hypothesized that it tends to identify TF-target interactions which do not necessarily co-express under all conditions. Figure 6 shows the distribution of Pearson correlations between TFs and their predicted targets for the top 500 interactions in yeast for each method. Interactions predicted by TwixTrix indeed have significantly lower Pearson correlations than interactions predicted by the other methods. GENIE3, Inferelator and LeMoNe, which perform less well in yeast than TwixTrix and CLR, are especially biased towards inferring interactions which co-express under most conditions in the dataset.


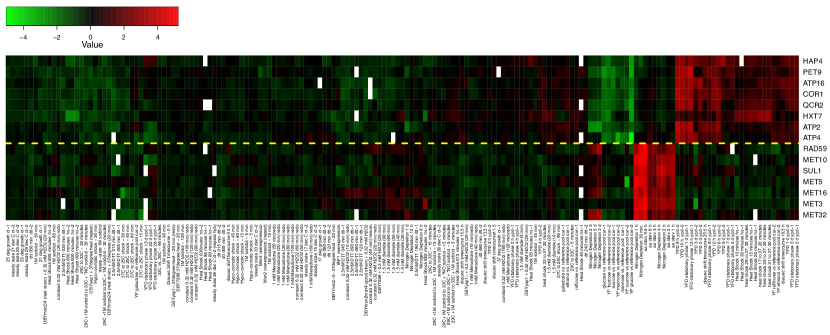
A simple example illustrates the difference between context-specific and global interactions. MET32 is a transcription factor involved in the regulation of methionine (an amino acid) biosynthesis. It has 30 predicted targets in the top 500 network of TwixTrix, of which 9 are known targets, which are strongly enriched for amino acid biosynthesis genes (hypergeometric after multiple testing correction). The interactions predicted for MET32 are among the highest scoring by the double two-way -test, yet their global Pearson correlation is only 0.64 on average. As shown in Figure 7, MET32 and its targets are only expressed under amino acid starvation and nitrogen depletion, resulting in a strong signal upon differential expression testing despite weak global correlation. The opposite situation happens for HAP4, a transcriptional activator and global regulator of respiratory gene expression. HAP4 has 14 predicted targets in the top 500 network of TwixTrix, of which 11 are known targets, which are strongly enriched for cell death and oxidative phosphorylation (hypergeometric after multiple testing correction). Despite a higher global co-expression between HAP4 and its predicted targets (average Pearson correlation 0.73), the -test scores are relatively low (only two predicted interactions in the top 100). In contrast, for GENIE3, Inferelator and LeMoNe, which all favor highly co-expressed interactions (cf. Figure 6), the HAP4 predictions are all among the highest scoring true positive interactions (respectively 4, 7 and 4 true positives in the top 10 predictions). Figure 7 shows that HAP4 and its targets are all highly expressed under YPD stationary phase and heat shock conditions, while they are under expressed in glucose conditions. This results in a strong global, but weaker condition-specific signal.
8.3 Tissue-specific network inference from a human gene expression atlas
While the ability to detect context-specific interactions in yeast is important, the dataset consisted of samples for altogether ten different experimental conditions (Gasch et al., 2000), making the distinction between condition-specific and global interactions somewhat arbitrary. In contrast, global gene expression maps in mammalian systems can consist of hundreds of different cell and tissue types, developmental stages, or disease states (Lukk et al., 2010). To test TwixTrix in such a setting, we applied it to a large dataset of more than 1,000 samples from 67 normal human tissues (Lukk et al., 2010, see Methods for details).
Because there exists no comprehensive reference database against which an inferred transcriptional regulatory network can be validated in human, we manually analysed the top-ranking transcription factors and computed the functional enrichment of their targets in the top 10,000 TwixTrix-interactions (Table 2). In all cases, the TFs are expressed only in a very small set of samples from specific tissues, which are highly consistent with the most enriched GO term among their targets. This supports the hypothesis that double two-way -testing is indeed well-suited to predict tissue-specific gene regulatory networks.
| Regulator | Description of Regulator | Context | Enriched GO Term | -value | |||
|---|---|---|---|---|---|---|---|
| GCM1 | The placental transcription factor glial cell missing 1 (GCM1) regulates expression of syncytin-1 and -2 fusogenic proteins (Chang et al., 2011). | Placenta basal plate samples | 73 | 64 | 20 | Female pregnancy | 5.94E-22 |
| KLF1 | This gene encodes a hematopoietic-specific transcription factor that induces high-level expression of adult beta-globin and other erythroid genes (Perseu et al., 2011). | Blood, bone, and fetal blood samples | 21 | 20 | 3 | Regulation of symbiosis, encompassing mutualism through parasitism | 2.36E-4 |
| MYT1L | Myelin transcription factor 1-like (MYT1L) is a member of the myelin transcription factor 1 and plays a role in the development of the nervous system (Wang et al., 2010). | Brain related samples | 482 | 421 | 95 | Transmission of nerve impulse | 8.28E-42 |
| MYF6 | The protein encoded by this gene is a probable basic helix-loop-helix (bHLH) DNA binding protein involved in muscle differentiation (Braun et al., 1990). | Bone, quadriceps muscle, skeletal muscle, and vastus lateralis samples | 45 | 42 | 24 | Muscle system process | 6.14E-30 |
| NR1I2 | NR1I2 plays a central role in regulating liver and gastrointestinal drug metabolism (Wang et al., 2011). | Small intestine samples | 44 | 40 | 6 | Digestion | 7.43E-5 |
| NR5A2 | NR5A2 is expressed primarily in liver, intestine, and pancreas, where it regulates expression of proteins maintaining cholesterol homeostasis (Benod et al., 2011). | Kidney samples | 41 | 37 | 5 | Drug metabolic process | 3.17E-6 |
| PAX2 | Mutations within PAX2 have been shown to result in optic nerve colobomas and renal hypoplasia (Karafin et al., 2011). | Kidney samples | 68 | 67 | 19 | Organic acid metabolic process | 2.50E-6 |
| PAX9 | PAX9 may involve development of stratified squamous epithelia as well as various organs and skeletal elements (NCBI). | Esophagus, hypopharynx, oropharynx, and tonsil samples | 52 | 46 | 16 | Epidermis development | 5.71E-16 |
| PITX1 | PITX1 may involve development of oral cancer (Libório et al., 2011). | Esophagus, hypopharynx, oropharynx, and tonsil samples | 76 | 69 | 16 | Epidermis development | 5.71E-16 |
| TBX5 | TBX5 may play a role in heart development and specification of limb identity (Sotoodehnia et al., 2011). | Atrial myocardium and cardiac ventricle samples | 91 | 87 | 29 | Muscle contraction | 9.75E-29 |
| NANOG | Nanog is a core factor that is required for the maintenance of embryonic stem (ES) cell pluripotency and self-renewal (Das et al., 2011). | Human universal reference and kidney samples | 41 | 34 | 12 | Response to wounding | 5.15E-4 |
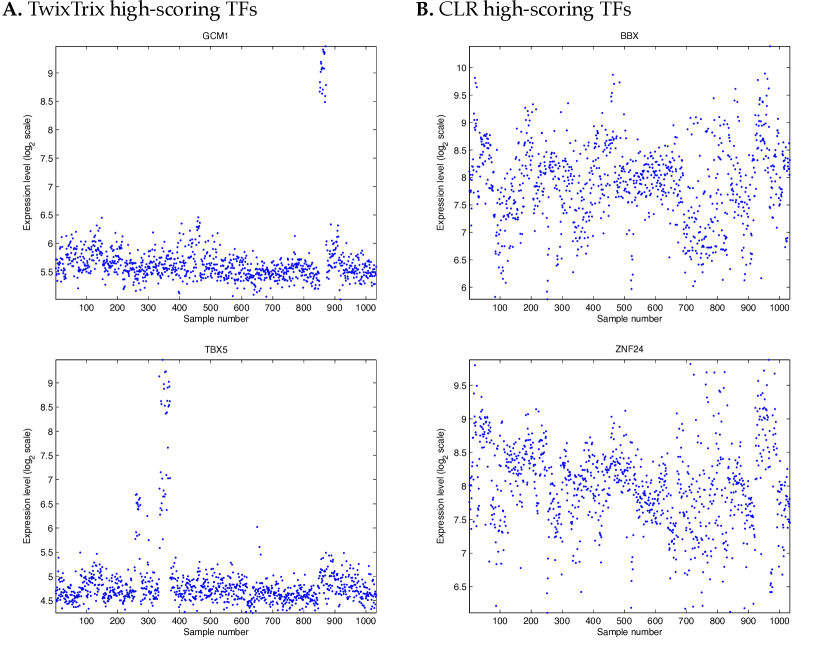
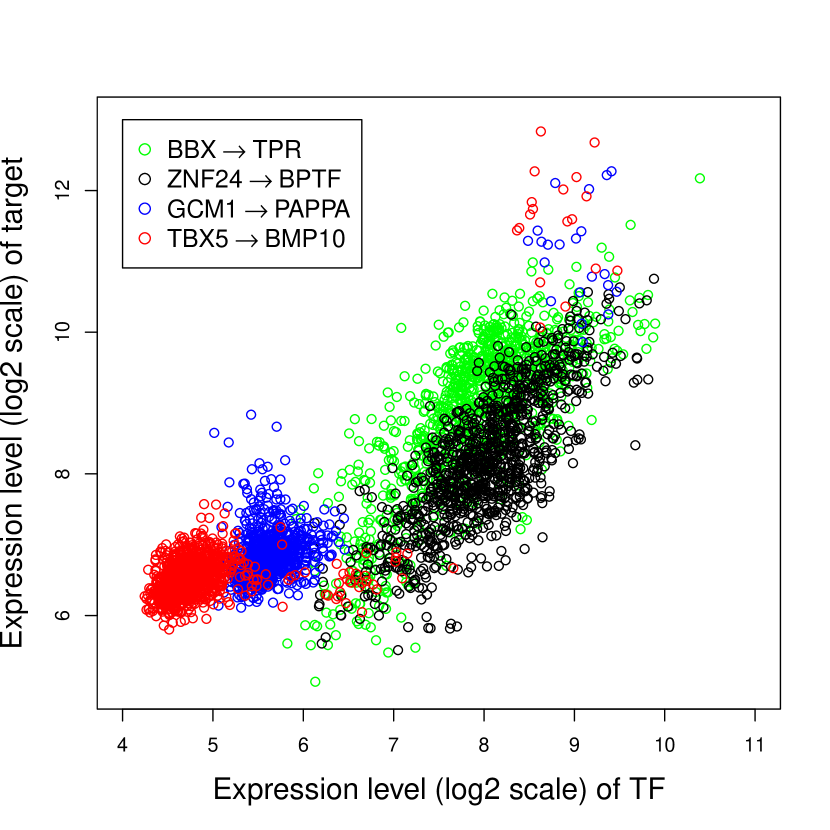
As expected, the different characteristics observed in yeast between TwixTrix and the other, more globally oriented methods become much more pronounced in the human dataset. Figure 8A shows the expression profiles across all samples for two representative TFs from Table 2. GCM1 is a TF necessary for placental development. It and its predicted targets (see high-resolution heatmap in Supplementary Material) are highly expressed in placental samples (Figure 8A, top). Likewise, TBX5, a TF with a role in heart development, and its predicted targets (see high-resolution heatmap in Supplementary Material) are highly expressed in samples from the heart (Figure 8A, bottom). For both TFs, we took a representative high-scoring target and created a scatter plot of their respective expression levels (Figure 9, blue and red points). These TF-target relations have a well-defined tissue-specific off/on behavior. These highly tissue-specific co-expression signals result in very significant -test scores. However, because of the noisy low-level expression in all the other samples, such a signal cannot be detected by global co-expression methods. In contrast, Figure 8B shows the expression profiles across all samples for two representative high-scoring TFs in the CLR network. Both have a characteristic profile which fluctuates across different tissue types. BBX (Figure 8B, top) is a TF necessary for cell cycle progression from G1 to S phase and ZNF24 (Figure 8B, bottom) is a TF involved in promoting the cell cycle in the developing central nervous system. For both of them, their CLR-predicted target sets (see high-resolution heatmaps in Supplementary Material), though highly co-expressed across most samples, are only enriched for non-specific functional categories such as regulation of gene expression or metabolic process. A scatter plot of TF-target expression levels for a representative target for both TFs confirms that they show a high linear correlation across most samples (Figure 9, green and black points). CLR predictions thus clearly represent general processes which are globally co-expressed and not confined to a single tissue or cell type.
GENIE3, Inferelator and LeMoNe could not be applied with reasonable runtime on the complete human dataset. We therefore reduced the size of the dataset by averaging samples from the same tissue type. Results on this reduced dataset confirmed that all methods except TwixTrix give highest rank to globally co-expressed TF-target pairs involved in general cellular processes, although the relation between the expression of TFs and their predicted targets tends to be more non-linear for GENIE3 and LeMoNe than for CLR and Inferelator (see Supplementary Material for details, including a runtime comparison between all algorithms). As a particular example of non-tissue-specific interactions, GENIE3 and LeMoNe predict 35 and 36 targets, respectively, among their top 200 predictions for the TF FOXM1, which are strongly enriched for M phase () and mitotic cell cycle (), respectively. FOXM1 is a transcriptional activator involved in cell proliferation which is indeed known to regulate the expression of several cell cycle genes.
9 Conclusion
Reconstructing transcriptional regulatory networks from genome-wide gene expression data remains an important bioinformatics challenge. Although diverse mathematical and computational methods have been proposed to address this problem, they have not been as successful as might originally have been expected. A possible reason is that current gene expression datasets are too noisy and lack the resolution for adequately fitting complex mathematical models. Here we analysed a method which, rather than adding to the complexity of network inference methods, uses a minimal statistical model for associating transcription factors to putative target genes without assuming any linear or non-linear functional relationship between their expression profiles. The method is based on a double two-way -test which assesses the differential expression of a TF in the critical sample contrast of all genes. Essentially, this results in a local co-expression measure which appears well-suited to capture context-specific transcriptional activity, at the expense of giving less weight to globally co-expressed TF-target pairs.
In bacteria, much of the cellular response to perturbations is controlled at transcriptional level only, such that many TF-target pairs are co-expressed under all experimental conditions. Here the double two-way -test therefore does not improve upon existing methods. In yeast however, there is evidence of known transcriptional interactions which only co-express under specific conditions. The -test procedure prioritizes such interactions and indeed performs better in yeast than E. coli, relative to the existing methods.
Taking this one step further, we hypothesize that the double two-way -test method for inferring regulatory interactions will be particularly useful to analyse global gene expression maps in multi-cellular organisms which combine data from hundreds of different samples. Indeed we confirmed that our method predicts highly tissue-specific and functionally relevant interactions from a dataset of more than 1,000 normal human tissue samples, whereas global co-expression methods only associate general TFs to non-specific biological processes.
In view of the time it takes to experimentally generate large expression compendia, judging a network inference method by its running time is perhaps not very relevant. Nevertheless we note that, depending on hardware details, the -test procedure took not more than a few seconds to analyse the human dataset, while the other methods needed from a few hours upto several days. Having a fast method is clearly beneficial, e.g. to easily compare results from different normalizations of the data, or from different subsets of a large data compendium, e.g. from normal vs. disease states, cell lines vs. tissue samples, etc.
In summary, we believe that the double two-way -test method provides a useful addition to existing network inference methods, whose primary strength lies in prioritizing context-specific regulatory interactions from global gene expression maps which integrate data from hundreds to thousands of samples from diverse experimental treatments, cell types, tissues, developmental stages or individuals.
References
- Bansal et al. (2007) Bansal, M., Belcastro, V., Ambesi-Impiombato, A., and di Bernardo, D. (2007). How to infer gene networks from expression profiles. Molecular Systems Biology, 3, 78–87.
- Benod et al. (2011) Benod, C., Vinogradova, M. V., Jouravel, N., Kim, G. E., Fletterick, R. J., and Sablin, E. P. (2011). Nuclear receptor liver receptor homologue 1 (lrh-1) regulates pancreatic cancer cell growth and proliferation. Proceedings of the National Academy of Sciences, 108(41), 16927–16931.
- Bonneau et al. (2006) Bonneau, R., Reiss, D. J., Shannon, P., Facciotti, M., Hood, L., Baliga, N. S., and Thorsson, V. (2006). The Inferelator: an algorithm for learning parsimonious regulatory networks from systems-biology data sets de novo. Genome Biology, 7(5), R36.
- Braun et al. (1990) Braun, T., Bober, E., Winter, B., Rosenthal, N., and Arnold, H. H. (1990). Myf-6, a new member of the human gene family of myogenic determination factors: evidence for a gene cluster on chromosome 12. The EMBO Journal, 9(3), 821 – 831.
- Bussemaker et al. (2007) Bussemaker, H. J., Foat, B. C., and Ward, L. D. (2007). Predictive modeling of genome-wide mRNA expression: from modules to molecules. Annu Rev Biophys Biomol Struct, 36, 329–347.
- Chang et al. (2011) Chang, C., Chang, G., and Chen, H. (2011). A novel cyclic AMP/Epac1/CaMKI signaling cascade promotes GCM1 desumoylation and placental cell fusion. Molecular and Cellular Biology, 31(18), 3820 – 3831.
- Das et al. (2011) Das, S., Jena, S., and Levasseur, D. N. (2011). Alternative splicing produces Nanog protein variants with different capacities for self-renewal and pluripotency in embryonic stem cells. Journal of Biological Chemistry, 286(49), 42690–42703.
- Faith et al. (2007) Faith, J. J., Hayete, B., Thaden, J. T., Mogno, I., Wierzbowski, J., Cottarel, G., Kasif, S., Collins, J. J., and Gardner, T. S. (2007). Large-scale mapping and validation of Escherichia coli transcriptional regulation from a compendium of expression profiles. PLoS Biology, 5(1), 54–66.
- Friedman (2004) Friedman, N. (2004). Inferring cellular networks using probabilistic graphical models. Science, 303(5659), 799–805.
- Gama-Castro et al. (2008) Gama-Castro, S., Jimenez-Jacinto, V., Peralta-Gil, M., Santos-Zavaleta, A., Penaloza-Spinola, M. I., Contreras-Moreira, B., Segura-Salazar, J., Muniz-Rascado, L., Martinez-Flores, I., Salgado, H., Bonavides-Martinez, C., Abreu-Goodger, C., Rodriguez-Penagos, C., Miranda-Rios, J., Morett, E., Merino, E., Huerta, A. M., Trevino-Quintanilla, L., and Collado-Vides, J. (2008). RegulonDB (version 6.0): gene regulation model of Escherichia coli K-12 beyond transcription, active (experimental) annotated promoters and Textpresso navigation. Nucleic Acids Research, 36(Database issue), D120–124.
- Gasch et al. (2000) Gasch, A. P., Spellman, P. T., Kao, C. M., Carmel-Harel, O., Eisen, M. B., Storz, G., Botstein, D., and Brown, P. O. (2000). Genomic expression programs in the response of yeast cells to environmental changes. Molecular and Cellular Biology, 11(12), 4241–4257.
- Harbison et al. (2004) Harbison, C. T., Gordon, D. B., Lee, T. I., Rinaldi, N. J., Macisaac, K. D., Danford, T. W., Hannett, N. M., Tagne, J. B., Reynolds, D. B., Yoo, J., Jennings, E. G., Zeitlinger, J., Pokholok, D. K., Kellis, M., Rolfe, P. A., Takusagawa, K. T., Lander, E. S., Gifford, D. K., Fraenkel, E., and Young, R. A. (2004). Transcriptional regulatory code of a eukaryotic genome. Nature, 431, 99–104.
- Huynh-Thu et al. (2010) Huynh-Thu, V. A., Irrthum, A., Wehenkel, L., and Geurts, P. (2010). Inferring regulatory networks from expression data using tree-based methods. PLoS ONE, 5(9), e12776.
- Joshi et al. (2009) Joshi, A., De Smet, R., Marchal, K., Van de Peer, Y., and Michoel, T. (2009). Module networks revisited: computational assessment and prioritization of model predictions. Bioinformatics, 25(4), 490–496.
- Karafin et al. (2011) Karafin, M., Parwani, A. V., Netto, G. J., Illei, P. B., Epstein, J. I., Ladanyi, M., and Argani, P. (2011). Diffuse expression of PAX2 and PAX8 in the cystic epithelium of mixed epithelial stromal tumor, angiomyolipoma with epithelial cysts, and primary renal synovial sarcoma: evidence supporting renal tubular differentiation. American Journal of Surgical Pathology, 35(9), 1264–1273.
- Libório et al. (2011) Libório, T. N., Acquafreda, T., Matizonkas-Antonio, L. F., Silva-Valenzuela, M. G., Ferraz, A. R., and Nunes, F. D. (2011). In situ hybridization detection of homeobox genes reveals distinct expression patterns in oral squamous cell carcinomas. Histopathology, 58(2), 225–233.
- Lukk et al. (2010) Lukk, M., Kapushesky, M., Nikkila, J., Parkinson, H., Goncalves, A., Huber, W., Ukkonen, E., and Brazma, A. (2010). A global map of human gene expression. Nat Biotech, 28(4), 322–324.
- Luscombe et al. (2004) Luscombe, N. M., Madan Babu, M., Yu, H., Snyder, M., Teichmann, S. A., and Gerstein, M. (2004). Genomic analysis of regulatory network dynamics reveals large topological changes. Nature, 431, 308–312.
- Marbach et al. (2010) Marbach, D., Prill, R. J., Schaffter, T., Mattiussi, C., Floreano, D., and Stolovitzky, G. (2010). Revealing strengths and weaknesses of methods for gene network inference. Proceedings of the National Academy of Sciences, 107(14), 6286–6291.
- Margolin et al. (2006) Margolin, A., Nemenman, I., Basso, K., Wiggins, C., Stolovitzky, G., Favera, R., and Califano, A. (2006). ARACNE: an algorithm for the reconstruction of gene regulatory networks in a mammalian cellular context. BMC Bioinformatics, 7(Suppl 1), S7.
- Michoel et al. (2009) Michoel, T., De Smet, R., Joshi, A., Van de Peer, Y., and Marchal, K. (2009). Comparative analysis of module-based versus direct methods for reverse-engineering transcriptional regulatory networks. BMC Systems Biology, 3(1), 49.
- Monteiro et al. (2008) Monteiro, P. T., Mendes, N. D., Teixeira, M. C., d’Orey, S., Tenreiro, S., Mira, N. P., Pais, H., Francisco, A. P., Carvalho, A. M., Lourenco, A. B., Sa-Correia, I., Oliveira, A. L., and Freitas, A. T. (2008). YEASTRACT-DISCOVERER: new tools to improve the analysis of transcriptional regulatory associations in Saccharomyces cerevisiae. Nucleic Acids Research, 36(suppl_1), D132–136.
- NCBI (????) NCBI (????). http://www.ncbi.nlm.nih.gov/. [Online; accessed 01-March-2012].
- Perseu et al. (2011) Perseu, L., Satta, S., Moi, P., Demartis, F. R., Manunza, L., Sollaino, M. C., Barella, S., Cao, A., and Galanello, R. (2011). KLF1 gene mutations cause borderline HbA2. Blood, 118(16), 4454–4458.
- Prill et al. (2010) Prill, R. J., Marbach, D., Saez-Rodriguez, J., Sorger, P. K., Alexopoulos, L. G., Xue, X., Clarke, N. D., Altan-Bonnet, G., and Stolovitzky, G. (2010). Towards a rigorous assessment of systems biology models: The DREAM3 challenges. PLoS ONE, 5(2), e9202.
- Qi et al. (2011) Qi, J., Michoel, T., and Butler, G. (2011). Applying linear models to learn regulation programs in a transcription regulatory module network. Lecture Notes in Computer Science, 6623/2011, 37–47.
- Schaefer et al. (2010) Schaefer, U., Schmeier, S., and Bajic, V. B. (2010). TcoF-DB: dragon database for human transcription co-factors and transcription factor interacting proteins. Nucleic Acids Research.
- Segal et al. (2003) Segal, E., Shapira, M., Regev, A., Pe’er, D., Botstein, D., Koller, D., and Friedman, N. (2003). Module networks: identifying regulatory modules and their condition-specific regulators from gene expression data. Nature Genetics, 34(2), 166–176.
- Smyth (2004) Smyth, G. K. (2004). Linear models and empirical Bayes methods for assessing differential expression in microarray experiments. Statistical Applications in Genetics and Molecular Biology, 3, Article3.
- Smyth (2005) Smyth, G. K. (2005). Limma: linear models for microarray data. In Bioinformatics and Computational Biology Solutions using R and Bioconductor, pages 397–420. Springer.
- Sotoodehnia et al. (2011) Sotoodehnia, N., Isaacs, A., and et al. (2011). Common variants in 22 loci are associated with qrs duration and cardiac ventricular conduction. Nat Genet, 42, 1061–4036.
- Wang et al. (2011) Wang, H., Venkatesh, M., Li, H., Goetz, R., Mukherjee, S., Biswas, A., Zhu, L., Kaubisch, A., Wang, L., Pullman, J., Whitney, K., Kuro-o, M., Roig, A. I., Shay, J. W., Mohammadi, M., and Mani, S. (2011). Pregnane x receptor activation induces FGF19-dependent tumor aggressiveness in humans and mice. The Journal of Clinical Investigation, 121(8), 3220–3232.
- Wang et al. (2010) Wang, T., Zeng, Z., Li, T., Liu, J., Li, J., Li, Y., Zhao, Q., Wei, Z., Wang, Y., Li, B., Feng, G., He, L., and Shi, Y. (2010). Common SNPs in Myelin transcription factor 1-like MYT1: Association with major depressive disorder in the chinese han population. PLoS ONE, 5(10), e13662.
- Zhu et al. (2004) Zhu, J., Lum, P. Y., Lamb, J., GuhaThakurta, D., Edwards, S. W., Thieringer, R., Berger, J. P., Wu, M. S., Thompson, J., Sachs, A. B., and Schadt, E. E. (2004). An integrative genomics approach to the reconstruction of gene networks in segregating populations. Cytogenet Genome Res, 105, 363–374.