Transverse decoherence and coherent spectra in long bunches with space charge
Abstract
The transverse bunch spectrum and the transverse decoherence/recoherence following an initial bunch offset are important phenomena in synchrotrons and storage rings, and are widely used for beam and lattice measurements. Incoherent shifts of the particles betatron frequency and of the synchrotron frequency modify the transverse spectrum and the bunch decoherence. In this study we analyze the effects of transverse space charge and of the rf nonlinearity on the decoherence signals. The transverse bunch decoherence and the resulting coherent spectra are measured in the SIS18 synchrotron at GSI Darmstadt for different bunch parameters. Particle tracking simulations together with an analytical model are used to describe the modifications in the decoherence signals and in the coherent spectra due to space charge and the rf bucket nonlinearity.
I INTRODUCTION
Transverse coherent oscillations of bunches induced by a fast kicker magnet are routinely used in synchrotron or storage ring to measure for example the tune or other ring parameters, see e.g. jones06 . The transverse offset of a bunch, averaged over the bunch length, can be recorded every single turn. The spectrum is then concentrated around the base-band , where is the fractional part of the betatron tune and is the revolution frequency. This diagnostics is usually used for time-resolved and very accurate measurements of the tune .
Transverse bunch decoherence is a process of a turn-to-turn reduction of the total bunch offset signal after an initial bunch displacement. In a linear focusing lattice the bunch decoherence is a manifestation of the lattice chromaticity where the synchrotron dynamics also plays an important role, causing the signal recoherence exactly after the synchrotron period. Other damping mechanisms, as due to lattice nonlinearities, additionally damp the transverse oscillations. Transverse decoherence is often used as a machine diagnostics tool. Undesired transverse bunch oscillations can also appear after the bunch-to-bucket transfer between synchrotrons. In order to use transverse decoherence as a diagnostics tool for intense bunches of arbitrary length and also to control undesired oscillations of such bunches it is important to understand the decoherence in the presence of transverse space charge and nonlinear synchrotron oscillations.
We demonstrate that the decoherence signal can be explained in terms of the transverse head-tail bunch mode spectrum. For finite chromaticity also the head-tail modes contribute to the bunch coherent spectrum. The shift of the head-tail mode frequencies due to space charge and wall currents can be well explained in terms of the analytical expressions for an airbag bunch distribution blask98 ; boine2009 . The head-tail mode frequencies are also modified by changes in the individual particle synchrotron frequency. In long bunches one has to account for the spread of the synchrotron frequencies. Both, transverse space charge and nonlinear synchrotron oscillations are important to understand the decoherence signals and transverse spectra. We demonstrate that, once the spectrum- and decoherence modifications are understood, they can be used to extract useful information about the bunches.
In this work we describe measurements of transverse bunch spectra and decoherence signals obtained in the heavy-ion synchrotron SIS18 at GSI Darmstadt. The observed modification of the head-tail spectrum and of the decoherence signal caused by transverse space charge and nonlinear synchrotron oscillations are explained in terms of our theoretical approach. This approach is based on an expansion of an analytical theory for head-tail modes in combination with particle tracking simulations.
In Sec. II we use theoretical and numerical approaches to analyse the effects of space charge and nonlinear synchrotron motion on the transverse spectra and on the bunch decoherence signal. We show that a simple model for the head-tail mode frequencies with fitting parameters can be used to explain the numerically obtained spectrum modifications as well as the bunch decoherence as a function of the chromaticity. In Sec. III the results of measurements performed at the SIS18 synchrotron are presented. The space charge tune shifts determined from the transverse spectra are summarized, the role of nonlinear synchrotron motion is demonstrated and transverse bunch decoherence signals measured for different bunch conditions are presented and explained. The work is concluded in Sec. IV.
II THEORY AND NUMERICAL SIMULATIONS
The Fourier transformation of the transverse bunch signal provides peaks at frequencies which represent the bunch eigenmodes, also called head-tail modes. For short, low intensity bunches (the synchrotron frequency does not depend on the amplitude, no collective effects) the transverse spectrum has peaks at for , for , for , and so forth. Collective effects, like transverse space charge or ring impedances change the bunch eigenfrequencies and thus shift the peaks in the transverse spectrum.
Transverse space-charge effects are described by the characteristic tune shift,
| (1) |
where is the ring radius, and are the relativistic parameters, is the classical particle radius, is the peak line density (at the bunch center), and is the transverse total emittance. This tune shift corresponds to a round cross-section with a transverse K-V distribution and is defined as the modulus of the negative shift. In a rms-equivalent bunch with the Gaussian transverse profile, i.e. the transverse rms emittance is , the maximum space-charge tune shift is twice of this value, . In the case of an elliptic transverse cross-section with the rms emittances , the parameter in Eq. (1) should be replaced by
| (2) |
here for the vertical () plane, for the horizontal plane correspondingly. The parameter for the effect of space charge in a bunch is defined as a ratio of the characteristic space-charge tune shift Eq. (1) to the small-amplitude synchrotron tune,
| (3) |
II.1 LONGITUDINAL DIPOLE FREQUENCY
An important parameter for head-tail bunch oscillations in long bunches is the effective synchrotron frequency which will be different from the small-amplitude synchrotron frequency in short bunches. We will show that in long bunches the longitudinal dipole frequency can be chosen as a substitute for the small-amplitude incoherent synchrotron frequency . The longitudinal dipole frequency can be accurately measured from the bunch signal, as we will show in the experimental part of this paper. The frequency of small-amplitude dipole oscillations can be calculated as boine_rf2005
| (4) |
where the rf voltage form is , is rf bucket radian and is the line density. The small-amplitude bare synchrotron tune is given by
| (5) |
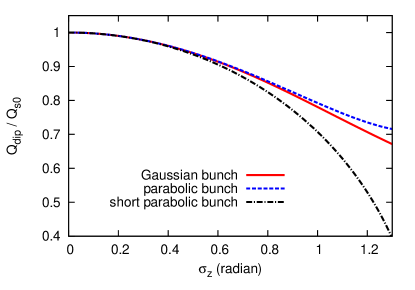
where is the machine slip factor and is the rf harmonic number. The dependence of on the rms bunch length for a Gaussian bunch is shown (red curve) in Fig. 1. The bunch length is dimensioned in radian of the rf bucket, i.e. , where is the rms bunch length in meter.
For a parabolic longitudinal distribution (or elliptic bunch) with the total half-length one obtains the analytic expression boine_rf2005 ,
| (6) |
which can be approximated in the case of a short bunch as
| (7) |
From the comparison in Fig. 1 it follows that for short bunches with the approximation Eq. (7) is sufficient. For long bunches with the dipole frequencies for Gaussian and parabolic bunches start to differ.
II.2 SPECTRUM OF A LONG BUNCH WITH SPACE CHARGE
We use particle tracking simulations boine2006 ; rumolo2002 in order to investigate the combined effect of space charge and nonlinear synchrotron motion on transverse head-tail oscillations. The numerical codes have been validated kornilov-icap09 using analytic results blask98 . For the transverse space charge force, a frozen electric field model is used, i.e. a fixed potential configuration which follows the center of mass for each bunch slice. This approach is justified in the rigid-slice regime and can be considered as a reasonable approach for moderate and strong space charge burov-lebed2009 ; burov2009 . A round transverse cross-section and a Gaussian transverse beam profile were used in the simulations in this work.
Figure 2 demonstrates differences in the transverse mode frequencies for bunches of different lengths, and with all the other parameters kept identical, including the space charge parameter .
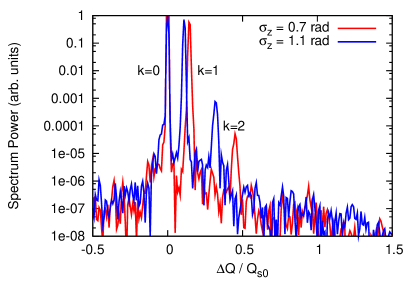
The three lowest-order modes can be seen very well, the modes of the longer bunch are shifted closer to the bare betatron tune than those of the shorter bunch. In order to describe the bunch spectrum for arbitrary bunch length and space charge strength, simulation scans over different parameters have been performed. Our simulation results suggest that the airbag bunch model blask98 can be applied to the head-tail modes in a long Gaussian bunch,
| (8) |
where is a characteristic parameter depending on the bunch length and the nonlinear synchrotron oscillations. In our case is used as a fitting parameter. Keeping the space charge parameter constant, the bunch length has been varied and the resulting eigenfrequencies analyzed, see Fig. 3 for a scan with . We observe substantial changes in the bunch mode frequencies with increasing bunch length. The parameter has been obtained from these simulation scans. Figure 4 shows a comparison between simulation results and the model Eq. (8) for a fixed bunch length and for different space charge parameters. The plot demonstrates that the model Eq. (8) is fairly accurate over the parameter range of the interest. As we additionally show in Fig. 4, there is a small difference between transverse Gaussian bunch profiles (with nonlinear transverse space charge) and transverse K-V distributions (with linear space charge). In our simulations we use the more realistic Gaussian profile.
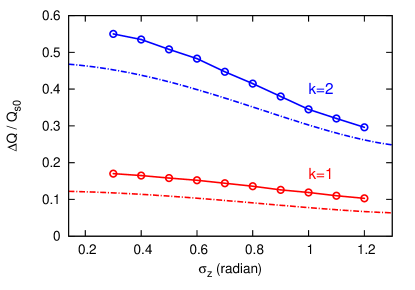

The chain curves in Fig. 3 show that it would be not correct to use the longitudinal dipole tune for the parameter . An interesting observation is that the type of the dependence of the mode frequencies on the bunch length is similar to , being however slightly different. Also, the scale factor between and the real is quite different for and . The bare synchrotron tune, which would mean , is not an adequate value, too, would then be a constant for changing bunch length and it would correspond to the value of the chain curve at small .
Simulation results for practical usage are presented in Fig. 5. These values can be included in Eq. (8) in order to estimate the space charge tune shift of the bunch eigenfrequencies for a given bunch length. The chain line demonstrates again the difference between which describes the tune shift and the longitudinal dipole frequency.

II.3 TRANSVERSE DECOHERENCE
II.3.1 LINEAR DECOHERENCE
First, we discuss the linear transverse decoherence due to chromaticity, i.e. the only source of the tune shift is the linear dependence of the betatron tune shift on the momentum shift . As a result of an initial transverse displacement , a bunch oscillates in the corresponding plane (here ). As we consider the linear case, all the particles have the identical synchrotron frequency . The betatron phase shift related to the bare tune has a harmonic dependency along a synchrotron period. Hence, after one synchrotron oscillation, the betatron phase shift is exactly compensated and the transverse amplitude is equal to the initial displacement . Assuming the Gaussian momentum distribution, the amplitude of the bunch offset evolves with the turn number as meller87
| (9) |
here is the normalized rms momentum spread. Figure 6 shows an example for bunch decoherence after a rigid kick. It demonstrates that a higher chromaticity provides a faster decoherence, and that after the synchrotron period the initial offset amplitude appears again, which is called recoherence.

II.3.2 DECOHERENCE WITH SPACE CHARGE
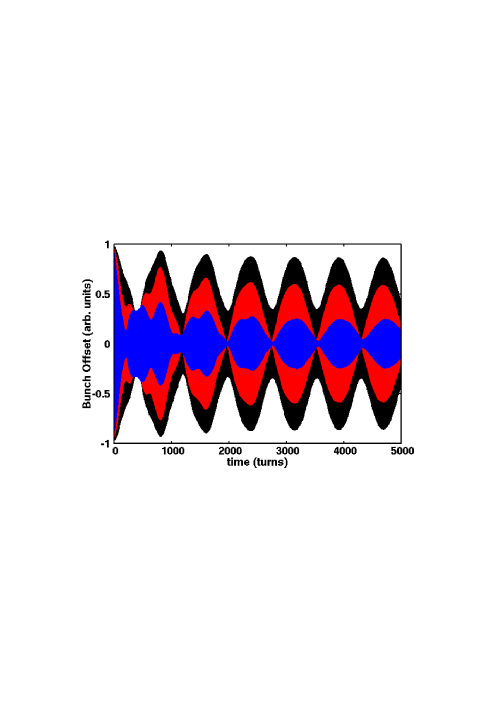
Transverse space charge causes a betatron frequency shift, which depends on the particle transverse amplitude and on the longitudinal particle position in the bunch. The decoherence behaviour is thus very different from the linear decoherence at low bunch intensities Eq. (9). Figure 7 shows examples of the bunch oscillations after a rigid kick for three different values of the space-charge parameter. The chromaticity corresponds to , where is the chromatic phase shift over the bunch length, the bunch rms length is rad. We observe the periodic recoherence with the periodicity 770 turns (, top), 1270 turns (, middle) and 1640 turns (, bottom), while the low-intensity recoherence would have a periodicity of 100 turns for the same parameters.

The key in understanding of the decoherence for a bunch with transverse space charge is the representation of the initial kick as a superposition of the bunch head-tail eigenmodes,
| (10) |
where we have extracted the chromatic phase shift along the bunch with the corresponding phase for each eigenfunction. The second key is the fact that the different eigenmodes are prone to Landau damping mechanisms, but with different intensity thresholds and damping rates. Landau damping due to the space charge tune spread along the bunch burov2009 ; balb2009 ; kornilov_prstab10 is the most important mechanism in the beam parameter regime considered in the simulations of this work. In the presence of space charge especially the negative and the high- eigenmodes present in the initial kick Eq. (10) are quickly suppressed, so that after a transition period a mixture of the survived eigenmodes continues to oscillate.
In Ref. kornilov_hb10d we have discussed in detail the case , where all the head-tail modes are strongly suppressed by Landau damping such that the mode is left alone. For stronger space charge, as in Fig. 7, the modes are damped and the resulting oscillation is the mixture of the and modes. The recoherence periodicity seen in Fig. 7 corresponds exactly to the frequency difference between these two modes, as it is the case for the wave beating. In a real machine there are often nonlinear damping mechanisms which would further suppress the and modes, but in the simulation we only have the space charge induced Landau damping which is zero for the mode and is very weak for the mode at these parameters.
It is obvious, and can be seen in Eq. (10), that the composition of the eigenmodes after a rigid kick depends on the chromaticity. This is also demonstrated in Fig. 8 which shows a comparison of the bunch decoherence for three different chromaticities. The bunch parameters correspond to Fig. 7, the space charge parameter is chosen as . We see that the periodicity of 770 turns does not change. It corresponds to the frequency difference . The reason for the different oscillation amplitudes in Fig. 7 is the increasing contribution of higher-order modes with growing in the eigenmode mixture of the initial rigid bunch offset (see Eq. 10). Recall that these modes are quickly suppressed for the parameters of the bunch and the resulting recoherence is a beating of the remaining and modes.
The airbag blask98 eigenmodes can be taken as a reasonable approximation kornilov_prstab10 of the eigenfunctions in a Gaussian bunch. The rigid offset decomposition Eq. (10) can then be solved and the resulting mode coefficients are , , . The negative modes have the same coefficients but can be disregarded in the case of a bunch with space charge burov2009 ; kornilov_prstab10 , because of their large damping rates. These coefficients are plotted in Fig. 9, where we see that for the chromaticity range of interest the relative part of the mode increases with growing . The higher-order modes follow this trend. The contribution of the and modes thus decreases as we also can observe in the simulations, see Fig. 8. A perfect agreement with the coefficients in Fig. 9 can not be expected, since the analytical model is for an airbag blask98 bunch.

III MEASUREMENTS
Transverse decoherence experiments have been performed in the heavy ion synchrotron SIS18 sis18 at GSI Darmstadt. Bunches of Ar ions were stored at the energy of 100 MeV/u and kicked transversally with a kick duration of one turn. The rf harmonic number was and all the four bunches had generally an identical behaviour. The Beam Position Monitors (BPMs) provide a higher quality signal in the vertical plane than in the horizontal one due to a smaller plate gap, thus we use the vertical BPM signals in the results presented here. The vertical bare tune was around although it could vary for different intensities and machine parameters. SIS18 general parameters are: m, , .
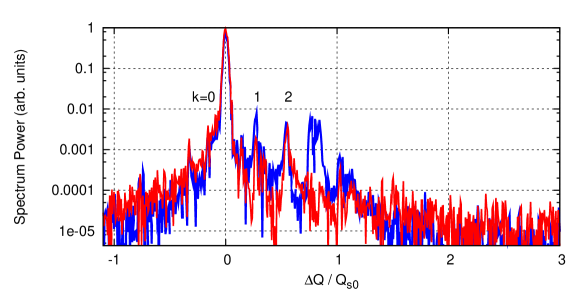
Similar to the theory section, first we discuss the longitudinal dipole frequency. Figure 10 demonstrates the bunch spectrum obtained from the sum BPM signal. The satellites of the central frequency are well resolved, the peaks are equidistant what provides the longitudinal dipole frequency. The longitudinal dipole frequency determined by this way is , the peak rf voltage was kV here. The bare synchrotron tune can also be accurately determined using Eq. (5) and it is in this case. Note the large difference between the bare synchrotron frequency and the dipole frequency. Using the curves from Fig. 1 we can obtain the rms bunch length rad, which is a typical length in the experiments at SIS18.

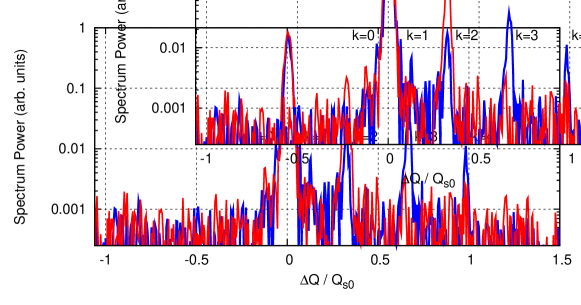
The first example for the decoherence measurements is presented in Fig. 11 and Fig. 12. Figure 11 shows the turn-per-turn transverse bunch offset after the kick. Figure 12 demonstrates the spectrum of these bunch oscillations, the frequency on the horizontal axis is normalized by the bare synchrotron tune. The red line is for the spectrum of the whole bunch and shows mainly peaks of two modes which we can identify as the mode and the mode. If we calculate a Fourier transform for the bunch head, its spectrum (the blue line) clearly reveals other peaks, so that we can identify five head-tail modes, see Fig. 12. The spectrum is very different from the case without collective effects: the lines are not equidistant, the negative-modes () are suppressed. The fact that the mode tune shifts are consistent with the space-charge model can be proved by calculating the space charge parameter,
| (11) |
which corresponds to the model Eq. (8). The synchrotron oscillation parameter for the modes and is obtained from the results given in Fig. 5. is the tune shift of the bunch mode from the measured spectrum. Here and for the examples to follow we summarize the space charge parameters obtained from the different eigenfrequencies of the spectra in Fig. 13. The relevant bunch parameters are summarized in Table 1. The values for the modes from Fig. 12 are shown in Fig. 13 with the blue circles, . Since this was a rather short bunch, , the -parameter was close to 1.0 and thus it was possible to estimate the space charge parameter for the mode as well.

| signals | symbols in Fig. 13 | |||||
|---|---|---|---|---|---|---|
| Figs. 11, 12 | blue circles | 0.66 | 3 | 3.63 | 4.0 | 10 |
| Figs. 14, 15 | red squares | 1.15 | 5 | 2.35 | 3.24 | 9 |
| Figs. 17, 18 | black crosses | 1.2 | 5 | 2.28 | 3.24 | 4.5 |
| Figs. 19, 20 | cyan triangles | 1.0 | 0 | 2.5 | 3.24 | 4 |
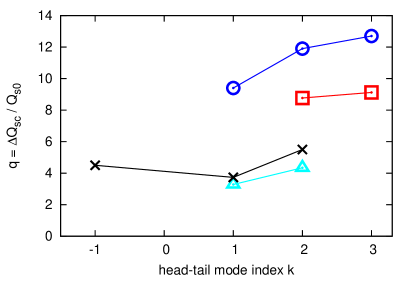
Figure 13 demonstrates a certain consistency between different head-tail modes for the space charge parameter, that, however, can not be expected perfect. The model Eq. (8) is based on the airbag blask98 bunch which is a reasonable, but still an approximation for a Gaussian bunch kornilov_prstab10 . The bunch spectra are also weakly affected by the facility impedances, image charges and nonlinear field components neglected in our analysis. Finally, in our simulations Gaussian bunch profiles in the transverse and in the longitudinal plane have been assumed. It is a good, but not exact description for the bunches in the machine experiments.
The space-charge parameter can be additionally estimated using Eq. (1) and the measured bunch parameters. The particle number and the bunch length could be measured with a reasonable accuracy. The transverse beam radius, which enters the space-charge tune shift as squared (, is the vertical rms radius) and is thus especially important, could not be determined with a satisfactory precision, as it was also the case in the previous coasting-beam measurements paret2010 at SIS18. As an example, here we provide an estimation for the bunch presented in Figs. 11, 12. The transverse rms emittances were mm mrad, mm rad, number of ions per bunch was 5.1. Using these parameters, the bunch length, and the bare synchrotron tune (see Table 1), we obtain from Eqs. (1) ,(2) 7. In this work we make no claim on a perfect agreement of the –values obtained from the transverse spectra with the –estimations provided by the bunch parameters and Eq. (1), mainly due to the uncertainty in the transverse beam size measurements at SIS18.
In the next example we show a longer bunch, , due to a lower rf voltage, see Table 1. The transverse bunch oscillations after the kick are shown in Fig. 14 and the corresponding spectrum is shown in Fig. 15. In comparison to the previous example (Figs. 11, 12), the bunch here is longer, but the particle number is higher and the synchrotron tune is larger, thus the space charge parameter is similar, . As we can see in Fig. 15, the spectrum is dominated by two modes, the mode at the bare tune, and another one at , which gives the periodicity of the bunch recoherence, see Fig. 14. The mode is suppressed as it is the case in the previous example, and it is to expect that here we have the mode again. Additionally, this could be proved as follows. Plotting the bunch vertical traces and subtracting the total bunch offset, thus reducing the contribution of the mode, we observe a clear two-knot structure of the modes, see Fig. 16. The frequencies of the further peaks in Fig. 15 correspond rather well to the space-charge model with .


In the next example we demonstrate a bunch decoherence dominated by a mixture of the mode with the mode; the bunch oscillations are shown in Fig. 17, the spectrum is shown in Fig. 18. The horizontal chromaticity was partly compensated, by a half of the natural value, the associated nonlinearities probably contributed to establishing of the longer bunch and to a stronger damping of the mode. The recoherence is thus quite slower, nearly one and a half thousand turns (see Fig. 17), which is given by the frequency of the mode in a good agreement with the bunch spectrum, Fig. 18. Another outstanding feature of this spectrum is the clear presence of the mode, with the frequency shifted strongly downwards in a very good agreement with the space-charge model, see black crosses in Fig. 13. In part, the presence of the mode was probably possible due to rather moderate space charge in this case.


The transverse decoherence observed in the case presented in Figs. 19, 20, is very different from the third example, Fig. 17, although the space-charge parameter is similar, , as well as the bunch length, see Table 1. We see that the recoherence periodicity is quite faster which is due to the dominance of the mode as it is confirmed in the bunch spectrum, see the red line in Fig. 20. More remarkable, the bunch decoherence in Fig. 19 shows a much weaker amplitude drop between the recoherence peaks. The reason is the compensated vertical chromaticity to nearly zero, according to the set parameters. This is predicted by the linear theory Eq. (9), also shown in Fig. 6. According to the interpretation of the mode mixture, at a small chromaticity the part of the mode is very large, see Fig. 9. The spectrum from the measurements in Fig. 20 confirms this. The relatively small part of the mode provides the periodicity of a weak recoherence. For the determination of the space-charge parameter, the eigenfrequency of the mode is needed which could be obtained by a frequency analysis of the bunch head oscillations, see the blue line in Fig. 20, and the resulting –values in Fig. 13 (cyan triangles).

IV CONCLUSIONS
The transverse decoherence and coherent eigenspectra in long bunches with space charge have been studied using measurements at the SIS18 heavy-ion synchrotron and particle tracking simulations.
A model Eq. (8) for the combined effect of space charge and nonlinear synchrotron oscillations has been formulated, with the fitting parameter obtained from the particle tracking simulations for the low-order head-tail modes. The space-charge parameter of the bunch can be determined for every head-tail mode from the corresponding frequency shift , see Eq. (11), according to the given bunch length.
The transverse decoherence in bunches with space charge has been observed experimentally and quantitively explained, using simulations and analytic models. An initial rigid bunch offset can be decomposed into head-tail modes. The chromaticity determines the contribution of the different head-tail modes. Using the airbag blask98 eigenmodes as an approximation for the bunch head-tail modes, the relative amplitudes can be found analytically, see Fig. 8.
Different head-tail modes experience also different Landau damping rates. After a transition period the bunch oscillation is a combination of the remaining modes. For example, it can be a mix of the mode and mode. The periodicity of the bunch recoherence corresponds then to the frequency difference between these two modes. Our simulation examples demonstrate this explanation of the bunch decoherence for different space-charge parameters and for different chromaticities, see Figs. 7, 8. In the simulations the dominating Landau damping mechanism is due to the variation of the space charge tune shift along the bunch burov2009 ; balb2009 ; kornilov_prstab10 .
Experimental observations of the transverse bunch decoherence with space charge in the SIS18 heavy-ion synchrotron at GSI are presented. The space charge parameter has been determined from the bunch spectra for different head-tail modes, summarized in Fig. 13. With increasing bunch length we observe that nonlinear synchrotron oscillations modify the head-tail mode frequencies. The bunch decoherence always corresponded to the mix of the dominating modes, in our case the and modes or the and modes. Compared to the simulation it is more difficult to predict which modes would be faster suppressed due to additional damping mechanisms in a real machine. In the experiment the oscillations are further damped after the transition period, possibly due to the nonlinear magnet field errors. The periodicity of the recoherence was exactly confirmed by the mode frequencies from the spectra. A direct comparison of the first two examples (Figs. 11, 12 vs. Figs. 14, 15) demonstrates the role of the bunch length. A comparison of the the fourth example (Figs. 19, 20) with the others demonstrates the role of the chromaticity: at a nearly zero chromaticity the mode dominates the bunch decoherence alone. The third example (Figs. 17, 18) shows a decoherence with pronounced flat between the recoherence peaks, corresponding to the mix of the and modes.
The results of this work apply to the evolution of a possible transverse injection offset during bunch-to-bucket transfer from one ring to another. Transverse coherent spectra can be used not only to measure the betatron tune, the head-tail mode frequencies can be used to extract useful information about the long intense bunches. The understanding of the decoherence with space charge and rf nonlinearity has direct consequences for the chromaticity measurements in intense bunches, which should be analysed in detail in a future work.
References
- (1) R. Jones, H. Schmickler, Introduction to beam instrumentation and diagnostics, CERN Accelerator School, Zeuthen, Germany, 15-26 Sep 2003, (CERN-2006-002, p. 75)
- (2) M. Blaskiewicz, Phys. Rev. ST Accel. Beams 1, 044201 (1998)
- (3) O. Boine-Frankenheim, V. Kornilov, Phys. Rev. ST Accel. Beams, 12, 114201 (2009)
- (4) O. Boine-Frankenheim, T. Shukla, Phys. Rev. ST Accel. Beams 8, 034201 (2005)
- (5) O. Boine-Frankenheim, V. Kornilov, Proc. of ICAP2006, 2-6 Oct., Chamonix Mont-Blanc, (2006)
- (6) G. Rumolo and F. Zimmermann, Phys. Rev. ST Accel. Beams 5, 121002 (2002)
- (7) V. Kornilov and O. Boine-Frankenheim, Proc. of 10th International Computational Accelerator Physics Conference ICAP2009, San Francisco, USA, Aug 31 - Sep 4 (2009)
- (8) A. Burov and V. Lebedev, Phys. Rev. ST Accel. Beams 12, 034201 (2009)
- (9) A. Burov, Phys. Rev. ST Accel. Beams 12, 044202 (2009); A. Burov, Phys. Rev. ST Accel. Beams 12, 109901(E) (2009)
- (10) R.E. Meller, A.W. Chao, J.M. Peterson, S.G. Peggs, M. Furman, SSC Report SSC-N-360 (1987)
- (11) V. Balbekov, Phys. Rev. ST Accel. Beams 12, 124402 (2009)
- (12) V. Kornilov and O. Boine-Frankenheim, Phys. Rev. ST Accel. Beams 13, 114201 (2010)
- (13) V. Kornilov, O. Boine-Frankenheim, Transverse Decoherence in Bunches with Space Charge, Proc. of 46th ICFA Advanced Beam Dynamics Workshop HB2010, p. 101, Morschach, Switzerland, Sept. 27 - Oct. 1, (2010)
- (14) K. Blasche and B. Franczak, in Proceedings of EPAC 1992, p. 9, Berlin, Germany, 24-28 March 1992
- (15) S. Paret, V. Kornilov, O. Boine-Frankenheim, T. Weiland, Phys. Rev. ST Accel. Beams 13, 022802 (2010)