Limited Imitation Contagion on Random Networks: Chaos, Universality, and Unpredictability
Abstract
We study a family of binary state, socially-inspired contagion models which incorporate imitation limited by an aversion to complete conformity. We uncover rich behavior in our models whether operating with either probabilistic or deterministic individual response functions on both dynamic and fixed random networks. In particular, we find significant variation in the limiting behavior of a population’s infected fraction, ranging from steady-state to chaotic. We show that period doubling arises as we increase the average node degree, and that the universality class of this well known route to chaos depends on the interaction structure of random networks rather than the microscopic behavior of individual nodes. We find that increasing the fixedness of the system tends to stabilize the infected fraction, yet disjoint, multiple equilibria are possible depending solely on the choice of the initially infected node.
pacs:
89.65.-s,87.23.Ge,05.45.-aThe structure and dynamics of real, complex networks remains an open area of great research interest, particularly in the realm of evolutionary processes acting on and within networked systems Newman (2003); Watts and Dodds (2007); Colizza et al. (2011); Wuchty et al. (2007); Hidalgo et al. (2007); Liu et al. (2011). Here, motivated by considerations of social contagion—the spreading of ideas and behaviors between people through social networks and media—we explore an idealized, binary-state social contagion model in which individuals choose to be like others but only up to a point: they do not want to be like everyone else Simmel (1957); Granovetter and Soong (1986); Ugander et al. (2012); cou . We term such behavior ‘Limited Imitation Contagion.’ We build naturally on previous studies of threshold models of contagion Schelling (1971); Granovetter (1978); Watts (2002); Gleeson (2008), and our model can also be seen as a specific subfamily of dynamical Boolean network models Kauffman (1969); Aldana et al. (2003). We show how macroscopic network structure overrides microscopic details, and we find complex dynamics whose character moves from universal and predictable to particular and unpredictable as we allow the system to become increasingly deterministic.
In constructing our model, our main interest is in understanding how spreading by Limited Imitation Contagion on random networks behaves under three main tunable conditions: (1) Social awareness: the rate of contact between individuals; (2) Social variability: the extent to which friendships are fixed; and (3) Social influence: the character of individuals’ responses to the behavior of others.
To begin with, we consider a binary state model for which individuals are either in a base state or an alternate state . We assume individuals interact over an uncorrelated random network, which may be dynamic or fixed. For simplicity, and due to the richness of the dynamics we find, we employ standard Erdös-Rényi networks which possess Poisson degree distributions. We take time to be discrete (), and we prescribe each node’s degree at . In a dynamic network, when node updates, it samples the states of randomly chosen nodes (i.e., the system is a random mixing model with non-uniform contact rates). For a fixed network, node repeatedly samples the same nodes. We further restrict our attention to single-seed contagion processes wherein all nodes are in state at time , with one randomly chosen node in state .
The contagion process is manifested through the response functions of individual nodes. We allow nodes to update synchronously, and node ’s response function gives the probability that node will be in state upon updating, where the argument taken by is the fraction of nodes sampled by node that are currently in state , .
We investigate two kinds of response functions, probabilistic and deterministic, both of which incorporate the characteristic of the adoption probability growing and then diminishing as the perceived popularity of increases. In Fig. 1A, we show an example of a probabilistic response function, the tent map, which is defined as for and for Here, we consider the case meaning node adopts state with probability . We use the tent map for a number of reasons: (1) As a standard iterative map of the unit interval, the tent map’s dynamics for are both interesting and well understood Alligood et al. (1996)—it is fully chaotic and its invariant density is uniform on ( is the long term probability distribution for the values of a map’s iterates); (2) The tent map captures a probabilistic flavor of the adopt-when-novel, drop-when-ubiquitous behavior we aim to model; and (3) We can construct a simple and elegant connection with deterministic contagion processes which we describe next.
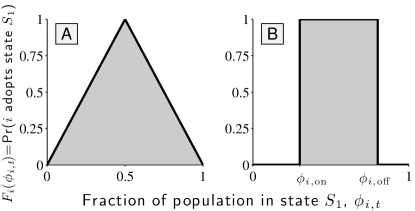
In Fig. 1B, we show an example of a deterministic response function which is characterized by ‘on’ and ‘off’ thresholds, and . Node will only adopt or remain in state if it perceives the fraction of others in state to lie between its on and off thresholds: .
For these deterministic ‘on-off’ response functions, we examine the special case where is distributed uniformly on and likewise on . Averaging over all deterministic response functions created in this way, we obtain precisely the tent map . Collectively, we then have the same on-average behavior in both the probabilistic and deterministic cases, and this allows us to profitably explore the effect of varying the specific response dynamics at the micro level, as well as interaction patterns.
We now examine the behavior of four subfamilies of our model that vary in terms of node response functions being probabilistic or deterministic (P or D), and whether or not network connections randomly rewire or are fixed (R or F). We refer to these model classes as P-R, P-F, D-R, and D-F. Each class is indexed by the parameter of average node degree , and, as per our design, all four systems have the same on-average response functions (the tent map ) and degree distributions (Poisson).
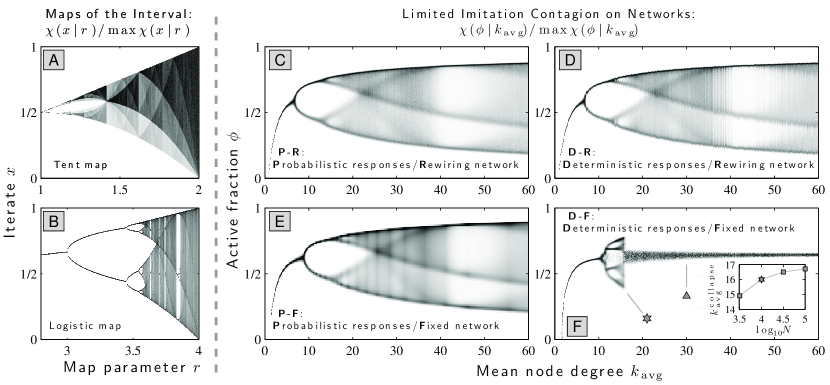
Our first focus is on the long term behavior of these four networked systems. Key to our understanding are the well-known behaviors of the tent and logistic maps acting iteratively on the unit interval, the former given above and the latter by . We reproduce the orbit diagrams for these models in Figs. 2A and B. Both systems are controlled by the amplitude parameter , whose increase leads to changes in their invariant densities, famously resulting in the bifurcation diagram for the logistic map. The two maps, while topologically conjugate, produce distinct bifurcation diagrams.
As we show in Fig. 2C–F, the signature of the microscopic response function of the tent map is erased by the network dynamics of the four model classes. Macroscopically, we see four orbit diagrams analogous to the logistic map’s characteristic bifurcation diagram. We see that increasing the average connectivity of the network is equivalent to increasing the logistic map’s amplitude parameter , and the system moves along the period-doubling route to chaos.
However, while appearing to belong to the same universality class, the orbit diagrams of the four models differ importantly in detail, most profoundly for the fully deterministic D-F class.
First, we observe that the four systems produce only three distinct orbit diagrams, since for large enough systems, the two random mixing classes P-R and D-R must exhibit the same macroscopic behavior (Figs. 2C and D). For the D-R class, random rewiring overwhelms the fact of each node having a fixed deterministic response function (for finite systems some evidence of discreteness limits the smoothness of the orbit diagram in Fig. 2D). While we present simulation results only here, we note that we are able to fully address the P-R and D-R models analytically, and we find excellent agreement (see Harris (2012) where we explore more general influence maps).
In next considering the fixed network model with probablistic response functions, P-R, we see in Fig. 2E that the orbit diagram has slightly moved to the right—the bifurcation points now occur for slightly higher values of relative to the random mixing cases. A robust, discernible vertical striation also appears, with separation between stripes increasing with , for which we do not have an explanation. Thus, making the network fixed appears to induce some modest changes in the dynamics, though we cannot discount finite size effects.
Our final model class, D-F—to whose description we devote the remainder of the paper—is the most structured, and it generates considerably different and intricate behavior. Once the network and set of response functions is realized, the system is now completely deterministic (and irreversible), and we find surprising changes in the system’s behavior at both macroscopic and microscopic scales. In Fig. 2F, we see that the orbit diagram for the D-F model collapses abruptly after several rounds of period doubling, which are themselves relatively compressed in terms of . Our simulations suggest that above an average degree of , the macroscopic dynamics always collapse. The inset in Fig. 2F shows estimates of the collapse point for up to , and the asymptotic growth with strongly suggesting the collapse is real and not a finite size effect. The collapse appears to favor a fixed point macroscopic state, around , which is the fixed point of the tent map . However, a closer examination of the D-F class’s potential dynamics reveals a far more subtle story.
In Fig. 3, we summarize the possible dynamics of a lone realized network (=, =) with a single set of fixed deterministic response functions. We exhaustively ran tests of the system’s behavior by separately seeding each individual node. Of these, 7515 contagion events successfully lead to long-term, non-zero infection levels. Figs. 3A–C show partial time series for three system evolutions for the same network, differing only by seed node, and corresponding respectively to the narrowest and widest collapses, as measure by the variance of , and the longest time to collapse. In each case, the initial dynamics of exhibit a clear period three pattern interspersed with intermittent chaotic dynamics, followed by a sharp collapse to distinct periodic behaviors.
Across all initial seeds, the time to collapse varies greatly, with the extreme example of Fig. 3C collapsing after more than 160,000 time steps and over 1.6 individual node updates. In Fig. 3D, we provide the complementary cumulative distribution for collapse times (black squares). The semi-log scale indicates that an expontial decay for covers the majority of cases with the longest collapse time clearly a singular outlier. Even after the dynamics collapse, we see that on the order of 10% of all nodes change state in each time step. Surprisingly, we see different distributions for for different individual networks. For example, the grey triangles represent the collapse time distribution for another randomly realized network with =. Again we see an exponential distribution but now with a much steeper decay. Rather than finding one outlier, we see that a set of exceptional dynamics lasts for much longer than the main exponential decay would suggest, with an isolated set distributed around 25,000, and a group ending at around 30,000.
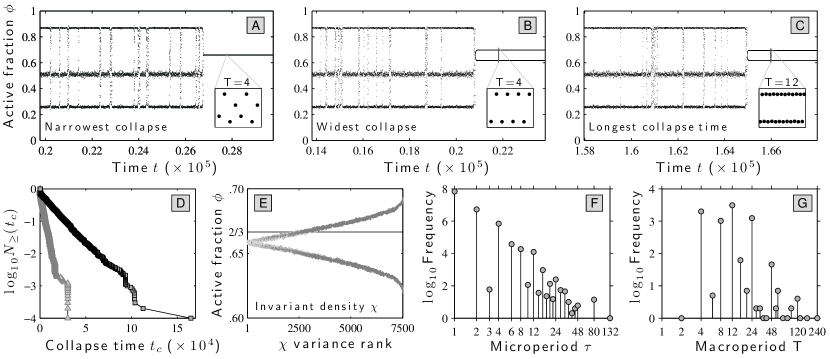
We turn lastly to the behavior after the collapse. We call the post-collapse period of the system’s ‘macroperiod’ , and the period of an individual node its ‘microperiod’ . Fig. 3E shows the invariant density for all seeds post collapse, ordered by ’s variance (contagion events that fail are not included). Strikingly, different seeds almost always lead to distinct invariant densities, with an apparent dominance of period =2 behavior (but see below). We also find that the tent map’s fixed point of 2/3 (horizontal line in Fig. 3E) is not the center of the invariant densities.
In Figs. 3F and G, we provide complete histograms of all post-collapse microperiods and macroperiods for this particular network (again ignoring failed spreading events). Unlike the collapse time distribution, we see broadly similar distributions for other individual networks. Microperiods such as 1, 2, 4, 12, and 24 form a dominant envelope, and many odd-numbered microperiods are absent. We find that the most common resultant macroperiods are 4, 8, 12, and 24; that a pure macroperiod 2 is relatively rare ( 0.1%); and that the largest observed macroperiod is 240. Again, all of these outcomes are deterministic, depending only on the choice of initial seed.
To conclude, in abstracting from a real world problem, we have constructed a rich, networked-based model of Limited Imitation Contagion that allows us to deeply explore the effects of manifesting either deterministic or probabilistic microscopic behavior in both network structure and node response in a well-defined fashion. Our findings broadly suggest that increasing the degree of a social system’s microscopic rigidity leads to higher levels of long-term unpredictability at macroscopic scales. Future work could take at least two paths, one directed toward the dynamical systems aspects and the other toward a more realistic empirically supported model. Some natural objectives would be to explain why the collapse occurs for the D-F class; to explore how local properties of seed nodes such as node degree, correlations, and clustering relate to the collapse time and post-collapse dynamics; to test other contagion mechanisms across systems of increasingly fixed microscopic structure; and to examine these Limited Imitation Contagion models on real networks and classes of naturally occurring ones.
Acknowledgements.
The authors thank A. Mandel and D. J. Watts for encouragement, and are grateful for the computational resources provided by the Vermont Advanced Computing Core supported by NASA (NNX 08A096G). KDH was supported by VT-NASA EPSCoR; CMD and PSD were supported by a grant from the MITRE Corporation; PSD was supported by NSF CAREER Award #0846668.References
- Newman (2003) M. E. J. Newman, SIAM Review 45, 167 (2003).
- Watts and Dodds (2007) D. J. Watts and P. S. Dodds, Journal of Consumer Research 34, 441 (2007).
- Colizza et al. (2011) V. Colizza, A. Barrat, M. Barthelmey, A.-J. Valleron, and A. Vespignani, PLoS Medicine 4, e13 (2011).
- Wuchty et al. (2007) S. Wuchty, B. F. Jones, and B. Uzzi, Science 316, 1036 (2007).
- Hidalgo et al. (2007) C. A. Hidalgo, B. Klinger, A.-L. Barabási, and R. Hausman, Science 317, 482 (2007).
- Liu et al. (2011) Y.-Y. Liu, J.-J. Slotine, and A.-L. Barabási, Nature 473, 167 (2011).
- Simmel (1957) G. Simmel, Am. J. Sociol. 62, 541 (1957).
- Granovetter and Soong (1986) M. S. Granovetter and R. Soong, Journal of Economic Behavior & Organization 7, 83 (1986).
- Ugander et al. (2012) J. Ugander, L. Backstrom, C. Marlow, and J. Kleinberg, Proc. Natl. Acad. Sci. 109, 5962 (2012).
- (10) Our model is distinct from traditional coupled maps Kaneko (1984), having binary rather than continuous node states, and exhibits fundamentally different behavior.
- Schelling (1971) T. C. Schelling, J. Math. Sociol. 1, 143 (1971).
- Granovetter (1978) M. Granovetter, Am. J. Sociol. 83, 1420 (1978).
- Watts (2002) D. J. Watts, Proc. Natl. Acad. Sci. 99, 5766 (2002).
- Gleeson (2008) J. P. Gleeson, Phys. Rev. E 77, 046117 (2008).
- Kauffman (1969) S. A. Kauffman, J. Theor. Biol. 22, 437 (1969).
- Aldana et al. (2003) M. Aldana, S. Coppersmith, and L. P. Kadanoff, in Perspectives and Problems in Nonlinear Science, edited by E. Kaplan, J. E. Marsden, and K. R. Sreenivasan (Springer, New York, 2003), chap. 2, pp. 23–90.
- Alligood et al. (1996) K. T. Alligood, T. D. Sauer, and J. A. Yorke, Chaos: An Introduction to Dynamical Systems (Springer, 1996).
- Harris (2012) K. D. Harris, Master’s thesis, University of Vermont (2012), URL http://arxiv.org/abs/1209.2177.
- Kaneko (1984) K. Kaneko, Prog. Theor. Phys. 72, 480 (1984).