CaF2 Whispering-Gallery-Mode Resonator Stabilized Narrow Linewidth Laser
Abstract
A fiber laser is stabilized using a Calcium Fluoride (CaF2) whispering-gallery-mode resonator. It is set up using a semiconductor optical amplifier as a gain medium. The resonator is critically coupled through prisms, and used as a filtering element to suppress the laser linewidth. Using the self-heterodyne beat technique the linewidth is determined to be 13 kHz. This implies an enhancement factor of with respect to the passive cavity linewidth. The three-cornered hat method shows a stability of after 10 s.
Whispering-gallery-mode (WGM) resonators have become popular in optics due to their compact sizes and their high quality (Q) factorsvahala2003 . Typical resonators include molten microspheresbraginsky1989 , on-chip disks and torroidslittle1997 , and crystalline disksgrudinin2006 . The highest Q factors around have been demonstrated in CaF2 crystalline disks.
Due to their high Q factors, WGM resonators can act as very precise filtersmatsko2007 . Sharp resonances can be filtered out by a resonator, or, as in this experiment, a narrow frequency selective element can be created by transmitting through a resonator. Before reaching the fundamental thermal sensitivity limitnumata2004 , the stability of a reference cavity is mainly determined by its vibration.
| (1) |
where is the laser linewidth, is the central frequency, is the length change due to vibration, is the total length, is the density, is the vibration acceleration, and is Young’s modulus. From Eq.1 we can see that WGM resonators are excellent choices for frequency standards due to their small size.
Doped WGM resonators have been used in the past to lase directly, including rare-earth doped glass spheresmiura1996 , and droplets with dye or quantum dotsschafer2008 . In these techniques the Q factor is inherently limited due to absorption. Passive WGM resonators have been used in the past to stabilize lasers, although these often require additional frequency selective elements such as fiber Bragg gratingskieu2006 ; kieu2007 .
In this Letter, we report the observation and measurement of narrow-linewidth lasing from a semiconductor optical amplifier (SOA) fiber laser, stabilized using a CaF2 resonator. The broad emission from the SOA is evanescently coupled into a CaF2 disk using a prism, and out on the other side using another prism. Previous experiments have used tapered fibers, angle-polished fibers, and microsphereskieu2006 ; kieu2007 ; sprenger2009 . In this case CaF2 disks were chosen due to their higher Q factor, and prism coupling was used due to the setup rigidity. In each roundtrip, only sharp modes can transmit through the resonator and thus achieve gain. The resulting narrow linewidth emission is studied using the three-cornered-hat measurement techniquegray1974 , as well as a self-heterodyne measurement using a 45 km delay lineokoshi1980 .
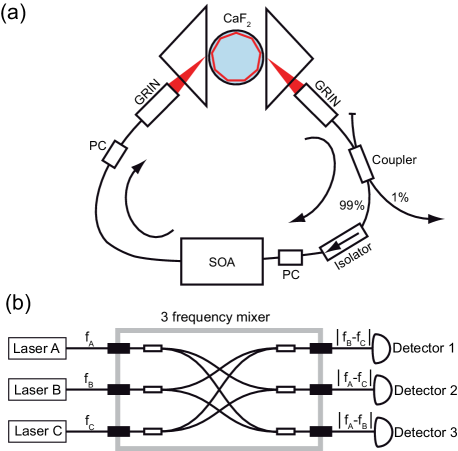
The CaF2 resonator was turned and polished on a homemade machine to a diameter of about 5 mm. This results in a free spectral range of about 15 GHz at 1550 nm. The resulting passive linewidth is measured to be 15 MHz, which corresponds to a Q factor of . Further investigations into higher Q factor resonators are planned. A graded refractive index (GRIN) lens focuses the spontaneous emission from the SOA (Thorlabs S9FC1004P) onto the back of a prism (SFL11 glass), which is at critical coupling distance from the disk. The same method is used on the other side of the prism to collect the transmitted mode, as shown in Fig. 1(a). The CaF2 disk is mounted on a thermoelectric cooling element to control the temperature. Polarization control is used to optimize the polarization mode going into the resonator, as well as into the SOA for maximum gain. An isolator prevents a backwards propagating mode, and a fiber coupler emits 1% of the lasing around 1560 nm. Single-mode lasing is achieved by carefully adjusting the coupling on each side of the resonator. Other gain materials which run single-mode in standard telecom fiber can be used in this setup. The SOA has an emission peak around 1560 nm, therefore a mode around this wavelength is selected automatically through mode competition in the laser. An Erbium-doped fiber pumped by a 980 nm laser can also be used instead of the SOA, resulting in single-mode lasing around 1530 nm without further re-adjustment.
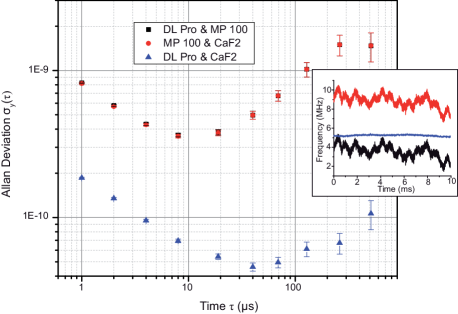
Common methods to determine linewidths are heterodyne beating with a reference laser with similar stability, self-heterodyne beating using a delay line, and the three-cornered-hat method. The linewidth of the reference laser (Toptica DL Pro, 100 kHz) is larger than the linewidth of the CaF2 stabilized laser, so the heterodyne beat technique is insufficient. The three-cornered-hat method has been used to determine absolute precision of frequency standards in the microwave domain such as Cesium or Hydrogen clocksgray1974 . More recently, experiments have been done in the optical regime to determine the absolute performance of narrow linewidth laserslopez2006 ; zhao2009 . In this case, three lasers are used in the comparison: the CaF2 disk stabilized laser, a Toptica DL Pro diode laser at 1550 nm, and a homebuilt grating stabilized diode laser in the Littrow configuration (MP 100). Outputs from the lasers are beat with each other as shown in Fig. 1(b). The beat notes around 5 to 10 MHz are recorded simultaneously on three detectors at a speed of 100 MSamples/s. Up to 10 ms of data are recorded and frequencies are calculated from 1 s segments, as shown in the inset of Fig. 2. The Allan deviation, a commonly quoted value for the stability of a frequency standardbarnes1971 , is calculated for each beat. The Allan deviation of the MP 100 and CaF2 stabilized laser beat notes, and of the DL Pro and MP 100 beat notes are around an order of magnitude worse that of the DL Pro and the CaF2 laser beat notes. This implies that the MP 100 has a larger linewidth than that of the DL Pro and the CaF2 laser.
The Allan variance of a beat note is given by , where and are the Allan variations of lasers a and b respectively. The same is true for the other two combined beats. By rearranging these formulas one finds the following to be true for the Allan variance of an individual frequency standardgray1974 .
| (2) |
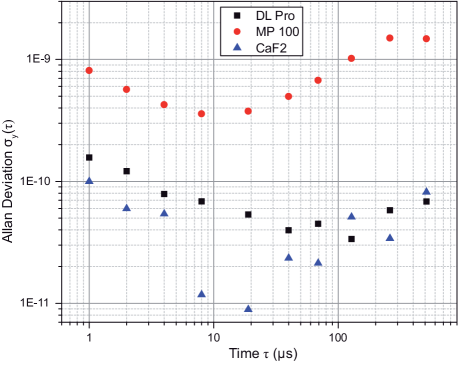
Similar equations can be found for and . The resulting Allan deviations for the lasers can be seen in Fig. 3. The CaF2 resonator initially has the best performance, and is comparable to the performance of the DL Pro at longer averaging times. The MP 100 is clearly the worst of the three lasers. The stability of the CaF2 disk stabilized laser reaches approximately after 10 s, implying a fast linewidth of 2 kHz.
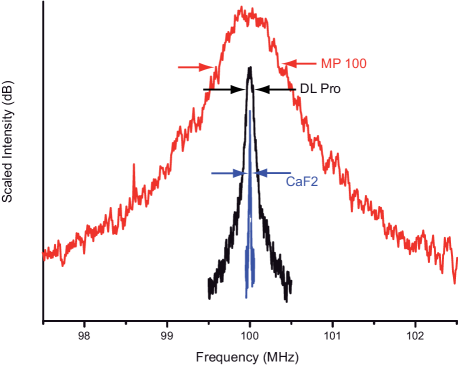
In order to verify these results, the self-heterodyne technique is employed. It is commonly used to determine narrow linewidths by splitting the laser signal using an acousto-optic modulator (AOM). One part, in this case offset by 100 MHz by the AOM, is sent through a 45 km delay line of fiber. Then it is recombined with the other part in a fiber coupler and the signal is detected on a fast photodiode (MenloSystems FPD510) and recorded using a spectrum analyzer. The delay length should be at least six times longer than the coherence length of the laser for a valid uncorrelated beatrichter1986 . In a 10 kHz laser this corresponds to 36 km of fiber. To be sure 45 km of fiber are used. The signal to noise ratio is quite low, so 70 averages are used in the final result. For the CaF2 resonator the span is 100 kHz, the resolution bandwidth is 1 kHz, and the sweep time is 100 ms. The span is set to 1 MHz for the DL Pro, and 5 MHz for the even wider grating stabilized diode laser. The results are shown in Fig. 4. The 3 dB width of the grating stabilized laser is 550 kHz, and 60 kHz for the DL Pro. The WGM resonator stabilized laser has a self-heterodyne linewidth of 18 kHz. To calculate the separate linewidth one needs to divide by for a Gaussian spectrum, and for a Lorentzian spectrumrichter1986 . This implies that the upper limits for the laser linewidths are 390 kHz for the MP 100, 43 kHz for the DL Pro, and 13 kHz for the WGM stabilized laser. This corresponds to an enhancement factor of about from the original resonance width of 15 MHz for the CaF2 disk. The result is an order of magnitude better than our previous linewidthsprenger2009 .
In conclusion, a passive fiber laser stabilization setup was presented. The high Q modes of a WGM resonator act as a filter, thus only allowing specific modes to achieve gain. Single-mode lasing can be induced using a gain material with a peak around 1550 nm, without the need of an additional frequency selective element. The linewidth was measured to be around 13 kHz using a CaF2 resonator with a Q factor of just . This implies an enhancement factor of over , and is an order of magnitude better than previous experiments have shown. WGM resonators are an excellent candidate with their compact sizes and high Q factors for passive laser stabilization, as well as frequency references and metrology.
The authors would like to thank Y. N. Zhao, S. Preu, V. Elman, and J. Zhang for stimulating discussions.
References
- (1) K. J. Vahala, “Optical microcavities,” Nature 424, 839–846 (2003).
- (2) V. B. Braginsky, M. L. Gorodetsky, and V. S. Ilchenko, “Quality-factor and nonlinear properties of optical whispering-gallery modes,” Phys. Lett. A 137, 393–397 (1989).
- (3) B. E. Little, S. T. Chu, H. A. Haus, J. Foresi, and J. Laine, “Microring resonator channel dropping filters,” J. Lightwave Technol. 15, 998–1005 (1997).
- (4) I. S. Grudinin, A. B. Matsko, A. A. Savchenkov, D. Strekalov, V. S. Ilchenko, and L. Maleki, “Ultra high q crystalline microcavities,” Opt. Commun. 265, 33–38 (2006).
- (5) A. B. Matsko, A. A. Savchenkov, N. Yu, and L. Maleki, “Whispering-gallery-mode resonators as frequency references. i. fundamental limitations,” J. Opt. Soc. Am. B 24, 1324–1335 (2007).
- (6) K. Numata, A. Kemery, and J. Camp, “Thermal-noise limit in the frequency stabilization of lasers with rigid cavities,” Phys. Rev. Lett. 93 250602 (2004).
- (7) K. Miura, K. Tanaka, and K. Hirao, “Laser oscillation of a nd3+-doped fluoride glass microsphere,” J. Mat. Sci. Lett. 15, 1854–1857 (1996).
- (8) J. Schafer, J. P. Mondia, R. Sharma, Z. H. Lu, A. S. Susha, A. L. Rogach, and L. J. Wang, “Quantum dot microdrop laser,” Nano Lett. 8, 1709–1712 (2008).
- (9) K. Kieu and M. Mansuripur, “Active q switching of a fiber laser with a microsphere resonator,” Opt. Lett. 31, 3568–3570 (2006).
- (10) K. Kieu and M. Mansuripur, “Fiber laser using a microsphere resonator as a feedback element,” Opt. Lett. 32, 244–246 (2007).
- (11) B. Sprenger, H. G. L. Schwefel, and L. J. Wang, “Whispering-gallery-mode-resonator-stabilized narrow-linewidth fiber loop laser,” Opt. Lett. 34, 3370–3372 (2009).
- (12) J. E. Gray and D. W. Allan, “A method for estimating the frequency stability of an individual oscillator,” in “Proc. 28th Symp. Freq. Control” 243 (1974).
- (13) T. Okoshi, K. Kikuchi, and A. Nakayama, “Novel method for high resolution measurement of laser output spectrum,” Electr. Lett. 16, 630–631 (1980).
- (14) E. de Carlos Lopez and J. M. L. Romero, “Frequency stability estimation of semiconductor lasers using the three-cornered hat method,” in Proc. SPIE 6046, 604621 (2006).
- (15) Y. N. Zhao, J. Zhang, A. Stejskal, T. Liu, V. Elman, Z. H. Lu, and L. J. Wang, “A vibration-insensitive optical cavity and absolute determination of its ultrahigh stability,” Opt. Express 17, 8970–8982 (2009).
- (16) J. A. Barnes, A. R. Chi, L. S. Cutler, D. J. Healey, D. B. Leeson, T. E. McGunigal, J. James A. Mullen, W. L. Smith, R. L. Sydnor, R. F. C. Vessot, and G. M. R. Winkler, “Characterization of frequency stability,” IEEE Trans. Instrum. Meas. 20, 105–120 (1971).
- (17) L. Richter, H. Mandelberg, M. Kruger, and P. McGrath, “Linewidth determination from self-heterodyne measurements with subcoherence delay times,” IEEE J. Quant. Electr. 22, 2070–2074 (1986).