Baryonic resonances close to the threshold: the case of in pp collisions
Abstract
We present an analysis of the resonance produced in the reaction at kinetic beam energy measured with HADES at GSI. The two charged decay channels have been reconstructed for the first time in p+p collisions. The efficiency and acceptance-corrected spectral shapes show a peak position clearly below . We find a total production cross section of b. The analysis of its polar angle distribution suggests that the is produced isotropically in the p-p center of mass system.
pacs:
14.20.Jn, 13.30.-aI Introduction
Lying slightly below the threshold (), the broad resonance is considered to be strongly linked to the antikaon-nucleon interaction. Hence the understanding of this resonance is mandatory to address the issue of the interaction. The was first observed experimentally by studying its presence in the exit channel in -induced reactions Als61 . From a theoretical point of view the is treated within a coupled channel approach, based on chiral dynamics, in which the low-energy interactions can be handled theoSumm . In this Ansatz the appears naturally as a dynamically generated resonance, resulting from the superposition of two components: a quasi-bound state and a resonance.
At present, the molecule-like character of the is commonly accepted. However, the contribution of the channel to the formation process is still discussed controversially.
Indeed phenomenological approaches different from chiral-SU(3) predictions Esma support the hypothesis that the can be considered as a pure quasi-bound state and suggest experimental methods to test this Ansatz.
In general, models can be constrained above the threshold by scattering data
and by the measurements of the , scattering lengths extracted from kaonic atoms as shown in sid:2011 ; weis:2011 .
Below threshold, the only experimental observable related to the interaction is the spectral shape extracted from the decays .
The authors of reference Nach99 predict for the in the reaction that the spectral functions of the three final states should differ
because of the interference of the isospin 0 and 1 channels.
In fact, the measured invariant
mass distributions of the states have different shapes Mor10 , which also vary as a function of the photon energy,
but the observed shifts of the distributions are not compatible with the theoretical predictions.
Furthermore, the approach Maga05 predicts that the coupling of the resonance to the quasi-bound state and the pole depends on the initial state configuration. The observed line shape and pole position of the is expected to vary for different reactions. Data exploiting pion Thom73 and kaon Hem85 beams are scarce, and the reaction has been studied hitherto only by the ANKE experiment L1405Anke at a beam momentum of .
Based on the analysis of the reaction at 3.5 GeV kinetic beam energy, measured by HADES hadesSpectro , we present the first data on the decay of the resonance into the final states. The spectral shapes, the polar production angle, and the production cross-section of the are discussed.
II Analysis
II.1 Signal extraction
The properties of the resonance are studied in the associated production together with a proton and a followed by the decay into pairs, where a branching ratio of for each decay channel is assumed:
| (1) | ||||
The assumption about the branching ratios of the decays is motivated by the consideration of isospin symmetries ose99 and does not take into account the interference between the two isospins states and .
For an exclusive analysis, all charged particles () in the final state have been identified employing the momentum dependent and velocity information S1385:2011 . The neutron appearing in the reaction (1) has been reconstructed via the missing mass to the four charged particles and
has been selected via a cut around the nominal neutron mass (see Fig.1 in Valencia2010 ). The intermediate and hyperons have been reconstructed via the missing mass to the proton, the and either the or the (see Fig. 4 in Valencia2010 ). mass cuts around the nominal masses of the and hyperons allow to extract the signal corresponding to the two decay modes into and . After the subtraction of the misidentification background due to the limited kaon identification S1385:2011 , the spectral shape for both decay channels can be analyzed in the missing mass spectra to the proton and the , .
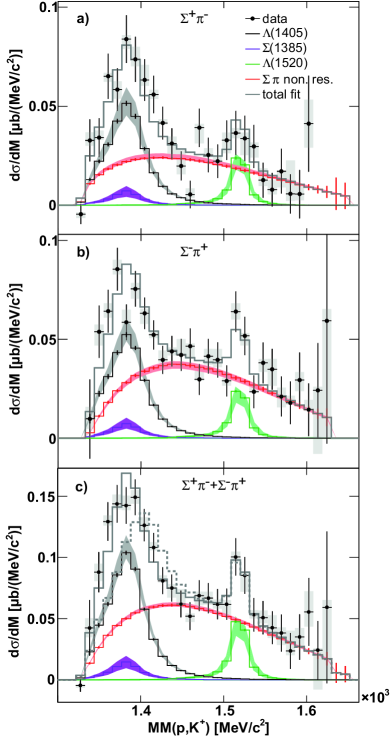
Figure 1 shows the distributions for the a) and b) decay channels. The black dots correspond to the experimental data.
Together with the reaction (1) the following contributions have been considered:
| (2) | |||
| (3) | |||
| (4) | |||
| (5) |
Full scale simulations of these channels have been carried out and the relative contribution of each of them has been evaluated from a simultaneous fit to the two missing mass distributions together with the two distributions Valencia2010 . The area around for has been excluded from the fit in order to not bias the finally extracted shape of the resonance by the simulated shape. In total, a normalized value of has been obtained. Figure 1 shows the contributions of the different channels together with their incoherent sum (gray histogram, solid line).
The data and the full-scale simulations shown in Fig. 1 a)-c) are corrected for acceptance and efficiency and the statistical and systematic errors for both, experimental data and simulations are displayed.
The finite geometrical acceptance of HADES and the total reconstruction efficiency have been calculated using full-scale simulations of the channels (1-5), including the correct angular distribution for these channels as described below.
The systematic errors shown in Fig. 1 have been obtained by varying the selection cuts by and the angular distribution of the simulated reactions (4) and (5) by .
The experimental data (black dots) in Fig. 1 a) and b) show two distinct peak structures. The one slightly below is mainly due to the resonance, whereas the second peak around is attributed to the resonance.
The relative contribution of and can not be determined by fitting the simulations to the experimental data since their mass spectra overlap completely.
However, the contribution of the can be inferred from the analysis of the
decay.
Figure 2 shows the distribution where the contribution corresponds to a peak, while the corresponds to a broader distribution located at higher mass due to the additional present in the decay .
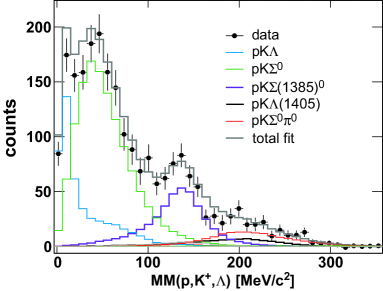
The experimental data presented here are not corrected for acceptance and efficiency. The histograms shown together with the experimental data correspond to full-scale simulations of relevant reaction channels with a hyperon in the final state which have been fitted to the data as described in EppleFabbietti:2011 ; the results of the fit are presented.
The most relevant channels visible in Fig. 2 are:
| (6) | |||
| (7) | |||
| (8) | |||
| (9) |
The missing mass distributions of the reactions (8) and (9) are almost identical and the statistics is limited in the missing mass range where their contributions is expected. This translates into a large uncertainty in the fitted result for the relative yield of these two channels and leads to a large error in the estimate of the production cross-section of the . On the other hand, the signal corresponding to the is more significant, due to the large branching ratio of the decay (7). The fit method discussed in EppleFabbietti:2011 allowed to extract a ratio for the and cross-section, where the large error is mainly due to the inaccuracy of the determination of the contribution. A slightly extended version of this analysis was carried out, where as an additional systematic check the nominal mass of the was assumed to be . Instead of considering the to ratio, the cross-section for the was estimated from the fit of the experimental data via the different simulated channels and found to be , while the results for the vary between and . The contribution of the can be suppressed by selecting in the distribution the region above (see Fig. 2). However, only counts are left after this selection and this statistics contain the contribution by the channels (7-9). Hence, an analysis of the line shape exploiting the neutral decay channel is not possible with this data sample. The uncertainty of the angular distribution of has been included in the systematic error of the production cross-section by considering the two extreme cases of an isotropic distribution for the and of the same angular distribution as measured for the S1385:2011 . The obtained cross-section for the has been utilized to calculate the relative contribution to the spectrum shown in Fig. 1 by the magenta histogram. The systematic uncertainties have been propagated accordingly. Note that the low contribution by the to the yield shown in Fig. 1 is correlated with the small branching ratio of channel (2).
Figure 1 c) shows the sum of the distributions from the two final states for experimental data and simulations. The good agreement between the corrected experimental data and the simulation (gray histogram, solid line) is obtained by simulating the as a relativistic s-wave Breit-Wigner distribution with a width of and a pole mass of . Using instead the nominal mass of results in the gray dashed histogram in Fig. 1 c) which fails obviously to describe the experimental peak structure. The difference is expressed by the two values of and respectively.
A good fit is also obtained, if the cross-section of the is not fixed and the is generated with its PDG values for mass and width. In this scenario the production cross-sections obtained for the and are approximately and respectively. The cross-section of the would then largely exceed the value of the cross-section extracted from the neutral decay analysis and also the measured cross-section for the () in the same data sample. This contradicts the findings at higher energies reported in Kle70 , where cross-sections of and are measured for the and hyperons, respectively, produced in p+p collisions at . These arguments strongly disfavor this second scenario. On the other hand, one should mention that, analog to the Söding mechanism So , interferences of resonant and non-resonant amplitudes with the same exit channel can cause an apparent shift of the peak of the spectral distribution without a change of the pole mass. Our efficiency and acceptance-corrected experimental data are hence a perfect tool to test different theoretical models.
II.2 Angular Distributions
The different sources contributing to the missing mass spectra shown in Fig. 1 have been studied in terms of their polar angle () in the p+p center of mass system. The results provide on the one hand constraints on possible production mechanisms of the and allow to compute the acceptance corrections. The polar angle of the missing momentum vector to the () system, , has been investigated. The resulting angular distribution of has been been divided into three intervals. Each of the three above resulting subsamples is treated in the same way as described for the angle integrated event sample, meaning that the simulated distributions of MM(K,p) have been fitted to the experimental ones. In the fits the polar angle distribution of the was assumed to be the same as reported in S1385:2011 , for the . Corrected experimental distributions like those in Fig. 1 have been obtained in each bin of . The cross-sections of the reactions 1-5 are the integrals of the simulated distributions. The results are plotted as a function of in Fig. 3. The shown systematic errors are obtained by varying the different selection cuts as described above by .
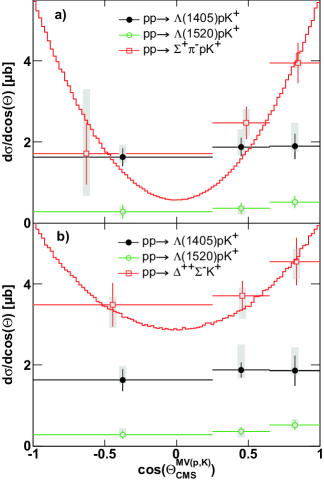
The results suggest that the yield in the mass region of the as well as the is produced rather isotropically, whereas the production in the channels (4) and (5) is anisotropic. The observed angular distributions have been included by folding the simulations of the reactions (4) and (5) with the red curves shown in panel a) and b) of Fig. 3 that represent Legendre polynomials of second degree. The and production has been simulated isotropically. These simulations have been used to produce the acceptance and efficiency corrections applied to the data shown in Figs. 1 and 3. The curvatures of the Legendre polynomials shown in panels a) and b) in Fig. 3 have been varied within and the simulations have been folded with the obtained angular distributions. The resulting uncertainty has been included in the systematic errors shown by the gray shaded boxes in Figs. 1 and 3.
The simulation model obtained from this analysis has been tested for several other observables and overall a good agreement with the experimental data is obtained NPA2011 .
Finally, our corrected spectra allow to extract cross-sections for the channels (1-5). This is again done by integrating the simulated spectra and using the statistical errors from the experimental data. We get the following values:
| (10) | |||
| (11) | |||
| (12) | |||
| (13) |
The first error gives the statistical error, the second one gives the systematic error from the normalization to the p+p elastic cross-section and the last error is obtained from the systematic variations mentioned above. As demonstrated in NPA2011 the total yield of the non-resonant contribution shown in Fig. 1 panel b) is attributed to the excitation of a resonance, while for the charge conjugated final state, the expected contribution by resonances can not be verified probably due to their large width.
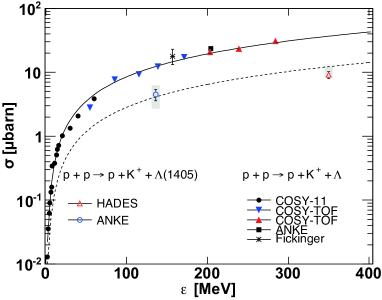
Figure 4 shows a compilation of the production cross-section as a function of the excess energy for the channels Wiss and L1405Anke . The solid curve shown in Fig. 4 corresponds to the parametrization of the production discussed in Wiss . The dashed curve has been obtained by scaling the parametrization by a factor . One can see that the dependence of the production cross-section upon the excess energy seems to follow the same behaviour as exhibited by production in p+p collisions.
III Summary
The and decay channels of the have been studied for the first time in p+p collisions at . These results can substantially contribute understanding the nature of which is considered as the key stone for the study of the interaction. The study of the spectral shape extracted from the decay into the channel was not possible, due to the limited statistics. The obtained results indicate a shift of the resonance in p+p reactions to values clearly below with a maximum of the mass distribution around for both decay channels. If one considers the values of the masses of the two and poles recently constrained more precisely by new data on kaonic-hydrogen Ike12 , our result suggests that in p+p collisions the contribution of the pole to the formation of the might be dominant.
The here presented mass distributions differ from the one measured in - and K-induced reactions Mor10 ; Hem85 and also from the measurement of the in p+p at 2.85GeV collisions L1405Anke and the corresponding theoretical study Gen08 . The fact that the spectra connected to the resonance strongly differ among different reactions could indicate that the production mechanism depends upon the entrance channel or that interference effects between the different channels contributing to the observed final state occur. One way or the other precise measurements exploiting different beams together with a theory able to describe at the same time all the experimental results are necessary to clarify the situation.
The angular distributions of the and in the CMS are rather isotropic, suggesting a large momentum transfer in the production mechanism. A total cross-section of was reconstructed, which is about a factor of two smaller than the cross-section extracted for the S1385:2011 . The comparison of the production cross-section with the systematics measured as a function of the excess energy for the final state shows that the two available data points are consistent with the phase-space trend measured for the production. A comparable production cross-section has been extracted for the reaction underlining the role played by resonances in the production mechanisms discussed here.
Considering the hypothesis that the might be a doorway for the formation of kaonic bound states, the results presented here are a necessary bench mark for theory to correctly address the formation of states like produced in p+p collisions further decaying into .
The HADES collaboration gratefully acknowledges the support by the grants LIP Coimbra, Coimbra (Portugal) PTDC/FIS/113339/2009, SIP JUC Cracow, Cracow (Poland): N N202 286038 28-JAN-2010 NN202198639 01-OCT-2010, FZ Dresden-Rossendorf (FZD), Dresden (Germany) BMBF 06DR9059D, TU M nchen, Garching (Germany) MLL München: DFG EClust 153, VH-NG-330 BMBF 06MT9156 TP5 GSI TMKrue 1012 NPI AS CR, Rez, Rez (Czech Republic) MSMT LC07050 GAASCR IAA100480803, USC - S. de Compostela, Santiago de Compostela (Spain) CPAN:CSD2007-00042, Goethe-University, Frankfurt (Germany): HA216/EMMI HIC for FAIR (LOEWE) BMBF:06FY9100I GSI F&E.
References
- (1) M. H. Alston et al., Phys. Rev. Lett 6, 698 (1961).
- (2) N. Kaiser, P.B. Siegel, and W. Weise, Nucl. Phys. A594 (1995) 325; E. Oset and A. Ramos, Nucl. Phys. A635 (1998) 99; B. Borasoy, U.G. Meißner, and R. Nißler, Phys. Rev. C74 (2006) 055201; T. Hyodo and W. Weise, Phys. Rev. C77 (2008) 035204.
- (3) J. Esmail, Y. Akaishi, and T. Yamazaki, Phys. Lett. B686, 23 (2010); J. Esmail, Y. Akaishi, and T. Yamazaki, Phys.Rev. C83, 055207 (2011).
- (4) M. Bazzi et al. (SIDDHARTA Coll.), Phys. Lett. B704, 113 (2011).
- (5) Y. Ikeda, T. Hyodo, and W. Weise, Phys. Lett. B706, 63 (2011).
- (6) J. C. Nacher, E. Oset, H. Toki, and A. Ramos. Phys. Lett. B455, 55 (1999).
- (7) K. Moriya et al. (CLAS Coll.), Nucl. Phys. A835, 325 (2010).
- (8) V. K. Magas, E. Oset, and A. Ramos, Phys. Rev. Lett. 95, 052301 (2005).
- (9) D. W. Thomas et al., Nucl. Phys. B56, 15 (1973).
- (10) R. J. Hemingway et al., Nucl. Phys. B253, 742 (1985).
- (11) I. Zychor et al. (ANKE Coll.), Phys. Lett. B660, 167 (2008).
- (12) G. Agakichiev et al. (HADES Coll.), Eur. Phys. J. A41, 243 (2009).
- (13) E. Oset, Phys. Lett. B455, 55 (1999).
- (14) G. Agakichiev et al. (HADES Coll.), Phys. Rev. C85, 035203 (2012).
- (15) J. Siebenson et al. (HADES Coll.), AIP Conf. Proc. Vol. 1322, 389 (2010).
- (16) E. Epple et. al. (HADES Coll.), Hyperfine Interact. 210, 1, 45 (2012).
- (17) G. Agakichiev et al. (HADES Coll.), Nucl. Phys. A881, 178 (2012).
- (18) S. Klein et al., Phys. Rev. D1, 3019 (1970).
- (19) P. Söding, Phys. Lett. 19, 702 (1966); P. A. S. Krass, Phys. Rev. 159, 1496 (1967); J. Pumplin, Phys. Rev. D3, 1859 (1970).
- (20) M. Abdel-Bary et al. (COSY-TOF Coll.), Eur. Phys. J. A46, 27 (2010).
- (21) Y. Ikeda, T. Hyodo, and W. Weise, Nucl. Phys. A881, 98 (2012).
- (22) L. S. Geng and E. Oset, Eur. Phys. J. A34, 405 (2007).