News from the Galactic suburbia: the chemical composition of the remote globular cluster NGC 2419 ††thanks: Based on data obtained at the W. M. Keck Observatory, which is operated as a scientific partnership among the California Institute of Technology, the University of California, and the National Aeronautics and Space Administration. The Observatory was made possible by the generous financial support of the W. M. Keck Foundation.
Abstract
We present the chemical analysis of 49 giant stars of the globular cluster NGC 2419, using medium resolution spectra collected with the multi-object spectrograph DEIMOS@Keck. Previous analysis of this cluster revealed a large dispersion in the line strength of the infrared Ca II triplet, suggesting an intrinsic star-to-star scatter in its Fe or Ca content. From our analysis, we assess that all the investigated stars share the same [Fe/H], [Ca/Fe] and [Ti/Fe] abundance ratios, while a large spread in Mg and K abundances is detected. The distribution of [Mg/Fe] is bimodal, with 40% of the observed targets having subsolar [Mg/Fe], down to [Mg/Fe]–1 dex, a level of Mg-deficiency never observed before in globular clusters. It is found that the large dispersion in Mg abundances is likely the main origin of the observed dispersion of the Ca II triplet lines strengths (that can be erroneously interpreted in terms of Fe or Ca abundance scatter) because Mg plays a relevant role in the atmosphere of giant stars as an electron donor. A strong depletion in the Mg abundance leads to an increase of the line strength of the Ca II triplet, due to the variation in the electronic pressure, at a constant Fe and Ca abundance. Finally, we detect an anti-correlation between Mg and K abundances, not easily explainable within the framework of the current nucleosynthesis models.
keywords:
stars: abundances – stars: atmospheres – stars: evolution – stars: Population II – (Galaxy:) globular clusters: individual (NGC 2419)1 Introduction
The old and metal-poor cluster NGC 2419 is by far the most luminous globular cluster (GC) residing in the outermost fringes of the Milky Way (MW) halo, times brighter than any other cluster having kpc, (see Galleti et al., 2007, for discussion and comparison with remote clusters in the halo of M31). This unusual feature, coupled with a half-light radius much larger than that of ordinary globulars of similar luminosity led several authors to the hypothesis that NGC 2419 can be the remnant of an originally larger system, like a nucleated dwarf galaxy (Mackey & van den Bergh, 2005; Brodie et al., 2011).
Since the kinematics and the stellar mass function of NGC 2419 are fully consistent with a typical GC made up of stars and stellar remnants (see Ibata et al., 2011a; Bellazzini et al., 2012, and references therein), the key test to establish the actual nature of the system is to search for inhomogeneities in the abundance of chemical elements heavier than Aluminium among member stars. A spread in the heavy elements up to the iron-peak group would indicate that the system was a site of chemical evolution driven by Supernovae (SNe), implying that, at the epoch of SNe explosions, the progenitor of NGC 2419 was sufficiently massive to retain their highly energetic ejecta (few; Baumgardt, Kroupa & Parmentier, 2008), hence it was likely a dwarf galaxy. On the other hand, GCs are observed to display virtually no spread in heavy elements and large (and correlated) spreads in light-elements (Na, O, Mg, Al, in particular), likely associated with a spread in He abundance (see Gratton, Carretta, Bragaglia, 2012, and references therein). These signatures are generally believed to trace early chemical evolution driven by much less energetic polluters than SNe, like massive Asymptotic Giant Branch stars (AGB D’Antona et al., 2002; D’Ercole et al., 2008) or Fast Rotating Massive Stars (FRMS, see Decressin et al., 2007a, b, and references therein), whose ejecta can be retained in systems in the plausible range of mass of proto-GCs. The anti-correlation between Na and O abundances is so ubiquitous in GCs (and non-existent in the field) that it has been proposed as a fundamental defining feature for globulars (with respect to open clusters and galaxies Carretta et al., 2010a).
The large distance of NGC 2419 (91 kpc Di Criscienzo et al., 2011a) has prevented the detailed spectroscopic analysis of a large sample of its stars, that is needed to perform this chemical test, until a couple of years ago111Shetrone et al. (2001) provided abundance analysis from high resolution spectroscopy for just one star of NGC 2419.. Recently Cohen et al. (2010, C10 hereafter) presented the analysis of medium-resolution Keck-DEIMOS spectra around the Calcium triplet (near 8600 Å, CaT) for 43 Red Giant Branch (RGB) stars of NGC 2419. Using other GCs of known [Fe/H] as calibrators and adopting a constant [Ca/Fe] value they translated the measured pseudo- Equivalent Width of CaT and the magnitude difference between the stars and the cluster Horizontal Branch (HB, V-VHB) into [Ca/H] values, as is usually done for [Fe/H] (see Rutledge, Hesser & Stetson, 1997; Battaglia et al., 2008; Starkenburg et al., 2010, and references therein). C10 found a significant spread in the [Ca/H] values derived with this method ([Ca/H]CaT hereafter): the distribution showed a strong peak at [Ca/H] and a long tail reaching [Ca/H]. This relatively large spread in a heavy element (Fe or Ca, see Starkenburg et al., 2010) was interpreted by C10 as providing additional support to the hypothesis that NGC 2419 “…is the remnant of a dwarf galaxy accreted long ago by the Milky Way…”. As a consistency check C10 obtained Fe and Ca abundances by spectral synthesis of Fe and Ca lines (other than CaT) that are present in their spectra. The puzzling result was that, while the Ca abundances are in reasonable agreement with those from CaT, no significant spread in Iron abundance was detected.
Available photometry is not of much help in settling this issue, since in this low metallicity regime the sensitivity of optical colours to variations of metallicity is pretty weak. Moreover, even if a tiny colour spread is observed along the RGB, a spread in metallicity is not necessarily the only viable explanation. Di Criscienzo et al. (2011b) used exquisite HST photometry to show that a small but significant colour spread is indeed detected at the base of the RGB, however this can be fully accounted for by the Helium spread that they invoke to reproduce the complex HB morphology of the cluster, within the classical scenario of multiple populations in GCs (Gratton, Carretta, Bragaglia, 2012).
Later Cohen, Huang & Kirby (2011, C11 hereafter) used high-resolution Keck-HIRES spectra to derive the detailed abundance of several chemical elements in seven bright RGB members of NGC 2419. Interestingly, (a) the stars studied by C11 do not display any spread in [Fe/H] and [Ca/Fe] in excess to what is expected from the observational uncertainties, and (b) the abundance pattern of these stars is very similar to what is observed in the classical metal-poor GC M30 (NGC 7099), residing in the inner halo of the MW ( kpc, kpc). One of the stars in the C11 sample (S1131), which is similar to the other six in all other aspects, was found to be extremely Mg-deficient ([Mg/Fe]=) and K-rich ([K/Fe]=), a strong anomaly never reported before, at least in Pop-II stars (see C11 for a detailed discussion). Hence, at present, the results of the chemical test on the nature of NGC 2419 are still not conclusive.
2 Observations
In this paper we analyse spectra collected with the DEIMOS multi-object slit spectrograph mounted on the Keck II telescope. This dataset includes spectra of stars located along the RGB and observed with the high-resolution 1200 line/mm grating coupled with the OG550 filter: the spectra cover the spectral range of 6500-9000 Å with a spectral resolution of 1.2 Å. Target selection, observations and the reduction procedure are described and discussed in full detail in I11a.
2.1 Metallicity from CaT
[Fe/H]CaT was derived by I11a for the stars observed with DEIMOS222I11a included in their sample also stars from the sample by Baumgardt et al. (2009), for which they took only the radial velocity estimate obtained by the same authors from HIRES spectra. from the pseudo-EW of the three CaT lines (suitably combined) and V-VHB (see I11a for details). Here we slightly revise these estimates by (a) adopting the most recent and reliable value for VHB, i.e. V from Di Criscienzo et al. (2011a) instead of from Harris (1996), as done in I11a, and (b) fully propagating all the observational errors into a final error in [Fe/H]CaT for each individual star. It is worth noting that there is only a tiny difference between the new [Fe/H]CaT and those published in I11a: the new [Fe/H]CaT are larger than the older ones by 0.037 dex on average, with a r.m.s. of just 0.0004 dex.
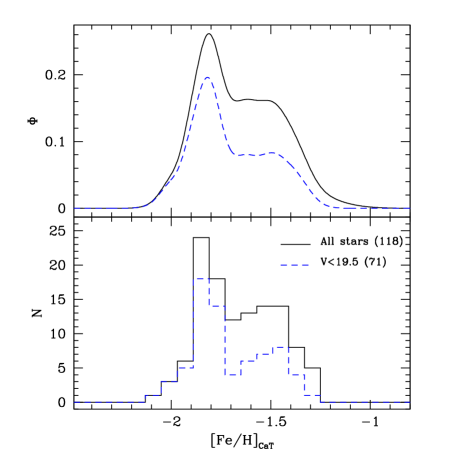
In I11a [Fe/H]CaT was used as an additional parameter to clean the kinematic sample from interlopers. While it was noted that there was a significant spread in [Fe/H]CaT, this result was neither quantitatively assessed nor discussed in detail. In Fig. 1 we present the metallicity distribution from CaT for the 118 stars from the most conservative sample of radial velocity members (their Sample A) having valid [Fe/H]CaT in I11a. The distribution is roughly similar to that shown by C10: there is a strong peak at [Fe/H] and an extended tail (with a possible shoulder at [Fe/H], not seen in the distribution by C10) extending up to [Fe/H]. Any subtle difference in the metallicity zero-point and in the shape of the distribution between this work and C10 can be ascribed to differences in the adopted calibration and in the sample size (118, or 71 stars, vs. 43). Hence we consider the agreement of our result with that of C10 as satisfying.
In the following, to quantitatively estimate the mean and the intrinsic spread () of a distribution in some elemental ratio [X/Y] (like, e.g. [Fe/H] or [Ca/Fe]) we adopt an algorithm that explores a grid of the ([X/Y],) space and searches for the couple of parameters that maximises the maximum likelihood (ML) function defined as
| (1) |
similar to what is currently done to estimate the mean velocity and velocity dispersion in kinematic samples (see, e.g. Martin et al., 2007; Walker et al., 2006). is the number of stars in the sample and , where [X/Y]i is the abundance of the individual star and [X/Y]err,i is its associated error. The advantage of this approach is that it automatically takes into account the observational errors, thus providing estimates of the intrinsic spread with the associated uncertainty (derived following Pryor & Meylan, 1993), a quantity that is especially valuable in the present contest. Although the adopted ML function is well suited for deriving the parameters of Gaussian distributions, it is clearly not a good approximation for the distribution shown in Fig. 1 (but it turns out to be quite appropriate for the subsequent applications, see Sect. 3). Nevertheless, it can provide a useful quantitative estimate of the intrinsic spread, that is dex, similar to the massive globular M54 that resides at the centre of the disrupting Sagittarius dwarf galaxy (Bellazzini et al., 2008; Carretta et al., 2010c). A KMM test333The test compares the likelihood of the data for a single gaussian model and a double gaussian model and provides the confidence level at which the single gaussian model can be rejected, see Ashman, Bird & Zepf (1994). (Ashman, Bird & Zepf, 1994), performed both on the whole sample or on the sub-sample of the brightest stars (), finds that a bimodal model is preferred to a unimodal model at the % confidence level, and the relative fraction of stars in the two populations is approximately 0.6 and 0.4.
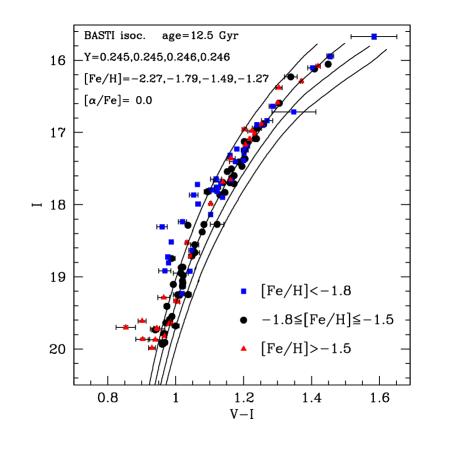
However, the Colour-Magnitude Diagram (CMD) of the target stars shown in Fig. 2 reveals that there are several stars that have virtually the same magnitude and color but that differ by more than 0.3 dex in [Fe/H]CaT. The adopted photometry is from the catalog assembled by Bellazzini (2007) from various sources; however B, V, I magnitudes for most of the target stars (and all the stars we analyse with spectral synthesis, below) are taken from the accurate absolute photometry by Stetson (2005). To further investigate this apparent inconsistency between [Fe/H]CaT and photometry, and having in mind the results by C10 and C11, we decided to perform a full spectral synthesis analysis on a subsample of stars of the I11a sample with high Signal-to-Noise Ratio (SNR). This analysis is described and discussed in the following sections.
3 Chemical analysis
Among the stars recognised as cluster members by I11a in their Sample A, we selected stars with sufficient SNR (typically SNR40 per pixel) to perform a reliable chemical analysis based on spectral synthesis. All the stars have V-band magnitude 18.8 and their position in the CMD is shown in Fig. 3. Even if the sample is clearly dominated by RGB stars, a few Asymptotic Giant Branch (AGB) stars are likely included. This is not expected to have any effect on the chemical analysis performed below.
3.1 Atmospheric parameters
The atmospheric parameters (, surface gravities and microturbulent velocities) of the target stars cannot be derived directly from the spectra (due to the low spectral resolution and the small number of available lines) and we estimated them from the photometry. Temperatures are computed by employing the empirical - transformation by Alonso, Arribas & Martinez-Roger (1999) based on the InfraRed Flux Method. The dereddened color is obtained assuming for all the stars a color excess of E(B-V)= 0.080.01 mag (Di Criscienzo et al., 2011a) and the exctinction law by McCall (2004). The Alonso, Arribas & Martinez-Roger (1999) relation for the colour is computed in the Johnson photometric system, thus, our I Cousin magnitudes have been converted into I Johnson magnitudes by following the prescriptions by Bessell (1979). Internal errors in due to the uncertainties in photometric data and reddening are of the order of about 30-50 K.
The surface gravities are computed through the Stefan-Boltzmann relation, assuming the photometric , and a typical mass of 0.75 , according to an isochrone from the BaSTI dataset (Pietrinferni et al., 2004) with age of 13 Gyr, Z=0.0003 and alpha-enhanced ([/Fe]= +0.4 dex) abundances patterns (see C10 and C11). For the luminosities, we used the dereddened V-band magnitudes with the bolometric corrections from Alonso, Arribas & Martinez-Roger (1999) and the distance modulus of 19.710.08 mag (Di Criscienzo et al., 2011a). The gravities can be determined within 0.05 dex by propagating the uncertainties in , evolutive mass (of the order of 0.05 ), distance modulus and photometry.
Finally, the microturbulent velocities are calculated by adopting the relation between and log g derived by Kirby et al. (2009): this relation provides values of of 1.8-2.0 km/s. Formally, the uncertainties in log g translate into a typical error in of 0.01 km/sec. Because the majority of the lines analysed here are located in the saturated/damped portion of the curve of growth, these lines are often sensitive to the photospheric velocity fields and we adopted a conservative (and more realistic) error of 0.2 km/s. The adopted atmospheric parameters for all the investigated targets are listed in Table 1.

3.2 Model atmospheres and linelist
We began the analysis by employing one-dimensional, LTE, plane-parallel geometry model atmospheres computed with the code ATLAS9 (originally developed by R. L. Kurucz) that treats the line opacity through the Opacity Distribution Functions (ODFs) method. The ATLAS9 models are computed by using the ODFs calculated by Castelli & Kurucz (2004) with [M/H]=–2 dex, -enhanced chemical patterns and without the inclusion of the approximate overshooting in the calculation of the convective flux. For some stars with abundance patterns that differ heavily from those adopted in the ODFs computation, specific model atmospheres are computed with the code ATLAS12 that employs the opacity sampling method and allows one to calculate model atmospheres with arbitrary chemical composition (see Castelli, 2005, for a detailed description of the handling of opacity by this code).
Adopting the photometric atmospheric parameters and a guessed metallicity value of [M/H]=–2 dex, we calculated synthetic spectra along the entire wavelength range of the observed spectra, including all the atomic and molecular transitions available in the last version of the Kurucz/Castelli linelist 444http://wwwuser.oat.ts.astro.it/castelli/linelists.html. All the synthetic spectra used for the analysis have been generated with the code SYNTHE in its Linux version (Sbordone et al., 2004; Sbordone, 2005) and convoluted with a gaussian profile to mimic the spectral resolution of the DEIMOS spectra.
We selected absorption lines that are unblended at the DEIMOS resolution and with the atmospheric parameters and metallicity of our targets. We included in our linelist 19 Fe I lines, 5 Ti I lines, the Mg I line at 8806.7 Å, the CaT line at 8542 and 8662 Å and the resonance K I line at 7699 Å (the other K I transition at 7665 Å being heavily blended with telluric absorption). Reference Solar values are from Grevesse & Sauval (1998).
3.3 Abundance analysis
The traditional derivation of abundances through the measured equivalent widths can be difficult in low resolution spectra, due to the line blanketing conditions that make the continuum location quite complex. Thus, we resort to the comparison with synthetic spectra including all the molecular and atomic transitions. Each selected line has been analysed independently by performing a -minimisation between the normalised spectrum and a grid of synthetic spectra within a spectral window centred around the line (in the case of DEIMOS spectra the typical width of the fitting window is 4-5 Å). The synthetic spectra were rebinned at the pixel-step (0.33 Å/pixel) of the observations. A preliminary normalisation of all the spectra is performed by fitting the entire spectrum with a Chebyshev polynomial. For each line, we adjusted locally the normalisation along a region of 60 Å around the line. When a first abundance is determined from minimisation, the spectrum is divided by the best-fit synthetic spectrum and the quotient spectra is fitted with a spline. The resulting spline is used to normalise again the observed spectrum and a new minimisation is performed (the same approach has been adopted also by Shetrone et al., 2009; Kirby et al., 2010).
To derive the Ca abundance we employed a slightly different methodology, by fitting not the entire line profile but only the wings of the two strongest components of the CaT, at 8552 and 8662 Å. The CaT line at 8498 Å has been excluded because its wings are marginally sensitive to the abundance, at variance to the other two lines that are located in the damped part of the curve of growth and they are more sensitive to abundance with respect to saturated lines. We excluded the core region of these features because (i) it is heavily saturated, (ii) it suffers from relevant departures from LTE, and (iii) its shape depends on the thermal stratification of the model atmosphere in the outermost atmospheric layers and basically the canonical one-dimensional model atmospheres are not able to describe well the thermal structure of the upper layers where the line core forms.
The K resonance line at 7699 Å suffers from departures from LTE conditions. Unfortunately, large grids of corrections as a function of the atmospheric parameters are not available for this transition. Takeda et al. (2009) and Andrievsky et al. (2010) provided abundances of [K/Fe] computed by including the departures from LTE for globular clusters and extreme metal-poor halo stars. The magnitude of their corrections agrees very well and, for the resonance line used in our work, the correction is quite small (see Fig. 6 in Takeda et al., 2009). Because of the small range of metallicity and of our targets, we decide to apply a unique value (–0.30 dex) of the NLTE correction for all the targets.
Concerning the CaT lines discussed here, NLTE corrections affect only the core of the lines (as pointed out by Spite et al. 2011, see their Fig. 1, but see also Starkenburg et al. 2010 and references therein), while their wings are not affected by the influence of the NLTE and can be used to derive reliable Ca abundances under the LTE assumption. Spite et al. (2011) derived Ca abundances of metal-poor stars by fitting the wings of the CaT lines with both LTE and NLTE profiles, finding that the effect of NLTE on the wings of these lines is negligible (less than 0.1 dex).
Uncertainties in the fitting procedure and in the atmospheric parameters were taken into account and added in quadrature (see Table 1). The uncertainty due to the fitting procedure is computed by resorting to MonteCarlo simulations: for each spectral line, Poissonian noise is injected in the best-fit synthetic spectrum (after the re-mapping at the pixel-scale of the observed spectrum) and re-analysed as described above. One hundred MonteCarlo events are computed for each line and the dispersion of the derived abundance distribution is taken to be the 1 uncertainty. Typically, the uncertainty in the fitting procedure ranges from 0.09 dex for SNR= 100 to 0.25 dex for SNR= 40. Only for the Ca abundances, the effect of the photon noise is quite small (0.02 dex for SNR= 100 and 0.05 dex for SNR= 40), because of the large number of pixels used in the minimisation.
For Fe, Ca and Ti (for which we have measures from different lines), we computed a weighted average abundance for each star by using the error from the MonteCarlo simulations as a weight; for the typical internal uncertainty we assumed the dispersion of the mean normalised to the root mean square of the number of used lines. For K and Mg (for which one only line is measured) we take the 1 level of the MonteCarlo distributions as the internal error for each line.
4 Chemical homogeneity and inhomogeneity in NGC 2419
The derived relative abundances of Fe, Mg, Ti, Ca and K for the target stars are reported in Table 1, together with the associated uncertainties. The first issue we want to focus on is the lack of spread in Fe and Ti abundance in our data. Adopting the ML algorithm we find with , and with . The agreement with the results by C11 is excellent as, with the same algorithm, we obtain with , and with , from their sample of seven stars555We have considered here the abundances derived by C11 from TiII lines. From TiI with .
A small intrinsic spread in [Ca/Fe] is detected, with , while from C11 we get with . The non-null spread in [Ca/Fe] found in our data may be partially due to an underestimate of the errors on the Ca abundance we derive from the wings of the CaT lines, since these lines are in a different part of the curve of growth with respect to all the other lines considered here. Correlation between uncertainties in Fe and Ca abundances may also play a role, as [Ca/Fe] appears to correlate with [Fe/H] even if the spread in [Fe/H] is not statistically significant, while the correlation between [Ca/H] and [Fe/H] is much weaker, if any. This view is supported by the fact that we do not detect an intrinsic spread in [Ca/H]: with . We conclude that the spread in Calcium abundance is absent or very small.
Contrary to Fe, Ca and Ti, large star-to-star spreads in the Mg and K content are detected among the stars of NGC 2419: with and with . As we shall see in detail below, a single gaussian model in not appropriate for the observed [Mg/Fe] and [K/Fe] distribution, since these are clearly bimodal. The average and intrinsic spread for [Mg/Fe] are in reasonable agreement with the C11 results ( with ; see Sect. 5, below).
C11 provides K abundance only for the anomalous star S1131. The discussion of the K abundances is deferred to Sect. 6.
The star Iba1183 was also observed by C11 (star S1209 in their sample): our is lower than that derived by C11 by 200 K and this difference arises mainly from the different colour- transformations and colour excess employed in the two studies. We found that the differences with respect to C11 are basically ascribable to the difference in ; only for Ca is the discrepancy large. Taking into account the corresponding iron abundances, our Ca abundance is higher than that found by C11 by 0.3 dex, and this difference is only partially explainable with the employed scales. We can suppose that the residual difference is due to the adopted Ca lines.
4.1 Metallicity from CaT in Mg-deficient atmosphere
The large intrinsic spreads in [Ca/H]CaT and in [Fe/H]CaT reported by C10 and I11a, respectively, and found again in Sect. 2.1, above, requires an additional discussion, since our spectral synthesis analysis, in fact, confirmed the results by C11, i.e. there is no intrinsic scatter in Iron abundance and just a small (if any) spread in Calcium.
The observed large variance of the CaT strength is not due to an Fe or Ca abundance spread but might be explained in light of the large range covered by the Mg abundance. In fact, Mg plays a relevant role in the opacity of cool stars, being one of the most important electron donors, contributing to the formation of the H- ions, the main source of opacity in these stars together with Fe, Al and the other -elements (the relative contribution of each element depends on the temperature, gravity and optical depth). A depletion of Mg implies a lower number of free electrons available to form H- ions, leading to a decrease of the H- opacity. The strength of the CaT lines increases, decreasing the electron pressure (as pointed out by Shetrone et al., 2009). Thus, a large depletion of the Mg abundance produces an increase of the strength of the CaT lines at fixed Ca and Fe abundance.
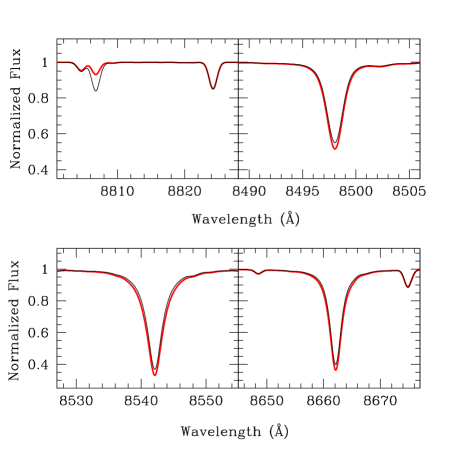
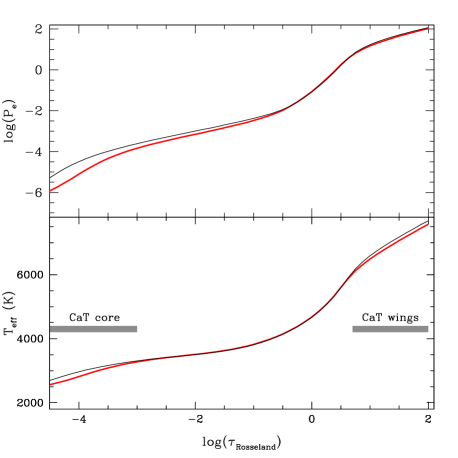
Fig. 4 shows the comparison of synthetic spectra around the Mg I line (first panel) and the three CaT lines computed by adopting ATLAS 12 model atmospheres with = 4200 K, log g= 0.6 and [M/H]=–2 dex, and with [Mg/Fe]=+0.4 dex and [Mg/Fe]=–1.0 dex (black and red line respectively). In the latter case, the strength of the CaT lines significantly increases with respect to the synthetic with [Mg/Fe]=+0.4 dex (note that the lines of elements other than Mg and Ca, that are also visible in the spectra, are identical in the two cases). We stress that the two synthetic spectra are identical in terms of overall metallicity, individual abundance patterns (in particular the same Fe and Ca abundances) and atmospheric parameter, and the only difference is in the Mg abundance. Fig. 5 illustrates the behaviour of the electronic pressure and of the temperature as a function of the Rosseland opacity for the two ATLAS 12 model atmospheres, where the differences in terms of and are appreciable (in particular in the outermost layers where the core of the CaT lines forms and in the deepest regions where the wings of CaT form).
.
As a confirmation of this effect, we detect a clear anti-correlation between our [Mg/Fe] abundance ratio and [Fe/H]CaT (Fig. 6). The iron-rich stars (with [Fe/H]–1.7) dex have [Mg/Fe]0 dex, and the bimodality in [Fe/H]CaT noted in Sect. 2.1 reflects the bimodal distribution of Mg abundance (see below).
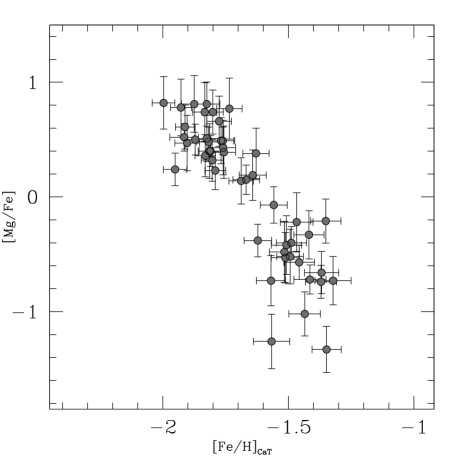
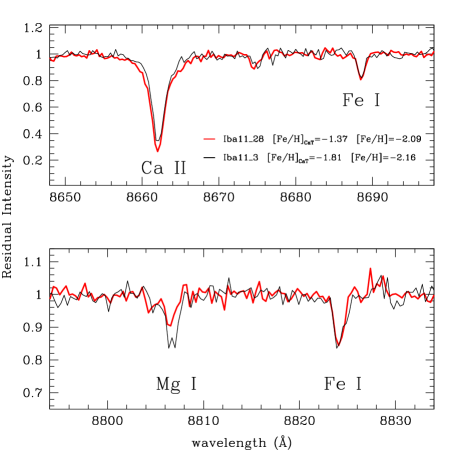
The link between the Mg abundance and the intensity of the CaT lines is appreciable also in Fig. 7 that compares portions of the spectra for the two target stars Iba1128 and Iba113 (red and black line respectively), that have very similar and log g (see Table 1) and different [Fe/H]CaT (by more than 0.4 dex, but indistinguishable Iron abundance as derived from Fe lines). The difference in the line strength of the CaT line at 8662 Å is evident (upper panel), as well as the difference in the Mg I line in the lower panel. On the other hand, the Fe I lines visible in the spectra are very similar to each other.
Note that the Ca abundances that we derived from spectral synthesis of the wings of the CaT lines take into account the effect of the Mg abundance: the wings were fitted by using synthetic spectra computed with the corresponding Mg abundance derived from our analysis 666For sake of completeness we repeated the analysis of all the stars with [Mg/Fe]–0.2 dex by using ATLAS 12 model atmospheres computed with the corresponding abundances. Basically, the difference with respect to the analysis performed with the ATLAS 9 models is of a few hundredths of dex.. When we repeated the fitting procedure by using only synthetic spectra with [Mg/Fe]=+0.4 dex (the value of the employed ODFs), the Ca abundance of the Mg-deficient stars are over-estimated by about 0.2–0.3 dex. This difference is smaller than the Ca abundance range found by C10 (spanning about 0.6-0.7 dex) because the measurement of the equivalent widths of these lines includes also the contribution of the line core, that is highly affected by the variation of the electronic density (see Fig. 4) but less sensitive to the Ca abundance.
The Mg depletion observed among the stars of the cluster might explain both the large distributions of [Ca/H]CaT by C10 and of [Fe/H]CaT by Ibata et al. (2011a). As additional confirmation of this interpretation, the Mg-poor star S1131 discussed by C11 has also one of the highest [Ca/H]CaT values in the whole C10 sample.
Finally, we stress that the strength of CaT lines depends on the global budget of the free electrons, thus, in addition to Mg, other elements that are electron donors in the atmospheres of cool stars can contribute to shape the CaT lines. In particular, the Al abundance deserves a note of caution, since in ordinary GCs [Al/Fe] anti-correlates with [Mg/Fe] (Gratton, Carretta, Bragaglia, 2012). In principle, an enhancement of Al abundance leads to an increase of the free electrons, that could counterbalance those lacking because of Mg depletion. This may be a source of concern for the interpretation of the abundance spreads derived from CaT presented above, since, unfortunately, we lack Al abundance for our target stars. We investigated the effect of different Al abundances (in the range [Al/Fe]) coupled with a Mg depletion ([Mg/Fe]=–1) on the strength of CaT lines, using suitable ATLAS12 model atmospheres. We found that the strength of CaT decreases appreciably only for [Al/Fe]1 dex, thus mitigating the effect of the Mg depletion only in this extreme regime. It is interesting to note that C11 finds an Al abundance much lower than this for the only Mg-deficient star in their sample, S1131 ([Al/Fe]). Assuming that this value is representative for the Al abundance in Mg-deficient stars of NGC 2419, the effect on the CaT lines should be negligible.
5 MAGNESIUM depletion
The stars in our sample appear to belong to two groups, according to their Mg abundance (see Fig. 6 and Fig. 9). A first group is more or less in the range covered by stars in other GCs, dex (Carretta et al., 2009). Consequently we will dub these stars Mg-normal. The second group is made of Mg-deficient stars having dex, a range usually not reached by stars in Galactic globulars (see below). The KMM test confirms that the [Mg/Fe] distribution is bimodal with a confidence level %. A fraction of 62% of the stars are attributed to the Mg-normal population, having dex, and the remaining 38% to the Mg-deficient population, having dex.
Intrinsic dispersions in the Mg abundance are usually observed in GCs and explained in the framework of self-enrichment processes, occurring in the early stages of GC evolution. The majority of the Milky Way GC stars for which Mg abundances are available covers a range from +0.2 to +0.5 dex, the only known cluster having Mg-deficient stars is NGC 2808, where three RGB stars with [Mg/Fe] between –0.3 and –0.1 dex have been detected (Carretta et al., 2009). Note that NGC 2808 is characterised by a huge Na-O anti-correlation, with the presence of super O-poor stars, and (likely) a wide and multi-modal distribution in He abundances (D’Antona et al., 2005; Piotto et al., 2007; Bragaglia et al., 2010). Also, two RGB stars with [Mg/Fe]=–0.21 and –0.31 dex have been measured in the Large Magellanic Cloud old GC NGC 1786 (Mucciarelli et al., 2009) and both the stars share a very large (–0.4 dex) depletion of [O/Fe]. Hence Mg-deficient stars are rare in GCs and seem to be linked to the hypothesised second generation of stars formed from the ejecta of massive AGB stars (D’Ercole et al., 2008) or FRMS (Decressin et al., 2007b) of the first generation, and characterised by high helium and sodium content and strong depletion of O and Mg (see Gratton, Carretta, Bragaglia, 2012, and references therein).
Recent analyses of the bimodal HB morphology of NGC 2419 (Dalessandro et al., 2008; Sandquist & Hess, 2008) show that a relevant fraction (30%) of the HB population is composed of extremely hot stars which have been tentatively interpreted as second-generation stars with high helium content (Y= 0.42) by Di Criscienzo et al. (2011b). The fraction of these extreme HB/Blue Hook stars is fairly similar to the fraction of Mg-deficient stars observed in our sample, and the postulated bimodality in the He content is intriguingly reminiscent of the bimodal distribution of [Mg/Fe] detected here.
However the range of [Mg/Fe] covered by our stars is much larger than anything ever seen before in any stellar system. Hence, while we will come back to discuss the possible physical origin of this feature in Sect. 8, it is worth discussing briefly some details of the analysis that may lead to erroneous estimates of [Mg/Fe].
In Fig. 7, it is clearly shown that large differences in the strength of Mg lines are observed in the spectra of stars with the same atmospheric parameters777The considered stars differ by just 23 in the adopted , by 0.02 dex in log g, and by 0.0 km s-1 in , that is significantly less than the uncertainties in each parameter., hence some factor other than a variation in these parameters should be responsible of the large star-to-star differences in Mg lines. This is confirmed also by the upper panels of Fig. 8, showing that there is no discernible trend between Mg abundance and and log g. Systematics in the estimates of the micro-turbulent velocity (the only atmospheric parameter that we cannot derive directly from photometry) does not seem able to produce spurious underestimates of the Mg abundance. In fact, the Mg lines for stars of similar and log g are distributed in both the linear and saturated portion of the curve of growth: the weakest lines (those with anomalous low Mg abundances) are those basically unaffected by the velocity fields. Changes in microturbulent velocities will change the Mg abundance for the Mg-rich stars but will have a small or negligible impact on the Mg-poor stars.
Furthermore, the lack of trend of [Mg/Fe] ratio as a function of and log g suggests that NLTE effects play a negligible role and they are not responsible for the observed Mg range. As pointed out by Merle et al. (2011), the NLTE corrections (in the sense -) of the Mg line for a giant star with [M/H]=–2 dex and -enhanced chemical mixture are negative, hence the application of the correction would lead to even lower Mg abundance for Mg-deficient stars.
In order to check the magnitude of the NLTE corrections for this Mg line, we calculated the departures from LTE by using a modified version of the NLTE radiative transfer code MULTI (Carlsson, 1986) and -poor MARCS model atmospheres (Gustafsson et al., 2008) with the typical parameters of our targets: = 4250 K, = 1.5 and [Fe/H]=–2. We used a simplified model atom of Mg I with 15 energy levels, 26 radiative bound-bound transitions and 91 electron collisional bound-bound transitions (the atomic data are the ones used in Merle et al., 2011). We assumed no contribution from inelastic collision with hydrogen: this will produce upper limits in NLTE abundance corrections. The magnitude of the corrections decreases for lower Mg abundances, because the line is formed progressively deeper in the photosphere, reducing the contribution of the core (where the deviations from LTE are more relevant): for [Mg/Fe]=–1 dex the NLTE correction is 0.1 dex and the line profile is basically the same under both LTE and NLTE assumptions, while the maximum correction (–0.35 dex) is for high Mg abundances. Thus, we can exclude that the very low [Mg/Fe] values are due to NLTE effects. On the other hand, proper NLTE corrections may lower the Mg abundance of the most Mg-rich stars in our sample, thus leading to an upper limit in the [Mg/Fe] distribution of NGC 2419 more similar to that observed in other Galactic GCs of comparable metallicity (see Fig. 10, below). Lacking a sufficiently fine grid of NLTE corrections we are forced to neglect this factor: the reader must be aware that the Mg abundance of stars having can be overestimated by 0.2-0.3 dex.
As a sanity check of the Mg indicator used here, we analysed the DEIMOS spectrum of the star S1131 (kindly provided by E. Kirby and J. Cohen) that C11 identify as Mg-poor through the measurements of other Mg lines. When the atmospheric parameters by C11 are adopted, we derive [Mg/Fe]=–0.350.13, in perfect agreement with the HIRES results. We note that our scale is slightly hotter than that used by C11 (due to the adopted reddening value and -colour transformations). Still, if we derive the atmospheric parameters for S1131 following the same procedure adopted for the stars in our sample, as described in Section 3.1, we obtain [Mg/Fe]=–0.270.13, again in good agreement with C11. We stress that the [Mg/Fe] estimates by C11 and by us for S1131 are based on different Mg lines and the slightly higher abundance derived from the Mg line at 8806.7 Å can be easily explained by taking into account the NLTE effects (note however that the two values are fully consistent within the errors, the actual difference being 0.08 dex).

Finally, we checked the impact of a strong helium enhancement and compare synthetic spectra computed by using ATLAS 12 model atmospheres with normal Y abundance (Y=0.24) and with Y= +0.4. The net effect of a high Y value is to make the lines deeper (especially for the strong features) but this effect is very small (typically less than 0.5% of the line depth computed with normal Y) and totally negligible in the analysis of real spectra. Note that the assumption of Y= +0.4 does not modify the line profile of the Mg I line at 8806.7 Å, thus we rule out that the strong depletion of Mg abundance is due to the effect of a very strong He enhancement.
Unfortunately, we cannot measure other elements involved in the chemical anti-correlations typical of GCs (Carretta et al., 2010a). O and Al cannot be detected at this spectral resolution, and the only Na transitions available in our spectral range are the doublet at 8183-94 Å, that is heavily contaminated by telluric lines (we highlight that the cleaning of telluric lines at this resolution can be quite imprecise). We cannot assess if the Mg depletion is linked to variations of the other light elements. However, the very large Mg distribution of NGC 2419 could be the clue of a peculiar star formation history of the cluster and indicate extremely extended anti-correlation patterns.
6 A Mg-K anticorrelation?
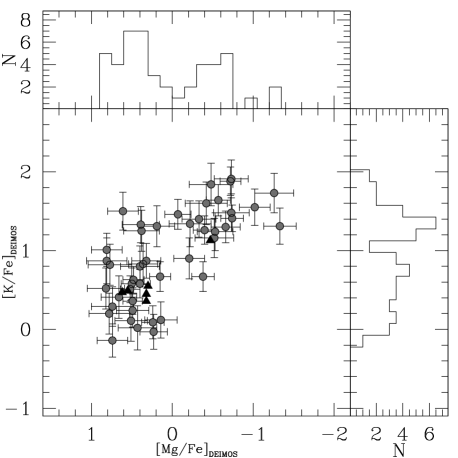
Fig. 9 displays the clear and significant anti-correlation between [Mg/Fe] and [K/Fe] that occurs in our sample. C11 dedicated a detailed description to their star S1131, labelled as “a star with a peculiar abundance pattern”, characterised by Mg depletion ([Mg/Fe]=–0.47 dex) and K enhancement ([K/Fe]= +1.13 dex). These abundances nicely match those obtained in our analysis (the stars analysed by C11 are plotted for reference in Fig. 9 as black triangles). Taking advantage of our sample of 49 stars, we can assess that this star is not an isolated case, but it belongs to a sub-population of stars in NGC 2419 characterised by sub-solar [Mg/Fe] ratios and high (1 dex) [K/Fe] ratios.
We investigated some technical reasons that may be able to mimic the observed anti-correlation.
-
1.
Contamination by telluric lines. The used K line is located near the red side of the telluric absorption A band, hence it may be prone to some contamination. We checked accurately for possible blending with telluric lines, by using as template the DEIMOS spectrum of a rapidly-rotating white dwarf. In all the spectra the K line is free from telluric lines. The Mg line is far from any telluric feature.
-
2.
Errors in the atmospheric parameters. Both the K and Mg abundance are virtually insensitive to the adopted gravity (at a level of 0.01 dex for a variation of log g=0.1). The abundances are more sensitive to the : a variation of 50 K translates into a variation of the Mg number density of 0.06 dex and of the K number density of 0.1 dex. The errors in can lead a correlation between the Mg and K abundances but are not able to mimic a spurious anti-correlation. In our analysis is not constrained spectroscopically (as is usually done) but we adopted an empirical relation between and log g. A variation of 0.2 km/s leads to a variation of 0.08 dex and 0.14 dex in Mg and K abundance respectively. Also in this case the errors run in the same direction and are not able to introduce an anti-correlation;
-
3.
Temperature scale. We checked the impact of a different scale, assuming the temperatures inferred by projecting the position of each target in the CMD on the best-fit isochrone (see Section 3.1). The average difference between the two scales is -=–97 K (= 52 K). The chemical analysis with this scale does not significantly change the observed dispersions both in Mg and K abundances, and does not erase the Mg-K anti-correlation.
-
4.
Departures from LTE. We applied a unique NLTE correction to all the targets, following the work by Takeda et al. (2009). The NLTE corrections are usually a function of the metallicity and the atmospheric parameters: we note that stars in our sample with the same parameters exhibit different K abundances, suggesting that our NLTE correction is not the cause of the large dispersion in the abundance of Potassium.
The two elements are mainly produced by massive stars: K comes from hydrostatic oxygen shell burning and explosive oxygen burning, while Mg is produced by hydrostatic carbon burning and explosive neon burning. However, it is noteworthy that the current yields for K are inadequate to reproduce the observed chemical patterns in the Milky Way (see Romano et al., 2010). Also, Mg is destroyed through the Mg-Al cycle of the hot CNO chain in AGB stars. However, production of K through the proton-capture on Argon nuclei could occur in the nucleosynthesis chains of massive AGB stars. Unfortunately the uncertainties related to the cross-sections of these reactions prevent any reliable predictions; preliminary computations indicate that a simultaneous variation of the initial Argon abundance and of the cross-section of the proton-Argon capture can produce ejecta as enriched in K as we observe in the atmosphere of the Mg-deficient stars (P.Ventura and F. D’Antona, private communication).
Takeda et al. (2009) identify two K-rich stars in GCs M 4 and M 13, coupled with emission components along the Hα line profile. These findings suggest an increase of the velocity fields in the upper photospheric layers where the core of the K I line at 7699 Å forms. On the other hand, C11 ruled out this hypothesis, because some stars with normal K abundances exhibit Hα emissions larger than those observed in the K-rich star S1131. Unfortunately, the setup of our spectra does not include the Hα line and we cannot check this possibility. In any case, a rise of the turbulent velocity field in the outermost layers of the photosphere should affect also the core of the Mg I at 8806.7 Å in a similar fashion.
Finally, we note that the two employed transitions have very different excitational potentials (0 and 4.34 eV for K and Mg line respectively), thus they formed in different photospheric layers. In fact, the formation of low- lines is favoured in external layers, due to the decrease of the temperature with depth, while high- transitions occur preferentially in the deepest photospheric regions. In particular, the wings of the two lines form at similar depths, while the formation depth of the core is shifted toward low , thus decreasing (for comparison see Fig. 13.4 in Gray, 1992). The K line forms in the outermost photospheric region where the thermal fluctuations can be relevant (in contrast to the Mg line that forms deeply). Also, temporal variations of the thermal structure of the photosphere cannot be excluded and they could introduce an additional scatter in K abundances but they do not totally explain the anti-correlation with Mg. In any case, the observed spread in Potassium requires an independent confirmation using other lines, as well as a search for the Mg-K anti-correlation in other clusters.
7 A comment about CaT
The CaT represents a widely used indicator of metallicity, especially for distant stellar populations, for which high SNR, high resolution spectra are not easy to achieve. Basically, the combined EW of the CaT lines is a function of the metallicity and it is interpreted in terms of [Ca/H] or [Fe/H] (see Starkenburg et al., 2010, and references therein).
From a theoretical point of view the strength of the CaT lines is sensitive to the abundance of Ca (of course) and Fe, but also to the abundance of those elements that affect the H- continuum opacity, through their contribution to the electronic density. Basically, the calibrations of the CaT EWs are referred only to cases where all -elements abundance patterns are described by an unique value: for instance, stars with the same level of enhancement of each -element. The [/Fe] value sets not only the abundance of each -element but also the free electron density, which has a relevant impact in the continuum opacity of cool stars (as discussed above). Spurious cases, where the -elements have largely different patterns to each other, are not taken into account in the usual CaT calibration, but, as demonstrated by the case of NGC 2419, they may lead to a wrong interpretation of the CaT strengths. In fact, the CaT can be used as a diagnostic of the metallicity only for stars with canonical chemical composition, while the method fails with stars with a peculiar or exotic chemical mixture, because the effective global budget of the free electrons is not taken into account.
Mg deficiencies as extreme as those observed here seem to be very rare in nearby stellar systems (see Fig. 10, below, and discussion in C11, Sect. 5 and Sect. 8). Therefore it is unlikely that their metallicity distributions derived from CaT are seriously biased by this effect. However, in principle, observed dispersions of CaT in GCs (or dwarf galaxies) can be due to (i) an intrinsic variation of Fe (under the assumption that all the stars share the same content), (ii) an intrinsic variation of Ca (under the assumption that the abundances of the electron donors do not vary from star to star), but also to (iii) an intrinsic dispersion of one (or more) of those elements that are electron donors. Hence, in deriving metallicities of individual stars from CaT lines, it seems advisable to counter-check also the abundance of Mg (which should be feasible to undertake in most cases, since the Mg I line at 8806.7 Å lies very close to the CaT), to validate the adopted calibration and avoid possible spurious effects as those described in Sect. 4.1.
8 Summary
The main results derived from the analysis of 49 giant stars in NGC 2419
are summarised as follows:
-
•
All the stars share the same iron content, with an average iron abundance of [Fe/H]=–2.090.02 dex (= 0.11 dex), where the observed dispersion is fully compatible with the uncertainties. Also, [Ca/Fe] and [Ti/Fe] turn out to be homogeneous;
-
•
NGC 2419 exhibits a large dispersion in the Mg abundance, reaching values of [Mg/Fe]–1 dex (unusual for GC stars). The large spread of Mg is likely the main origin of the observed dispersion of the CaT lines strength, previously interpreted as intrinsic dispersion in Ca or Fe. In fact, a Mg depletion leads to an increase of the equivalent widths of the CaT lines (at a constant Ca abundance). This effect is confirmed by the fact that the iron content inferred from the Ca triplet lines clearly anti-correlates with the Mg abundances. However, we bear in mind that the strength of the CaT lines suffers from the abundances of all the elements that are electron donors and the correct line profile for these lines should be derived by taking into account the global budget of the free electrons;
-
•
The [Mg/Fe] distribution is bimodal, with about 40% of the stars having sub-solar [Mg/Fe] abundance ratio. This fraction is similar to that suggested by Di Criscienzo et al. (2011b) for the extreme population stars with initial helium abundance of Y+0.4, according to the Horizontal Branch morphology of the cluster;
-
•
a very large spread in K content is detected among the stars of NGC 2419, spanning from solar values up to [K/Fe]2 dex, with a bimodal distribution. A clearcut anti-correlation between [Mg/Fe] and [K/Fe] is observed, in agreement with the results already found by C11 for the star S1131, that shows an unusual depletion of Mg coupled with a strong enhancement of K.
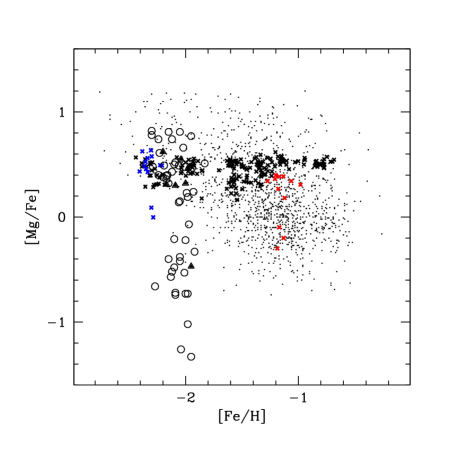
Fig. 10 provides a direct illustration of the extremely unusual abundance pattern of NGC 2419. The spread in [Mg/Fe] is unrivalled both in GCs and in dwarf galaxies. A strong depletion of Mg is generally interpreted as due to a significant contribution of ejecta from SNIa to the gas from which Mg-poor stars are formed (see Tsujimoto & Bekki, 2012, and references therein). Indeed, Fig. 10 shows that Mg-depletion with increasing metallicity is a common feature in dwarf spheroidal (dSph) galaxies and that [Mg/Fe] stars are not rare in those systems. Lemasle et al. (2012) reports that the two most metal-rich stars in their sample of red giants in the Carina dSph have [Mg/Fe], not far from the most Mg-deficient stars in our NGC 2419 sample. However, the Mg depletion in dSph (as in any other galaxies studied until now) is always coupled with an increase of [Fe/H]888As well as a star formation history lasting for a few Gyrs (Tolstoy, Hill, & Tosi, 2009), clearly not observed in NGC 2419 (Di Criscienzo et al., 2011b; Bellazzini et al., 2012)., since the whole effect is due to SNIa enriching the interstellar medium with material that is Fe-rich and poor in elements, thus reducing the [Mg/Fe] ratio with respect to the pattern previously set up by SNII (see Tolstoy, Hill, & Tosi, 2009, for a recent review). This clearly does not occur in NGC 2419 where stars in the range [Mg/Fe] are indistinguishable in terms of [Fe/H].
This fundamental observational fact, coupled with the analogy of the bi-modalities in [Mg/Fe] and HB morphology recalled above, suggest as more likely the possibility that the observed pattern was produced by the same processes that cause the Na-O anti-correlations, and other signatures of the early chemical enrichment that are peculiar to GCs (Carretta et al., 2010a; Gratton, Carretta, Bragaglia, 2012). Further support to this hypothesis is provided by the fact that Mg-deficient stars lie systematically to the red of Mg-normal stars along the RGB, in the V, U-V Colour-Magnitude Diagram (Lardo et al., in preparation). In the framework of anti-correlations in GCs, Mg-deficient stars should correspond to Na-rich (and O-poor) stars and it is a generally observed characteristic of GCs to have Na-rich RGB stars that are redder than their Na-poor counterparts in CMDs that include the U-band (see Lardo et al., 2011, for discussion and references). The colour difference is due to variations in the strength of CN and CH features at wavelengths lower than Å, that are driven by variation of C and N abundance, that, in turn, are correlated with the abundance of other light elements tracing the self-enrichment process in GCs (like Na and O, Sbordone et al., 2011).
Even if the observed Mg spread can be attributed to this kind of processes, the reason for the extreme behaviour of this cluster, as well as the origin of the Mg-K anti-correlation, remain unclear. This latter feature, if confirmed, may shed new light into the whole process of GC formation, possibly providing a tool that may help to discriminate between competing models of self-enrichment (D’Ercole et al., 2008; Decressin et al., 2007a, b). An obvious singular characteristic of NGC 2419 is its distance from the centre of the Galaxy. Is it possible that a low degree of interaction with - for instance - the gas rich disc of the Milky Way has favoured the retention of enriched material in this cluster. Bellazzini et al. (2012) found some indirect evidence for the cluster having a significant larger total mass in the past, as postulated by Di Criscienzo et al. (2011b) on completely a different basis: also a large total stellar mass may have played a role (but this is a general feature of models of GC formation accounting for the presence of multiple populations). In any case, this mysterious cluster does not cease to reveal new interesting features that makes it especially worthy of further study.
Acknowledgments
We warmly thank the anonymous referee for his/her suggestions in improving the paper. We are very grateful to several colleagues for useful discussions and precious suggestions, and/or for providing their own data for counter-checks and comparisons: Piercarlo Bonifacio, Angela Bragaglia, Eugenio Carretta, Judith Cohen, Franca D’Antona, Raffaele Gratton, Evan Kirby, Carlo Nipoti, Donatella Romano, Chris Sneden, Paolo Ventura. M.B. acknowledge the financial support of INAF through the PRIN-INAF 2009 grant assigned to the project Formation and evolution of massive star clusters, P.I.: R. Gratton. A.S. acknowledge the support of INAF through the 2010 postdoctoral fellowship grant. R.I. gratefully acknowledges support from the Agence Nationale de la Recherche though the grant POMMME (ANR 09-BLAN-0228). This research has made use of NASA’s Astrophysics Data System.
| ID | logg | [km s-1] | [Fe/H] | [Mg/Fe] | [K/Fe] | [Ti/Fe] | [Ca/Fe] | |
|---|---|---|---|---|---|---|---|---|
| Sun | — | — | — | 7.50 | 7.58 | 5.12 | 5.02 | 6.36 |
| Iba1154 | 3989 | 0.33 | 2.05 | -1.930.13 | 0.240.14 | 0.090.21 | 0.540.19 | 0.240.04 |
| Iba1129 | 4150 | 0.52 | 2.01 | -2.090.11 | 0.520.12 | 0.510.17 | 0.270.10 | 0.410.05 |
| Iba1183 | 4150 | 0.53 | 2.01 | -2.290.12 | 0.480.13 | 0.630.17 | 0.250.13 | 0.580.03 |
| Iba1157 | 4159 | 0.57 | 2.00 | -2.060.11 | 0.490.12 | 0.360.17 | 0.330.11 | 0.440.03 |
| Iba1128 | 4201 | 0.60 | 1.99 | -2.090.11 | -0.740.14 | 1.410.17 | 0.230.10 | 0.500.02 |
| Iba113 | 4224 | 0.62 | 1.99 | -2.160.13 | 0.400.13 | 0.580.18 | 0.250.15 | 0.530.02 |
| Iba1152 | 4216 | 0.63 | 1.99 | -2.050.11 | 0.150.13 | 0.670.19 | 0.050.11 | 0.440.03 |
| Iba1121 | 4323 | 0.72 | 1.96 | -2.050.12 | -0.380.14 | 0.670.19 | 0.210.14 | 0.440.02 |
| Iba1144 | 4274 | 0.72 | 1.96 | -2.150.11 | -0.400.14 | 1.260.18 | 0.250.13 | 0.550.03 |
| Iba11159 | 4381 | 0.80 | 1.95 | -2.090.13 | -0.720.13 | 1.880.18 | 0.360.12 | 0.550.04 |
| Iba1136 | 4387 | 0.88 | 1.93 | -2.130.12 | -0.570.15 | 1.640.20 | 0.500.13 | 0.560.03 |
| Iba11112 | 4380 | 0.88 | 1.93 | -1.970.13 | -0.070.16 | 1.460.19 | 0.250.10 | 0.370.03 |
| Iba11164 | 4414 | 0.91 | 1.92 | -2.100.12 | 0.500.13 | 0.580.20 | 0.340.16 | 0.430.05 |
| Iba1139 | 4309 | 0.90 | 1.92 | -2.170.16 | 0.360.18 | 0.830.26 | 0.220.26 | 0.410.05 |
| Iba116 | 4442 | 1.00 | 1.90 | -2.050.13 | 0.810.19 | 1.010.21 | 0.320.21 | 0.420.02 |
| Iba1182 | 4471 | 1.04 | 1.89 | -2.270.14 | -0.660.18 | 1.300.20 | 0.360.25 | 0.700.03 |
| Iba1135 | 4460 | 1.03 | 1.89 | -2.190.13 | 0.490.20 | 0.240.21 | 0.140.29 | 0.530.06 |
| Iba1151 | 4497 | 1.05 | 1.89 | -2.150.13 | 0.320.18 | 0.870.22 | 0.250.16 | 0.510.05 |
| Iba1145 | 4466 | 1.04 | 1.89 | -2.120.14 | 0.740.19 | -0.140.21 | 0.170.18 | 0.420.08 |
| Iba114 | 4497 | 1.07 | 1.88 | -1.990.13 | 0.230.17 | -0.030.22 | 0.030.14 | 0.330.03 |
| Iba11101 | 4567 | 1.10 | 1.88 | -1.980.14 | -1.020.19 | 1.550.23 | 0.120.12 | 0.430.05 |
| Iba117 | 4525 | 1.09 | 1.88 | -1.920.13 | -0.330.21 | 1.400.23 | 0.410.13 | 0.390.04 |
| Iba11160 | 4508 | 1.10 | 1.88 | -2.120.13 | -0.520.24 | 1.160.25 | 0.340.26 | 0.530.02 |
| Iba1166 | 4506 | 1.13 | 1.87 | -2.200.13 | 0.380.22 | 1.250.26 | 0.270.18 | 0.580.05 |
| Iba11119 | 4499 | 1.13 | 1.87 | -2.060.15 | 0.140.20 | 0.120.23 | 0.210.17 | 0.420.03 |
| Iba1172 | 4536 | 1.14 | 1.87 | -1.950.12 | -1.330.20 | 1.310.23 | 0.290.16 | 0.430.07 |
| Iba11121 | 4567 | 1.17 | 1.86 | -2.170.14 | 0.390.23 | 1.330.23 | 0.290.12 | 0.530.06 |
| Iba1132 | 4549 | 1.17 | 1.86 | -1.980.13 | -0.730.22 | 1.480.24 | 0.370.13 | 0.390.03 |
| Iba1143 | 4561 | 1.18 | 1.86 | -2.100.12 | -0.210.19 | 0.900.26 | 0.410.14 | 0.590.02 |
| Iba11148 | 4549 | 1.19 | 1.86 | -2.240.14 | 0.740.26 | 0.290.25 | 0.440.17 | 0.560.05 |
| Iba1189 | 4610 | 1.23 | 1.85 | -2.300.14 | 0.820.23 | 0.520.26 | 0.580.15 | 0.530.04 |
| Iba1196 | 4563 | 1.21 | 1.85 | -2.180.13 | – | 0.440.23 | 0.380.11 | 0.470.05 |
| Iba1111 | 4565 | 1.22 | 1.85 | -2.010.14 | -0.530.22 | 1.240.24 | 0.290.16 | 0.410.03 |
| Iba1188 | 4569 | 1.24 | 1.84 | -2.300.12 | 0.780.25 | 0.200.26 | 0.250.23 | 0.540.04 |
| Iba1169 | 4651 | 1.28 | 1.84 | -2.230.13 | 0.610.19 | 1.500.24 | 0.510.14 | 0.440.03 |
| Iba1110 | 4645 | 1.29 | 1.83 | -2.000.15 | -0.730.21 | 1.910.24 | 0.290.14 | 0.530.05 |
| Iba11134 | 4563 | 1.26 | 1.84 | -2.020.15 | 0.660.22 | 0.410.27 | 0.220.17 | 0.260.09 |
| Iba1174 | 4571 | 1.27 | 1.84 | -2.240.13 | 0.400.24 | 0.800.26 | 0.340.21 | 0.510.07 |
| Iba111 | 4618 | 1.30 | 1.83 | -1.830.13 | 0.510.20 | 0.110.26 | 0.180.17 | 0.140.08 |
| Iba11104 | 4598 | 1.29 | 1.83 | -1.980.14 | 0.190.22 | 1.310.26 | 0.220.22 | 0.360.03 |
| Iba1140 | 4581 | 1.31 | 1.83 | -2.040.13 | -1.260.24 | 1.730.25 | 0.280.13 | 0.480.05 |
| Iba1149 | 4643 | 1.35 | 1.82 | -2.100.15 | -0.480.27 | 1.840.27 | 0.270.23 | 0.530.03 |
| Iba1125 | 4667 | 1.37 | 1.81 | -2.050.13 | -0.420.26 | 1.600.27 | 0.050.16 | 0.460.07 |
| Iba1161 | 4645 | 1.37 | 1.81 | -2.140.15 | – | 1.080.27 | 0.470.18 | 0.400.11 |
| Iba11158 | 4626 | 1.38 | 1.81 | -1.950.13 | 0.770.27 | 0.820.26 | 0.190.14 | 0.330.06 |
| Iba1155 | 4641 | 1.40 | 1.81 | -2.120.13 | 0.430.24 | 0.020.28 | 0.090.19 | 0.480.05 |
| Iba11170 | 4737 | 1.44 | 1.80 | -1.940.13 | 0.470.24 | — | 0.380.14 | 0.180.08 |
| Iba1190 | 4651 | 1.41 | 1.81 | -2.000.13 | -0.220.26 | 1.340.29 | 0.210.19 | 0.460.03 |
| Iba1146 | 4645 | 1.41 | 1.81 | -2.150.13 | 0.810.25 | 0.870.29 | 0.430.12 | 0.390.06 |
References
- Alonso, Arribas & Martinez-Roger (1998) Alonso, A., Arribas, S., & Martinez-Roger, C., 1998, A&As, 131, 209
- Alonso, Arribas & Martinez-Roger (1999) Alonso, A., Arribas, S., & Martinez-Roger, C., 1999, A&As, 140, 261
- Andrievsky et al. (2010) Andrievsky, S. M., Spite, M., Korotin, S. A., Spite, F., Bonifacio, P., Cayrel, R., Francois, P., & Hill, V., 2010, A&A, 509, 88
- Ashman, Bird & Zepf (1994) Ashman, K.M., Bird, C.M., & Zepf, S.E., 1994, AJ, 108, 2348
- Battaglia et al. (2008) Battaglia, G., Irwin, M., Tolstoy, E., Hill, V., Helmi, A., Letarte, B., & Jablonka, P., 2008, 383, 183
- Baumgardt, Kroupa & Parmentier (2008) Baumgardt, H., Kroupa, P., & Parmentier, G., 2008, MNRAS, 384, 1231
- Baumgardt et al. (2009) Baumgardt, H., Ct̂é, P., Hilker, M., et al., 2009, MNRAS, 396, 2051
- Bellazzini (2007) Bellazzini, M., 2007, A&A, 473, 171
- Bellazzini et al. (2008) Bellazzini, M., Ibata, R.A., Chapman, S.C., Mackey, A.D., Monaco, L., Irwin, M.J., Martin, N.F., Lewis, G.F., Dalessandro, E., AJ, 136, 1147
- Bellazzini et al. (2012) Bellazzini, M., Dalessandro, E., Sollima, A., Ibata, R., 2012, MNRAS,
- Bessell (1979) Bessell, M. S., 1979, PASP, 91,589
- Bragaglia et al. (2010) Bragaglia, A., Carretta, E., Gratton, R., et al., 2010, ApJ, 720, L41
- Brodie et al. (2011) Brodie, J.P., Romanowski, A.J., Strader, J., Forbes, D.A., 2011, AJ, 142, 199
- Carlsson (1986) Carlsson, M., 1986, Uppsala Astronomical Observatory Reports, 33
- Carretta et al. (2009) Carretta, E., Bragaglia, A., Gratton, R., & Lucatello, S., 2009, A&A, 505, 139
- Carretta et al. (2010a) Carretta, E., Bragaglia, A., Gratton, R.G., Recio-Blanco, A., Lucatello, S., D’Orazi, V., Cassisi, S., 2010a, 516, 55
- Carretta et al. (2010b) Carretta, E., et al., 2010b, ApJ, 712, L21
- Carretta et al. (2010c) Carretta, E., et al., 2010c, A&A, 520, A95
- Castelli & Kurucz (2004) Castelli, F., & Kurucz, R. L., 2004, arXiv:astro-ph/0405087v1
- Castelli (2005) Castelli, F., 2005, MSAIS, 8, 25
- Cohen et al. (2010) Cohen, J. G., Kirby, E. N., Simon, J. D., & Geha, M., 2010, ApJ, 725, 288 (C10)
- Cohen, Huang & Kirby (2011) Cohen, J. G., Huang, W., & Kirby, E. N., 2011, ApJ, 740, 60 (C11)
- Dalessandro et al. (2008) Dalessandro, E., Lanzoni, B., Ferraro, F. R., Vespe, F., Bellazzini, M., & Rood, R. T., 2008, ApJ, 681, 311
- D’Antona et al. (2002) D’Antona, F., Caloi, V., Montalbán, J., Ventura, P., Gratton. R., 2002, A&A, 395, 69
- D’Antona et al. (2005) D’Antona, F., Bellazzini, M., Caloi, V., Fusi Pecci, F., Galleti, S., Rodd, R.T., 2005, ApJ , 631, 868
- D’Ercole et al. (2008) D’Ercole, A., Vesperini, E., D’Antona, F., McMillan, S. L., & Recchi, S., 2008, MNRAS, 391, 825
- Decressin et al. (2007a) Decressin, T., Meynet, G., Charbonnel. C., Prantzos, N., Ekström, S., 2007a, A&A, 464, 1029
- Decressin et al. (2007b) Decressin, T., Charbonnel. C., Meynet, G., 2007b, A&A, 475, 859
- Di Criscienzo et al. (2011a) Di Criscienzo, M. Greco, C., Ripepi, V., Clementini, G., Dall’Ora, M., Marconi, M., Musella, I., Federici, L., & Di Fabrizio, L., 2011, AJ, 141, 81
- Di Criscienzo et al. (2011b) Di Criscienzo, M., D’Antona, F., Milone, A. P., Ventura, P., Caloi, V., Carini, R., D’Ercole, A., Vesperini, E., & Piotto, G., 2011, MNRAS, 414, 3381
- Galleti et al. (2007) Galleti, S., Bellazzini, M., Federici, L., Buzzoni, A., Fusi Pecci, F., 2007, A&A, 471, 127
- Gratton, Carretta, Bragaglia (2012) Gratton, R., Carretta, E., Bragaglia, A., 2012, Astronomy and Astrophysics Rev., 20, 50
- Gray (1992) Gray, D. F., 1992, The Observation and analysis of stellar spectra, Cambridge Astrophys. Ser.
- Grevesse & Sauval (1998) Grevesse, N., & Sauval, A. J., 1998, Space Science Reviews, 85, 161
- Gustafsson et al. (2008) Gustafsson, B., Edvarsson, B., Eriksson, K., Jorgensen, U. G., Nordlund, A., & Plez, B., 2008, A&A, 486, 951
- Ibata et al. (2011a) Ibata, R., Sollima, A., Nipoti, C., Bellazzini, M., Chapman, S. C., & Dalessandro, E., 2011a, ApJ, 738, 186 (I11a)
- Ibata et al. (2011b) Ibata, R., Sollima, A., Nipoti, C., Bellazzini, M., Chapman, S. C., & Dalessandro, E., 2011b, ApJ, 743, 43
- Harris (1996) Harris, W.E., 1996, AJ, 112, 1487
- Kirby et al. (2009) Kirby, E., N., Guhathakurta, P., Bolte, M., Sneden, C., & Geha, M. C., 2009, ApJ, 705, 328
- Kirby et al. (2010) Kirby, E. N., Guhathakurta, P., Simon, J. D., Geha, M. C., Rockosi, C. M., Sneden, C., Cohen, J. G., Sohn, S. T., Majewski, S. R., & Siegel, M., 2010, ApJS, 191, 352
- Lardo et al. (2011) Lardo, C., Bellazzini, M., Pancino, E., Carretta, E., Bragaglia, A., Dalessandro, E., 2011, A&A, 525, A114
- Laird et al. (1988) Laird, J.B., Rupen, M.P., Carney, B.W., Latham, D.W., 1988, Aj, 96, 1908
- Lemasle et al. (2012) Lemasle, B., Hill, V., Tolstoy, E., et al., 2012, A&A, 538, A100
- McCall (2004) McCall, M. L., 2004, AJ, 128, 2144
- Mackey & van den Bergh (2005) Mackey, A.D., & van den Bergh, S., 2005, MNRAS, 360, 631
- Martin et al. (2007) Martin, N.F., Ibata, R.A., Chapman, S.C., Irwin, M., Lewis, G.F., 2007, MNRAS, 380, 281
- Merle et al. (2011) Merle, T., Thevenin, F., Pichon, B., & Bigot, L., 2011, MNRAS, 418, 863
- Mucciarelli et al. (2009) Mucciarelli, A., Origlia, L., Ferraro, F. R., & Pancino, E., 2009, ApJ, 695L, 134
- Pietrinferni et al. (2004) Pietrinferni, A., Cassisi, S., Salaris, M., & Castelli, F., 2004, ApJ, 612, 168
- Piotto et al. (2007) Piotto, G., Bedin, L.R., Anderson, J., et al., 2007, ApJ, 661, L53
- Pryor & Meylan (1993) Pryor, C., & Meylan, G., 1993, in Structure and Dynamics of Globular Clusters, S. Djorgovski and G. Meylan Eds., ASP Conf. Ser., 50, 357
- Romano et al. (2010) Romano, D., Karakas, A. I., Tosi, M., & Matteucci, F., 2010, A&A, 522, 32
- Rutledge, Hesser & Stetson (1997) Rutedge, G.A., Hesser, J.E., Stetson, P.B., 1997, PASP, 109, 907
- Sandquist & Hess (2008) Sandquist, E. L. & Hess, J. M., 2008, AJ, 136, 2259
- Sbordone et al. (2004) Sbordone, L., Bonifacio, P., Castelli, F., & Kurucz, R. L., 2004, MSAIS, 5, 93
- Sbordone (2005) Sbordone, L., 2005, MSAIS, 8, 61
- Sbordone et al. (2011) Sbordone, L., Salaris, M., Weiss, A., & Cassisi, S., 2011, A&A, 534, A9
- Shetrone et al. (2001) Shetrone, M. D., Coté, P., & Sargent, W. L. W., 2001, ApJ, 548, 592
- Shetrone et al. (2009) Shetrone, M. D., Siegel, M. H., Cook, D. O., & Bosler, T., 2009, AJ, 137, 62
- Spite et al. (2011) Spite, M., Spite, F., Bonifacio, P., Caffau, E., Andrievsky, S., Korotin, S., Cayrel, R., & Francois, P., 2011, sf2a.conf.353
- Starkenburg et al. (2010) Starkenburg, E., Hill V., Tolstoy, E., Gonzalez Hernandez, J. I., Irwin, M., Helmi, A., Battaglia, G., Jablonka, P., Tafelmeyer, M., Shetrone, M., Venn, K. & de Boer T., 2010, A&A, 513, 34
- Stetson (2005) Stetson, P.B., 2005, PASP, 117, 563
- Suntzeff, Kraft & Kinman (1988) Suntzeff, N. B., Kraft, R. P., Kinman, T. D., 1988, AJ, 95, 91
- Takeda et al. (2009) Takeda, Y., Kaneko, H., Matsumoto, N., Oshino, S., Ito, H., & Shibuya, T., 2009, PASJ, 61, 563
- Tolstoy, Hill, & Tosi (2009) Tolstoy, E., Hill, V., & Tosi, M., 2009, ARA&A, 47, 371
- Tsujimoto & Bekki (2012) Tsujimoto, T., Bekki, K., 2012, ApJ, 751, L35)
- Walker et al. (2006) Walker, M.G., Mateo, M., Olszewski, E.W., Bernstein, R., Wang, X., & Woodroofe, M., 2006, AJ, 131, 2114
- Willman & Strader (2012) Willman, B. & Strader, J., 2012, AJ, in press (arXiv1203.2608)