Spin density wave and superconductivity in CaFe1-xCoxAsF studied by nuclear magnetic resonance
Abstract
We performed nuclear magnetic resonance measurements to investigate the evolution of spin-density-wave (SDW) and superconducting (SC) states upon electron doping in CaFe1-xCoxAsF, which exhibits an intermediate phase diagram between those of LaFeAsO1-xFx and Ba(Fe1-xCox)2As2. We found that homogeneous coexistence of the incommensurate SDW and SC states occurs only in a narrow doping region around the crossover regime, which supports -wave symmetry. However, only the structural phase transition survives upon further doping, which agrees with predictions from orbital fluctuation theory. The transitional features upon electron doping imply that both spin and orbital fluctuations are involved in the superconducting mechanism.
pacs:
74.70. Xa, 74.25. Dw, 74.25. nj, 76.60. -kIn strongly correlated electron systems, electronic states in a crossover regime between antiferromagnetic (AF) and superconducting (SC) phases have attracted significant research interest. The problem has been often discussed in iron-based superconductors in which the AF and SC states can coexist homogeneously 1,2. In iron-based superconductors, most of the parent compounds are in AF phases at low temperatures. A representative AF spin configuration is a stripe-type spin-density-wave (SDW) state arising from nesting between electron and hole pockets 3. In a crossover regime, several theoretical investigations that support sign-reversal superconductivity () 4,5 have predicted that the order parameters of both incommensurate SDW and SC states are compatible, because only some parts of Fermi surfaces contribute to superconductivity 1.
Homogeneous coexistence of the AF and SC states has been suggested for Ba(Fe1-xCox)2As2 ( Ba122 ) 6,7 and CaFe1-xCoxAsF ( Ca1111 ) 8. The Ca1111 series is an oxygen-free 1111 compound 9-11 that has cylindrical Fermi surfaces 12 similar to those of LaFeAsO1-xFx ( La1111 ), and it exhibits an intermediate electronic phase diagram between those of the Ba122 13-15 and La1111 16,17 series. An overlap between the AF and SC domes decreases with increasing interlayer distance of FeAs planes; therefore, the Ba122 series has a large overlap, the Ca1111 series has a smaller one, and the La1111 series has no overlap. For the Ba122 series, the phase overlap is large because the optimal doping level for superconductivity is located at the phase boundary between the AF and SC phases. However, for the Ca1111 series, the phase overlap is smaller than that of the Ba122 series because the optimal doping level is away from the phase boundary 8. In addition, for the La1111 series, the SC phase is adjacent to the AF phase on the electronic phase diagram and thus there is no phase overlap 16,17. Recent nuclear magnetic resonance (NMR) measurements for the La1111 series suggest that the AF and SC phases are segregated on the electronic phase diagram 18. Although the coexistence of these phases has been suggested in the Ca1111 series, it is not certain whether the AF ordering in the crossover regime is of the same nature as that of the underdoped regime. To address this problem, it is important to investigate how a SDW state evolves upon electron doping. Therefore, we performed 75As (I=7/2) and 59Co (I=5/2) NMR measurements to investigate the evolution of the SDW and SC states upon doping in the Ca1111 series.
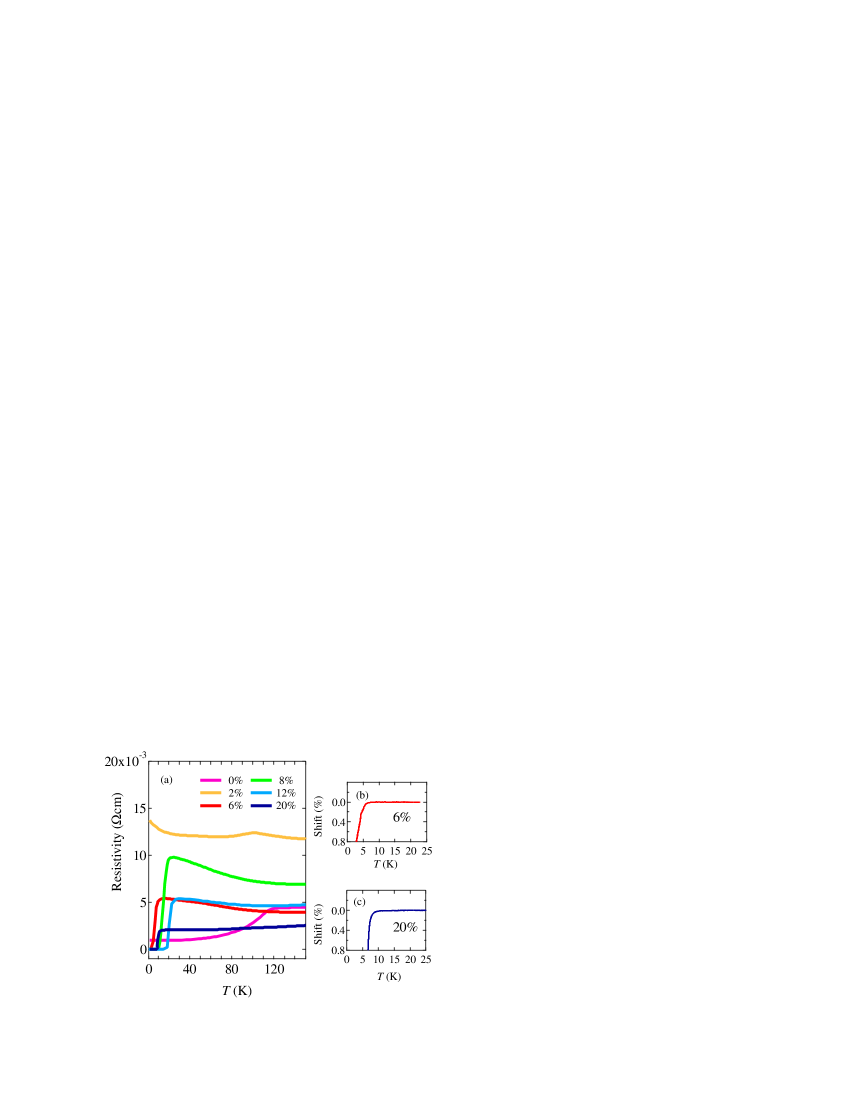
The temperature () dependence of the resistivity is shown in Fig. 1(a). Note that the tetragonal to orthogonal phase transition manifests as an anomaly for , and superconductivity appears for . In addition, the maximum is 23 K at . The SC dome determined from these resistivity measurements is shown in the electronic phase diagram ( Fig. 5) and will be discussed later. Moreover, the phase boundary between the AF and SC phases is around 0.06 0.07. Figures 1(b) and (c) show detuning of an NMR tank circuit for 0.06 and 0.20; note that superconductivity is robust even for 0.20.
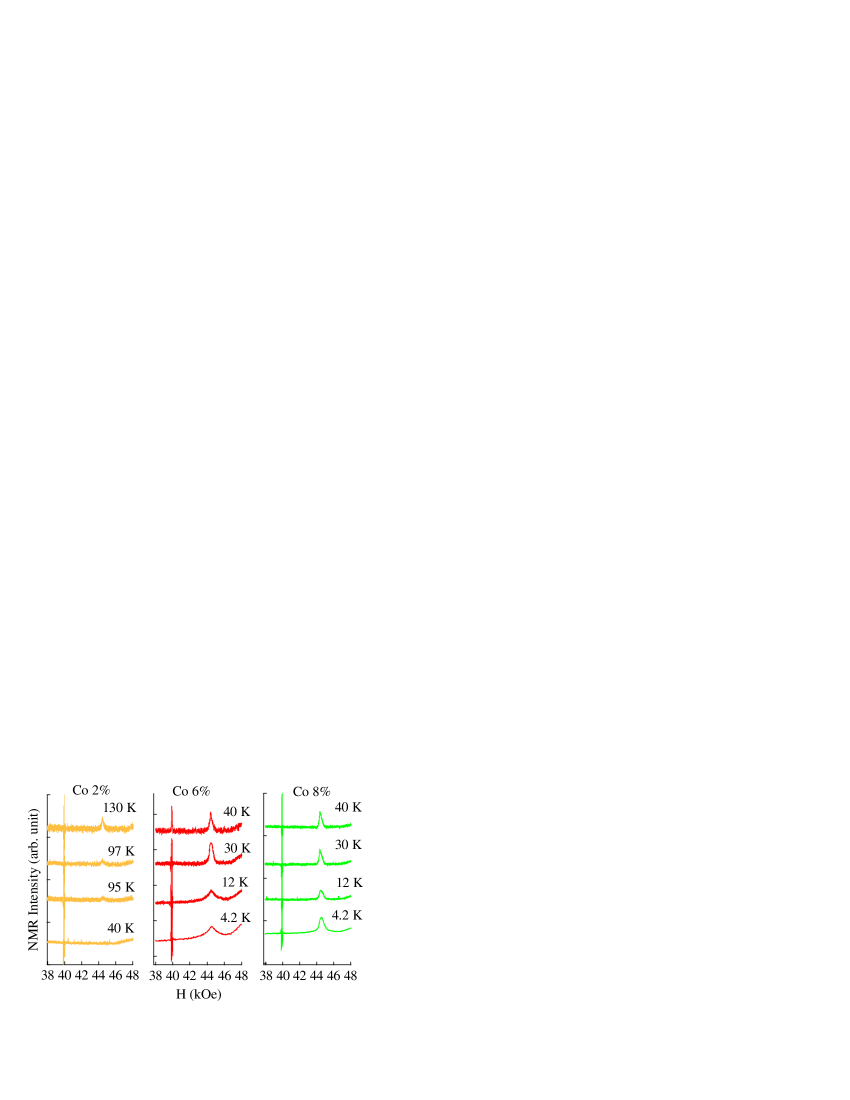
Figure 2 shows 59Co NMR spectra of CaFe1-xCoxAsF around the AF-SC phase boundary measured at 45.1 MHz. Homogeneous coexistence of the AF and SC phases was confirmed from the measurements for 8. In general, 59Co spectra should have four edges around the central peak corresponding to I= , however, only a single peak was observed in the paramagnetic ( PM ) and SC states because of some distribution of the electric field gradient ( EFG ). As shown in Fig. 2, a broad cusp-type powder pattern was observed at low temperatures for instead of a rectangle-type powder pattern, implying that a spatially modulated spin configuration or an incommensurate SDW ( IC-SDW ) state is formed instead of a commensurate SDW state. The internal field that Co nuclei experience because of the IC-SDW ordering is expressed as , where and 2 represent the wave vector and lattice length of the spin modulation, respectively. The values = 50 100 and = 6 kOe are estimated by simulating the powder pattern 8. For , the cusp-type spin configuration was not confirmed because a large internal field owning to some spin ordering wipes out the 59Co signals. Furthermore, the absence of the cusp-type pattern clearly indicates that the IC-SDW ordering no longer exists, because it results in 59Co signals which are free from the internal field and observable at the Larmor frequency. For , the line width remains narrow even at 4.2 K, indicating the absence of AF ordering. These results indicate that homogeneous coexistence occurs only in a narrow doping region.
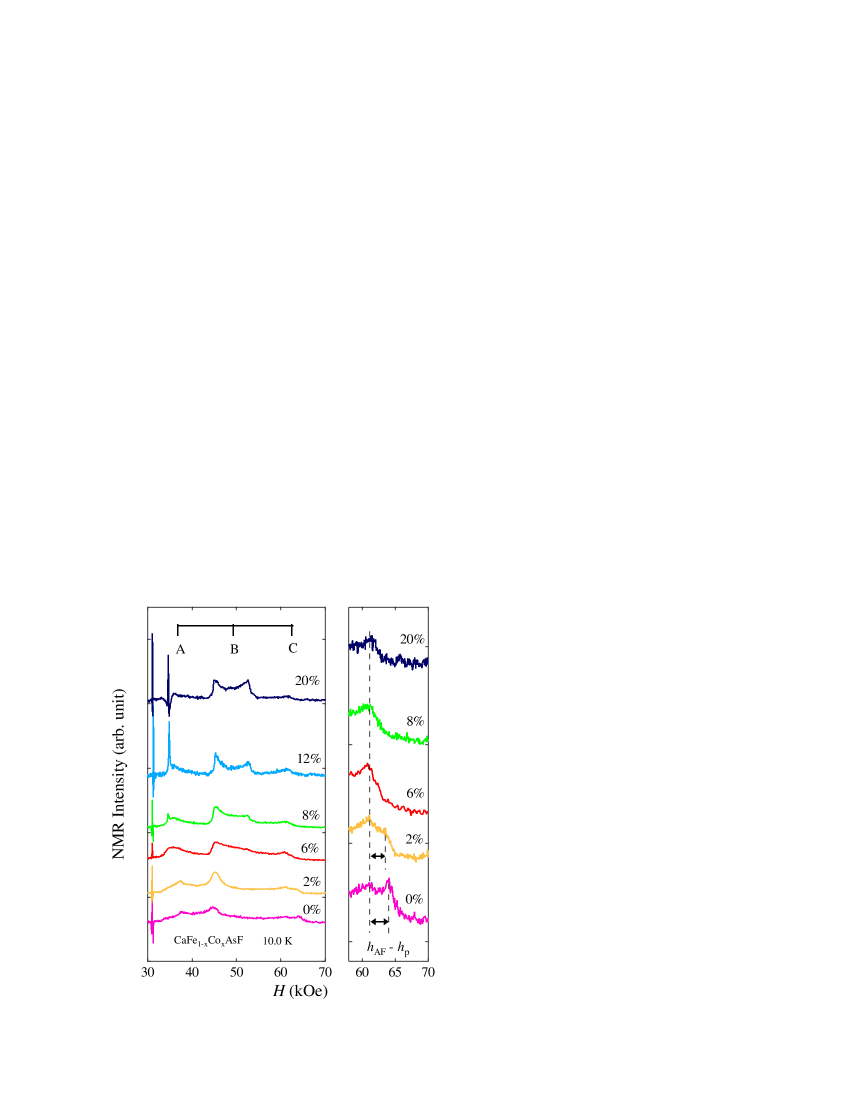
The evolution of the AF ordering upon electron doping is observable from 75As NMR measurements. Figure 3 shows field-swept 75As NMR spectra of CaFe1-xCoxAsF at 35.1 MHz and 10.0 K. For , a typical powder pattern for a PM state was observed, and sharp 59Co signals were observed at 35.1 kOe. Edges A, B and C represent transitions I = , I = , and I = , respectively. Two edges appear for I = because of a large second-order quadrupole effect similar to those observed in other iron-based pnictides. The higher-field edge disappears for , because the internal field arising from AF moments wipes out the signal. For the powder samples contributing to the lower-field edge, the internal field that As nuclei experience is perpendicular to the applied field; thus, As nuclei are not affected by the internal field. Therefore, the lower-field edge remains unchanged even in the AF state. Note that, throughout the series of the spectra, we hardly found phase segregation ranging in a wide doping regime as observed from muon spin rotation (-SR) measurements 19.
Other evidence of AF moments in CaFe1-xCoxAsF is the signals in the range 61 65 kOe, as shown by the arrows in the right panel of Fig. 3. When the direction of the applied field is expressed by the zenith angle in spherical polar coordinates where the axis ( the maximum principle axis of EFG at 75As ) is perpendicular to FeAs planes, the spectral intensity is given as
| (1) | |||||
| (2) |
where ( = 35.1 MHz) and the gyromagnetic ratio () of 75As is 7.292 MHz/10kOe. When converting frequency to magnetic field, one needs to multiply by the factor . When EFG anisotropy is absent, the PM signals corresponding to I = are given as
| (3) |
where MHz. Edges appear when , (i.e., ) is satisfied; thus, the field position is given as . This condition is unchanged even if the EFG anisotropy is nonzero. The edge at 61 kOe corresponds to , as shown in the right panel of Fig. 3. The samples that have FeAs planes parallel to the applied field contribute to the peak. In the case of a uniform AF state, the internal field is added to Eqs. (1) and (2). The spectral intensity is given as , where . The edge appears at , namely,
| (4) | |||
| (5) |
The edge is accompanied by an anomaly at the lower field , namely, at the edge position in a PM state. The spectral intensity at is . The span between and is shown by the arrows in the right panel of Fig. 3. When is small, approaches or overlaps . The value of = 3.24 kOe results in an internal field =24.5 kOe for , and = 2.35 kOe results in = 20.9 kOe for . The magnitude of the ordered moment is given as , where is the hyperfine field. Given that 26 kOe/ 20 and , is estimated to be 0.47 and 0.40 for and 0.02, respectively. For , a spatially uniform spin configuration results in a sharp edge at 64 kOe, implying a commensurate spin configuration. In addition, the amplitude for estimated from the neutron scattering measurements is 0.48 21, which agrees well with the present results. For , the commensurate spin configuration is maintained, although the magnitude of the spin moments is 80% of that for . For , spatial spin modulation results in the spectrum that no longer exhibits the sharp edge or given by Eqs. (4) and (5). Therefore, an incommensurate spin configuration is realized at a limited doping level, which is consistent with theoretical investigations 1,2.
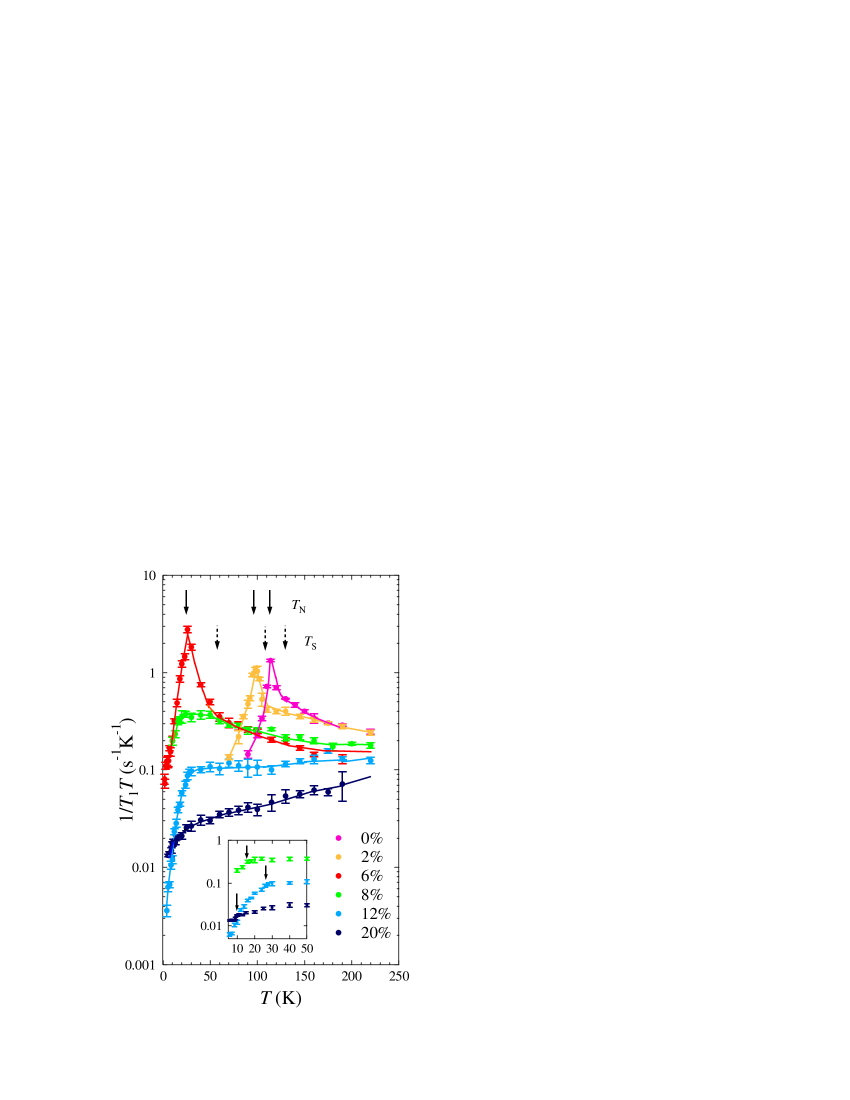
The relaxation time was measured using the conventional saturation-recovery method. The dependence of was measured at the lower-field edge ( 45 kOe) in the left panel of Fig. 3. Note that the bump or edge position is almost unchanged even for the AF phase. Therefore, is successively measured even in the AF phase with the same conditions as those for the PM phase. The procedure for obtaining was described in Ref. 8, and the dependence of is shown in Fig. 4. The AF transition temperature is confirmed as a peak of for (top arrows in Fig. 4). The onset temperature of an upturn in agrees well with the structural transition temperature determined from neutron scattering measurements 21. For , an upturn in is absent, and when compared with for , the development of the AF fluctuation is extremely suppressed and retains the same value down to . Therefore, for , the system undergoes a superconducting state without passing through the AF transition. This phenomenon is unique to the Ca1111 series. The maximum determined from is 25 K at , which is consistent with the resistivity measurements shown in Fig. 1. The dependence of is proportional to below . For , is clearly observable from the detuning of an NMR tank ciurcuit as shown in Fig. 1(c); however, it is not so clear from the dependence of .
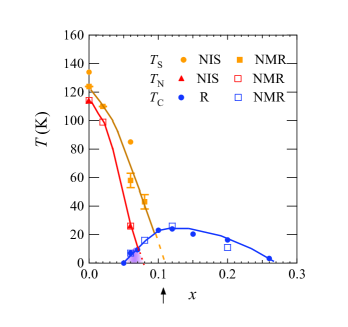
The relationship between quantum criticality and superconductivity is of broad interest in iron-based pnictides as well as other strongly correlated electron systems. In the Ba122 series, the quantum critical point (QCP) seems to be located at the optimal doping level 22, implying that spin fluctuation is important for the superconducting mechanism. Meanwhile, is very close to 13-15 and ultrasound absorption measurements have shown an anomaly in the elastic coefficient at 23, which suggests the importance of a phonon-electron coupling. It may be difficult to determine which of these mechanisms is really related to superconductivity only from the Ba122 series. Fortunately, the structural phase boundary of the Ca1111 series is more than 20 K higher than the AF boundary at most doping levels as seen in Fig. 4, which allows one to investigate whether the QCP is really related to superconductivity. Figure 5 shows the electronic phase diagram of the Ca1111 series. This figure illustrates that the AF phase vanishes at a low doping level (the QCP 0.08 ) prior to the emergence of superconductivity. Note that similar AF and SC domes have been observed in CaFe1-xRhxAsF 24; therefore, the phase diagram shown in Fig. 5 retains a universal feature common to different types of dopant ions. At the QCP, as shown in Fig. 4, hardly exhibits strong AF spin fluctuation, namely, Curie-Weiss behavior of expected from self-consistent renormalization (SCR) theory for a two-dimensional (2D) AF system () 25. Meanwhile, the structural transition survives upon considerable doping and the structural phase boundary crosses zero near the optimal doping level. These features are consistent with orbital fluctuation theory 26. As far as the Ba122 and Ca1111 series are concerned, the doping level at which the structural phase boundary crosses zero is more closely related to the optimal doping level than the QCP, although homogeneous coexistence predicted for -wave symmetry is likely to occur when the AF and SC phases overlap.
In summary, we measured NMR spectra and for CaFe1-xCoxAsF, which has intermediate electronic and magnetic properties between LaFeAsO1-xFx and Ba(Fe1-xCox)2As2. We demonstrated that a uniform IC-SDW + SC state, namely a spatially homogeneous state having both the IC-SDW and SC order parameters, occurs only in a limited doping regime near the phase boundary, which suggests -wave symmetry via spin fluctuation. However, the phase diagram is not completely explained by -wave symmetry: The optimal doping level does not agree with the QCP, but it agrees with the point at which the structural phase boundary crosses zero, which is expected from -wave symmetry via orbital fluctuation. These transitional features upon doping imply that both spin and orbital fluctuations are involved in the formation of superconductivity.
The NMR work is supported by a Grant-in-Aid (Grant No. KAKENHI 23340101) from the Ministry of Education, Science, and Culture, Japan. This work was supported in part by the JPSJ First Program. The authors would like to thank T. Nakano for experimental support.
References
- (1)
- (2) [1] A. B. Vorontsov, M. G. Vavilov, and A. V. Chubukov, Phys. Rev. B 79, 060508(R) (2009).
- (3) [2] R. M. Fernandes, and J. Schmalian, Phys. Rev. B 82, 014521(R) (2010).
- (4) [3] C. de la Crruz et. al., Nature (London) 453, 899 (2008).
- (5) [4] I. I. Mazin, D. J. Singh, M. D. Johannes, and M. H. Du, Phys. Rev. Lett. 101, 057003 (2008).
- (6) [5] K. Kuroki, S. Onari, R. Arita, H. Usui, Y. Tanaka, H. Kontani, and H. Aoki, Phys. Rev. Lett. 101, 087004 (2008).
- (7) [6] Y. Laplace, J. Bobroff, F. Rullier-Albenque, D. Colson, and A. Forget, Phys. Rev. B 80, 140501(R) (2009).
- (8) [7] M.-H. Julien, H. Mayaffre, M. Horvatić, C. Berthier, X. D. Zhang, W. Wu, G. F. Chen, N. L. Wang, and J. L. Luo, Europhyslett. 87, 37001 (2009).
- (9) [8] T. Nakano, S. Tsutsumi, N. Fujiwara, S. Matsuishi, and H. Hosono, Phys. Rev. B 83, 180508(R) (2011).
- (10) [9] S. Matsuishi, Y. Inoue, T. Nomura, H. Yanagi, M. Hirano, and H. Hosono, J. Am. Chem. Soc. 130, 14429 (2008).
- (11) [] T. Nomura, Y. Inoue, S. Matsuishi, M. Hirano, J. E. Kim, K. Kato, M. Takata, and H. Hosono, Supercond. Sci. Technol. 22, 055016 (2009).
- (12) [] M. Zhang, C. Zhang, Y. Yu, L. Zhang, Z. Qu, L. Ling, C. Xi, S. Tan and Y. Zhang, New Journal of Physics 12, 083050 (2010).
- (13) [12] I. R. Shein and A. L. Ivanovskii, JETP Letters, 88, 683 (2008).
- (14) [13] X. F. Wang et. al., New J. Phys. 11, 045003 (2009).
- (15) [14] C. Lester et. al., Phys. Rev. B 79, 144523 (2009).
- (16) [15] F. Rullier-Albenque et. al., Phys. Rev. Lett. 103, 057001 (2009).
- (17) [16] Y. Kamihara, T. Watanabe, M. Hirano,and H. Hosono, J. Am. Chem. Soc. 130, 3296 (2008).
- (18) [17] H. Luetkens et. al., Nature Materials, 8, 305 (2009).
- (19) [18] N. Fujiwara, T. Nakano, Y. Kamihara, and H. Hosono, Phys. Rev. B 85, 094501 (2012).
- (20) [19] S. Takeshita, R. Kadono, M. Hiraishi, M. Miyazaki, A. Koda, S. Matsuishi, and H. Hosono, Phys. Rev. Lett. 103, 027002 (2009).
- (21) [20] K. Kitagawa et. al., J. Phys. Soc. Jpn. 77, 114709 (2008).
- (22) [21] Y. Xiao et. al., Phys. Rev. B 79, 060504(R) (2009).
- (23) [22] S. Kasahara et. al., Phys. Rev. B 81, 184519 (2010).
- (24) [23] M. Yoshizawa, D. Kimura, T. Chiba, S. Simayi, Y. Nakanishi, K. Kihou, C. H. Lee, A. Iyo, H. Eisaki, M. Nakajima, and S. Uchida, J. Phys. Soc. Jpn. 81, 024604 (2012).
- (25) [24] T-L Xia and T-S Zhao, Supercond. Sci. Technol. 24, 095006 (2011).
- (26) [25] T. Moriya, and K. Ueda, Adv. Phys. 49, 555 (2000).
- (27) [26] H. Kontani, T. Saito, and S. Onari, Phys. Rev. B 84, 024528 (2011).
- (28)