Breakdown of Stokes-Einstein relation in the supercooled liquid state of phase change materials
Abstract
The application of amorphous chalcogenide alloys as data-storage media relies on their ability to undergo an extremely fast (10-100 ns) crystallization once heated at sufficiently high temperature. However, the peculiar features that make these materials so attractive for memory devices still lack a comprehensive microscopic understanding. By means of large scale molecular dynamics simulations, we demonstrate that the supercooled liquid of the prototypical compound GeTe shows a very high atomic mobility ( 10-6 cm2/s) down to temperatures close to the glass transition temperatures. This behavior leads to a breakdown of the Stokes-Einstein relation between the self-diffusion coefficient and the viscosity in the supercooled liquid. The results suggest that the fragility of the supercooled liquid is the key to understand the fast crystallization process in this class of materials.
I Introduction
Phase-change materials based on chalcogenide alloys are attracting a lot of interest due to their ability to undergo reversible and fast transitions between the amorphous and crystalline phases upon heating wuttig07 ; pirovano ; lacaita ; lencerReview ; welrev . This property is exploited in rewriteable optical media (DVD, Blu-Ray Discs) and phase change non volatile memories (PCM). The strong optical and electronic contrast between the crystal and the amorphous allows discriminating between the two phases that correspond to the two states of the memory. The PCM devices, first proposed by Ovshinsky in the late 1960’s ovshinsky , offer extremely fast programming, extended cycling endurance, good reliability and inexpensive, easy integration. A PCM is essentially a resistor of a thin film of a chalcogenide alloy (typically Ge2Sb2Te5, GST) with a low field resistance that changes by several orders of magnitude across the phase change. In memory operations, cell read out is performed at low bias. Programming the memory requires instead a relatively large current to heat up the chalcogenide and induce the phase change, either the melting of the crystal and subsequent amorphization (reset) or the recrystallization of the amorphous (set).
The key property that makes these materials suitable for applications in PCM is the high speed of the transformation which leads to full crystallization on the time scale of 10-100 ns upon Joule heating. What makes some chalcogenide alloys so special in this respect and so different from most amorphous semiconductors is, however, still a matter of debate.
In this paper, we demonstrate by means of atomistic molecular dynamics (MD) simulations that the phase change compound GeTe displays a very high mobility in the supercooled liquid phase down to very low temperatures leading to a breakdown of the Stokes-Einstein relation (SER) between diffusivity and viscosity . The breakdown of SER in the supercooled liquid phase, which is typical of a fragile liquid VTF , is actually the key to understand the fast crystallization behavior of these materials as discussed below.
Supercooled liquids are classified as fragile or strong on the basis of the temperature dependence of their viscosity VTF . An ideal strong liquid shows an Arrhenius behavior of the viscosity from the melting temperature Tm down to the glass transition temperature Tg. On the contrary, in a fragile liquid follows an Arrhenius behavior only above a cross-over temperature T∗ below which a Vogel-Tammann-Fulcher (VTF) function is customarily used to reproduce the data with , and To as fitting parameters VTF . The viscosity in a fragile liquid shows a steep rise by approaching Tg which according to the SER would lead to a strong decrease in the atomic mobility. On the other hand, the self diffusion coefficient controls both the speed of crystal growth and the steady state nucleation rate . In fact, classical nucleation theory nucl ; welrev predicts that and where is the free energy difference between the liquid (or amorphous) and the crystalline phases and is the formation free energy of the critical nucleus given in turn by with interface energy. is the driving force for crystallization that decreases by increasing temperature and finally vanishes at Tm. In phase change materials, due to the breakdown of SER, the diffusivity can be very high just above Tg in spite of a large viscosity. Consequently can reach high values at temperatures much lower than Tm where a large driving force for crystallization is present.
A breakdown of SER in GST has actually been suggested by recent measurements of the crystallization rate by Orava et al. orava . Still, further evidences of the breakdown of SER are needed to support the crucial assumptions made by Orava et al. to infer the viscosity from their only data of differential scanning calorimetry.
To this aim we performed MD simulations by using a classical interatomic potential NNGeTe we generated by fitting a large database of density functional energies by means of the Neural Network (NN) method introduced in Ref. behler . So far we have restricted ourselves to the binary compound GeTe which is also under scrutiny for applications in PCM and which shares most of the properties with the more commonly used GST lencerReview ; akola ; mazza . The NN potential displays an accuracy close to that of the underlying density functional theory (DFT) framework at a much reduced computational load that scales linearly with the size of the system. It allows us to simulate several thousands of atoms for tens of ns, which is well beyond present-day capabilities of DFT molecular dynamics.
II Computational details
The NN interatomic potential of GeTe was obtained in Ref. NNGeTe by fitting a huge database of DFT energies by means of the method introduced by Behler and Parrinello behler . The database consists of the total energies of about 30000 configurations of 64-, 96-, and 216-atom supercells computed by employing the the Perdew-Burke-Ernzerhof (PBE) exchange and correlation functional PBE and norm conserving pseudopotentials. The NN potential displays an accuracy close to that of the underlying DFT-PBE framework whose reliability in describing structural and dynamical properties of GeTe and other phase change materials has been validated in several previous works by our NNGeTe ; mazza ; apl and other groups akola .
The simulations were performed with the NN code RuNNer RuNNer and a 4096-atom cubic supercell by using the DLPOLY dlpoly code as MD driver. The time step was set to 2 fs, and constant temperature was enforced by a stochastic thermostat bussi .
It turned out that in order to reproduce the equilibrium density of the liquid at Tm, an empirical van der Waals (vdW) correction had to be added to the NN potential. This was done by using the scheme proposed by Grimme grimme with the parameter tuned to 0.55 to reproduce the experimental equilibrium volume of the liquid at Tmexpliquid . The experimental equilibrium volume of the amorphous and crystalline phases are instead well reproduced by the NN potential without the need of the vdW interaction NNGeTe . The inability of the NN potential in reproducing the equilibrium volume of the liquid can be traced back to the presence of nanovoids in the melt akola . In the liquid the nanovoids can coalesce and increase in size by decreasing the density which results into a reduced tensile stress upon expansion. This effect is hindered by vdW interactions. Nanovoids are also present in the amorphous phase akola , but their distribution can not change with temperature because of the low atomic mobility in the amorphous phase. The calculated linear thermal expansion coefficient (=) of the liquid at Tm with the NN+vdW potential turned out to be 4.73 10-5 K-1 to be compared with the experimental value of 3.73 10-5 K-1 expliquid .
The added vdW interaction acts just as a volume dependent term in the equation of state of the liquid but it is not included in the MD simulations discussed below. DFT calculations of the self-diffusion coefficient at two selected temperatures were performed by molecular dynamics simulations within the Born-Oppenheimer approach by using the code CP2K cp2k ; Kohn-Sham orbitals were expanded in a Triple-Zeta-Valence plus Polarization Gaussian-type basis set and the charge density was expanded in a planewave basis set with a cut-off of 100 Ry to efficiently solve the Poisson equation within the Quickstep scheme cp2k . Goedecker-type pseudopotentials GTH with four and six valence electrons were used for Ge and Te, respectively. Brillouin Zone integration was restricted to the point of the 216-atom supercell. The same framework was used in our previous DFT molecular dynamics simulations of GeTe NNGeTe ; mazza .
III Results
To study the properties of the supercooled liquid, we first assessed the ability of the NN potential, and thus of the underlying DFT-PBE framework, to reproduce Tm. The melting temperature was computed by means of thermodynamic integration thermointeg that yielded Tm=1001 K very close to the experimental value at normal pressure of 998 K Tmelt . To obtain Tm, we first computed the difference in the Helmholtz free energy between the NN system and a reference system for which an analytic expression for is known, at a given temperature and density . Namely
| (1) |
where the average is taken over a MD simulation with the potential . The temperature and density were set to the experimental values at the melting point at normal conditions Tmelt . The reference system was chosen as an Einstein crystal for the solid and a Lennard-Jones fluid LJ for the liquid. In the next step, the chemical potentials were evaluated by integrating the free energy as a function of density starting from ghiringhelli
| (2) |
where is the number of particles in the simulation cell, and the parameters , and were obtained by fitting the pressure dependence of the density using
| (3) |
By equating the chemical potential of the two phases one obtains a transition pressure of -0.44 GPa at the chosen temperature T′=998 K. From the calculated Clausius-Clapeyron equation (=6.85 K/GPa from the calculated = and on the theoretical melting line at T=998 K) we then obtained the theoretical melting temperature at normal pressure which is Tm=1001 K.
We then analyzed the properties of the supercooled liquid below Tm by computing independently and in microcanonical MD simulations. The volume of the supercooled liquid was scaled with temperature according to the thermal expansion coefficient ( is little dependent on temperature) given in Sec. II. We scaled the temperature from 1000 K to 500 K in eleven steps. At each step the system is equilibrated for 25 ps with the thermostat. Overall the system is thus quenched from 1000 K to 500 K in 250 ps. At each temperature statistical averages are then collected on microcanonical simulations up to 2 ns long for the calculation of the viscosity as discussed below.
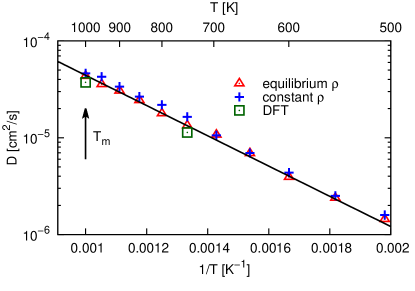
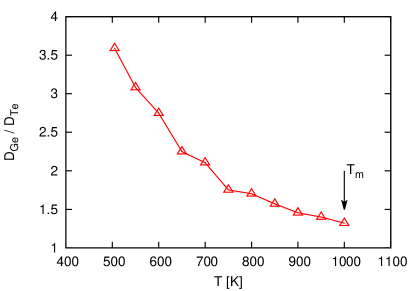
We first computed from the atomic mean square displacement on the time scale of 50 ps on which the system does not crystallize at any temperature we considered. The values of as a function of temperature are reported in Fig. 1a. is still of the order of 10-6 cm2/s at the lowest temperature of 505 K considered here; it follows an Arrhenius behavior from Tm to 505 K. The activation energy is 0.220 0.002 eV, a value much lower than the activation energy of 1.76 eV obtained from the Arrhenius dependence of viscosity in GST measured in the temperature range 333-373 K (probably below Tg) otheramorphous . The ratio between the self-diffusion coefficient of Ge and Te () increases by decreasing temperature as shown in Fig. 2. The values of obtained from the NN simulations were also validated by direct DFT molecular dynamics simulations at few selected temperatures with a small 216-atom cell (cf. Fig. 1a). The DFT result at 1000 K is equal to that previously obtained in Ref. akola with the same cell and functional used here. We checked that the change of volume with temperature has a little effect on the diffusion coefficient as shown in Fig. 1a which also reports the values of as a function of temperature once the density is fixed to the value at the melting point.
We then computed between Tm and a temperature T∗=700 K which turned out to be our crossover temperature by means of the Green-Kubo (GK) formula thermointeg
| (4) |
where is the off diagonal component of the stress tensor and the supercell volume. The integral in Eq. 4 is converged by restricting the integration time to 60 ps due to the decay of the self-correlation function above T∗. However, long simulation times up to 2 ns are needed to converge the average () over different initial times .
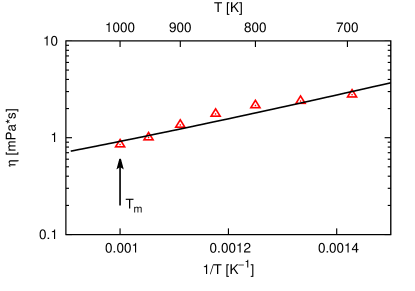
Above T∗ the viscosity can be described by a simple Arrhenius (Fig. 1b) function with an activation energy of 0.17 0.035 eV, very close to the value of 0.2 eV measured experimentally for the Ge0.15Te0.85 eutectic alloy above Tmeutectic . For the GeTe composition, experimental values of are available only at 1000 K yielding =2.59 mPas which is twice as large as our result (cf. Fig. 1b). This discrepancy is not due to the NN potential but possibly to limitations of the underlying DFT framework. Previous works on GeSe2 have indeed shown that different choices of the exchange and correlation functional affect the dynamical properties of the liquid phase massobrio . The viscosity can be computed from the GK formula only above T∗ since at lower temperatures the system crystallizes spontaneously on the time scale of few hundreds of ps which is not long enough to get the value of converged from Eq. 4. In the supercooled liquid, can not be defined on a time scale longer than the crystallization time which in GeTe is very short in the temperature range 500-700 K.
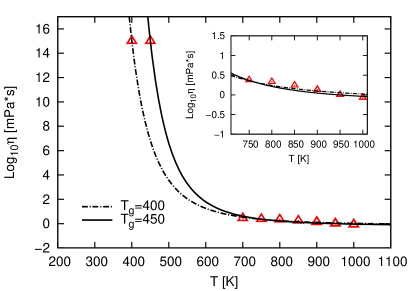
We thus attempted to extrapolate below T∗ by a VTF-like function with the constraint of matching the typical value of 1015 mPa s expected at Tg VTF . Unfortunately, a reliable value of Tg for is not available from experiments because of the fast crystallization of GeTe, and its theoretical estimate from simulations is difficult. Experimental data on Tg are available for the better glass formers GexTe(1-x) alloys with =0.15-0.23 derew . By a linear extrapolation with x of these latter data on Tg one obtains Tg=511 K for =0.5 which is probably too high. On the other hand, Tg is customarily assumed to be slightly below the crystallization temperature, that is about 450 K in GeTe raoux . We then used the function proposed in VTFLarge that allows fitting over a wider range of temperatures
| (5) |
where and are fitting parameters. In Eq. 5 =1015 mPa s at Tg.
The parameter is is the fragility index of the supercooled liquid defined by the logarithmic derivative of at Tg, . We performed two fittings for two values of Tg as shown in Fig. 3: the first with Tg=450 K that yields =111 (=-0.18), and a second one with a somehow lower temperature Tg=400 K which yields a very similar value of =104 (=-0.15). Similar results are obtained by using the modified VFT function proposed in Ref. VTFnew2 . Our data on viscosity above T∗ are thus consistent with a high fragility of the supercooled liquid. For sake of comparison we remark that =20 in silica which is a typical strong liquid while =191 in PVC which is a typical fragile liquid bohmer . Unfortunately, due to the lack of data on below T∗ and the uncertainties in the value of Tg, we can not assign accurately the degree of fragility. Nevertheless, even for a value of as large as 100, the viscosity rises too steeply in the range 500-600 K to be consistent with the calculated values of and the application of SER. In fact, the SER actually breaks down at T T∗ as discussed below.
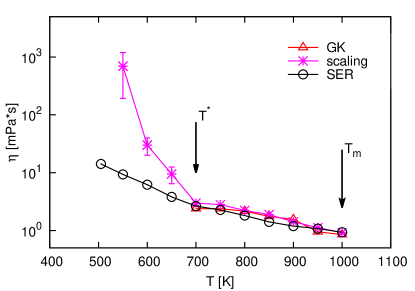
In the hydrodynamic regime when the SER holds it is actually possible to estimate the viscosity on the shorter time scale of 50 ps by a finite size scaling analysis of the self-diffusion coefficient. The viscosity can be obtained from the scaling of with the edge of the cubic simulation cell as artscaling
| (6) |
We considered three cubic models with 512, 1728 or 4096 atoms. By applying Eq. 6 above T∗, we obtained values for very close to the GK data (Fig. 4) and consistent with the SER. However, when Eq. 6 is applied below T∗, one obtains values of that are three orders of magnitude larger than those obtained from and the application of the SER (, where is the average van der Waals radius of the two species) as shown in Fig. 4. This inconsistency demonstrates that the SER indeed breaks down. We remark that the numerical values of reported in Fig. 4 below T∗ are not reliable since they are obtained from Eq. 6 which is not applicable when the SER breaks down.
IV Conclusions
We have demonstrated by means of MD simulations that the supercooled liquid of the prototypical phase change compound GeTe shows a high atomic mobility ( 10-6 cm2/s) down to temperatures very close to the glass transition temperature. Our calculated values of the viscosity as a function of temperature are consistent with a high fragility of the supercooled liquid. However, a compelling assessment of the degree of fragility would require a reliable estimate of Tg which is unfortunately unknown. The comparison between the calculated self diffusion coefficient and the viscosity demonstrates a breakdown of the SER below a crossover temperature of 700 K. These results support the experimental evidence of a breakdown of SER in the similar compound GST inferred by Orava et al. from ultrafast DSC measurements orava . This feature is the key to understand the origin of the high crystallization rate in phase change memories. In the set process of PCM, the amorphous phase is heated above Tg. Preliminary simulation results actually show that the glass transition experiences a hysteresis, the rapidly overheated amorphous phase differing from the supercooled liquid in a narrow range of temperature above Tg. The overheated amorphous phase displays a breakdown of SER as well, although somehow less pronounced than in the supercooled liquid. This issue will be addressed in a future publication. However, in the set process of PCM, the temperature can rise significantly above Tg depending on the details of the programming pulses. Indeed optimized set pulses with peak intensities equal to the reset pulse (leading to the melting of the crystal) are implemented in current PCM devices borghi . Under these conditions the crystallization occurs from the supercooled liquid phase. In spite of a large viscosity, a high diffusivity is still possible in the supercooled liquid down to temperatures very close to Tg because of the breakdown of SER. This allows for the coexistence of a high diffusivity and a high driving force for crystallization that boost the crystallization speed at high supercooling. The crystallization of the supercooled liquid or of a highly mobile overheated amorphous phase might take place in a different manner with respect to the crystallization of the amorphous phase at temperatures below Tg which is of interest for data retention. The conclusion we can draw is that the self-diffusion coefficient in the supercooled liquid regime close to Tg can not be inferred from the viscosity and the application of the SER. Secondly, the measured Arrhenius behavior of the diffusivity and/or crystallization speed below Tg can not be extrapolated above Tg in the supercooled liquid. These results are of interest also for the refinement of the electrothermal modeling of PCM devices redaelli .
V Acknowledgment
This work has been partially supported by Italian MURST through the program Prin08, by the Cariplo Foundation through project MONADS and by Regione Lombardia and CILEA Consortium through a LISA Initiative (Laboratory for Interdisciplinary Advanced Simulation) 2011 grant [link: http://lisa.cilea.it ]. We thankfully acknowledge the computational resources also by the ISCRA Initiative at Cineca (Casalecchio di Reno, Italy) and by CSCS (Manno, Switzerland).
References
- (1) M. Wuttig and N. Yamada, Nat. Mater. 6, 824 (2007).
- (2) A. Pirovano, A. L. Lacaita, A. Benvenuti, F. Pellizzer, and R. Bez, IEEE Trans. Electron. Dev. 51, 452 (2004).
- (3) A.L. Lacaita and D.J. Wouters, Phys. Stat. Sol. A 205, 2281 (2008).
- (4) D. Lencer, M. Salinga, and M. Wuttig, Adv. Mat. 23, 2030 (2011).
- (5) S. Raoux, W. Welnic, and D. Ielmini, Chem. Rev. 110, 240 (2010).
- (6) S. R. Ovshinsky, Phys. Rev. Lett. 21, 1450 (1968).
- (7) C. A. Angell, Science 267, 1924 (1995); P. G. Debenedetti and F. H. Stillinger, Nature 410, 259 (2001).
- (8) D. Turnbull and J.J Fisher, J. Chem. Phys. 17, 71 (1949); D. Turnbull, J. Appl. Phys. 21, 1022 (1950).
- (9) J. Orava, A. L. Greer, B. Gholipour, D.W. Hewak and C. E. Smith, Nat. Mat. 11, 279 (2012).
- (10) G. Sosso, S. Caravati, J. Behler, and M. Bernasconi, Phys. Rev. B 85, 174103 (2012).
- (11) J. Behler, and M. Parrinello, Phys. Rev. Lett. 98, 146401 (2007).
- (12) J. Akola, and R. O. Jones, Phys. Rev. B 76, 235201 (2007); Phys. Rev. Lett. 110, 205502 (2008).
- (13) R. Mazzarello, S. Caravati, S. Angioletti-Uberti, M. Bernasconi, and M. Parrinello, Phys. Rev. Lett. 104, 085503 (2010); erratum 107, 039902 (2011).
- (14) P. Perdew, K. Burke, and M. Ernzerhof, Phys. Rev. Lett. 77, 3865 (1996).
- (15) S. Caravati, M. Bernasconi, T. D. Kühne, M. Krack, and M. Parrinello, Appl. Phys. Lett. 91, 171906 (2007).
- (16) RuNNer: A Neural Network Code for High-Dimensional Potential-Energy Surfaces, Jörg Behler, Lehrstuhl für Theoretische Chemie, Ruhr-Universität Bochum, Germany.
- (17) W. Smith and T. R. Forester, J. Mol. Graph. 14, 136 (1996).
- (18) G. Bussi, D. Donadio and M. Parrinello, J. Chem. Phys. 126, 014101 (2007)
- (19) S. Grimme, J. Comput. Chem. 27, 1787 (2006).
- (20) V. M Glazov and O. D. Shelichov, Sov. Phys. Semicond. 18, 411 (1984).
- (21) J. VandeVondele, M. Krack, F. Mohamed, M. Parrinello, T. Chassaing, and J. Hutter, Comp. Phys. Comm. 167, 103 (2005); M. Krack, and M. Parrinello, High Performance Computing in Chemistry, edited by J. Grotendorst (NIC, Julich, 2004), Vol. 25, pp. 29-51; http://cp2k.berlios.de.
- (22) S. Goedecker, M. Teter, and J. Hutter, Phys. Rev. B 54, 1703 (1996); M. Krack, Theor. Chem. Acc. 114, 145 (2005).
- (23) D. Frenkel and B. Smit, Understanding Molecular Simulation, Academic Press, San Diego, 1996.
- (24) W. Klemm, and G. Frischmuth, Z. anorg. Chem. 218, 249 (1934).
- (25) J. K. Johnson, J. A. Zollweg, and K. E. Gubbins, Mol. Phys. 78, 591 (1993).
- (26) L. M. Ghiringhelli, J. H. Los, E. J. Meijer, A. Fasolino, and D. Frenkel, Phys. Rev. Lett. 94, 145701 (2005).
- (27) J. A. Kalb, F. Spaepen, T.P. Leervad Pedersen , and M. Wuttig, J. App. Phys. 94, 4908 (2003).
- (28) F. Herwig and M. Wobst, Z. Metallkd. 82, 917 (1991).
- (29) M. Micolaut, R. Vuilleumier, and C. Massobrio, Phys, Rev. B 79, 214205 (2009).
- (30) D. Derewnicka, P. G. Zielinski, and H. A. davies, J. Mat. Sci. Lett. 1, 87 (1982).
- (31) S. Raoux, B. Munoz, H.-Y. Cheng, J. L. Jordan-Sweet, Appl. Phys. Lett. 95, 143118 (2009).
- (32) J. C. Mauroa, Y. Yueb, A. J. Ellisona, P. K. Guptac, and D. C. Allan, Proc. Natl. Acad. Sci. 106, 19780 (2009).
- (33) M. H. Cohen and G.S. Grest, Phys. Rev. B 20, 1077 (1979).
- (34) R. Böhmer, K. L. Ngai, C. A. Angell, and D. J. Plazek, J. Chem. Phys. 99, 4201 (1993).
- (35) B. Dünweg and K. Kremer, J. Chem. Phys. 99, 6983 (1993).
- (36) M. Borghi, P. Zuliani, E. Palumbo, G. Dalla Libera, M. Martinelli, and R. Annunziata, in Proceeding of the 12th European Phase Change and Ovonics Symposium (EPCOS) 2012; available at www.epcos.org.
- (37) A. Redaelli, A. Pirovano, A. Benvenuti, and A. L. Lacaita, J. Appl. Phys. 103, 111101 (2008).