HIG-12-028
\RCS \RCS \cmsNoteHeaderHIG-12-028
Observation of a new boson at a mass of 125\GeVwith the CMS experiment at the LHC
Abstract
Results are presented from searches for the standard model Higgs boson in proton-proton collisions at and 8\TeVin the Compact Muon Solenoid experiment at the LHC, using data samples corresponding to integrated luminosities of up to 5.1\fbinvat 7\TeVand 5.3\fbinvat 8\TeV. The search is performed in five decay modes: , , , , and . An excess of events is observed above the expected background, with a local significance of 5.0 standard deviations, at a mass near 125\GeV, signalling the production of a new particle. The expected significance for a standard model Higgs boson of that mass is 5.8 standard deviations. The excess is most significant in the two decay modes with the best mass resolution, and ; a fit to these signals gives a mass of . The decay to two photons indicates that the new particle is a boson with spin different from one.
0.1 Introduction
The standard model (SM) of elementary particles provides a remarkably accurate description of results from many accelerator and non-accelerator based experiments. The SM comprises quarks and leptons as the building blocks of matter, and describes their interactions through the exchange of force carriers: the photon for electromagnetic interactions, the and bosons for weak interactions, and the gluons for strong interactions. The electromagnetic and weak interactions are unified in the electroweak theory. Although the predictions of the SM have been extensively confirmed, the question of how the and gauge bosons acquire mass whilst the photon remains massless is still open.
Nearly fifty years ago it was proposed [1, 2, 3, 4, 5, 6] that spontaneous symmetry breaking in gauge theories could be achieved through the introduction of a scalar field. Applying this mechanism to the electroweak theory [7, 8, 9] through a complex scalar doublet field leads to the generation of the and masses, and to the prediction of the existence of the SM Higgs boson (\PH). The scalar field also gives mass to the fundamental fermions through the Yukawa interaction. The mass of the SM Higgs boson is not predicted by theory. However, general considerations [10, 11, 12, 13] suggest that should be smaller than , while precision electroweak measurements imply that \GeVat 95% confidence level (CL) [14]. Over the past twenty years, direct searches for the Higgs boson have been carried out at the LEP collider, leading to a lower bound of \GeVat 95% CL [15], and at the Tevatron proton-antiproton collider, excluding the mass range 162–166\GeVat 95% CL [16] and detecting an excess of events, recently reported in [17, 18, 19], in the range 120–135\GeV.
The discovery or exclusion of the SM Higgs boson is one of the primary scientific goals of the Large Hadron Collider (LHC) [20]. Previous direct searches at the LHC were based on data from proton-proton collisions corresponding to an integrated luminosity of 5\fbinvcollected at a centre-of-mass energy \TeV. The CMS experiment excluded at 95% CL a range of masses from 127 to 600\GeV [21]. The ATLAS experiment excluded at 95% CL the ranges 111.4–116.6, 119.4–122.1 and 129.2–541\GeV [22]. Within the remaining allowed mass region, an excess of events near 125\GeVwas reported by both experiments. In 2012 the proton-proton centre-of-mass energy was increased to 8\TeVand by the end of June an additional integrated luminosity of more than 5\fbinvhad been recorded by each of these experiments, thereby enhancing significantly the sensitivity of the search for the Higgs boson.
This paper reports the results of a search for the SM Higgs boson using samples collected by the CMS experiment, comprising data recorded at and 8\TeV. The search is performed in five decay modes, , , , , and , in the low-mass range from 110 up to 160\GeV. In this mass range the Higgs boson production cross section is predicted to have values between 23 (29) and 10 (14)\unitpb at (8)\TeV [23]. The natural width of the SM Higgs boson over the same range is less than 100\MeVand the width of any observed peak would be entirely dominated by instrumental mass resolution. In what follows, stands for electrons or muons, is denoted as , as , and as . For the final states and in the low-mass region, one or more of the or bosons is off mass shell.
With respect to the published analyses [24, 25, 26, 27, 28], most analyses have been re-optimized, incorporating improvements in reconstruction performance and event selection, and mitigating the more challenging conditions due to the higher LHC intensities in 2012. The new analyses presented herein, of 8\TeVsamples, and of 7\TeVsamples featuring modified event selection criteria, were performed in a “blind” way: the algorithms and selection procedures were formally approved and fixed before the results from data in the signal region were examined. In the previously published analyses similar but less formal procedures were followed.
Within the context of this search for the SM Higgs boson, we report the observation of an excess of events above the expected background, consistent with the production of a new particle with mass near 125\GeV. The observed local significance is 5.0 standard deviations (), compared with an expected significance of 5.8 . The evidence is strongest in the two final states with the best mass resolution, namely with a significance of 4.1 and (with the bosons decaying to electrons or muons) with a significance of 3.2 . The decay to two photons indicates that the new particle is a boson with spin different from one.
0.2 The CMS experiment
The possibility of detection of the SM Higgs boson played a crucial role in the conceptual design of the CMS experiment as a benchmark to test the performance of the detector [29, 30, 31]. Since the SM Higgs boson mass is not predicted by theory and its production cross section and natural width vary widely over the allowed mass range, a search was envisaged over a large range of masses and in diverse decay modes: pairs of photons, Z bosons, W bosons, leptons, and quarks. Planning in view of the analysis of all these channels ensured a detector capable of observing a Higgs boson over a broad mass range and able to detect most potential signals of new physics.
The central feature of the CMS apparatus [32] is a superconducting solenoid of 6\unitm internal diameter, which provides a magnetic field of 3.8\unitT. Within the field volume are a silicon pixel and strip tracker, a lead tungstate crystal electromagnetic calorimeter (ECAL), and a brass/scintillator hadron calorimeter (HCAL). Muons are measured in gas-ionization detectors embedded in the steel flux-return yoke. Extensive forward calorimeters complement the coverage provided by the barrel and endcap detectors.
Charged particles are tracked within the pseudorapidity range , where , and is the polar angle measured from the positive axis (along the anticlockwise beam direction). The silicon pixel tracker comprises 66 million pixels, arranged in three barrel layers and two disks at each end. The silicon strip tracker, organized in ten barrel layers and twelve disks at each end, comprises 9.3 million strips with pitch between 80 and 180\mum, with a total silicon surface area of . The tracker has a track-finding efficiency larger than 99% for muons with transverse momentum greater than 1\GeVand a transverse momentum resolution between 1.5 and 2.5% for charged tracks of \GeVin the central region ( 1.5). Measurements of the impact parameters of charged tracks and secondary vertices are used to identify jets that are likely to contain the hadronisation and decay products of quarks (“ jets”). A b-jet tagging efficiency of more than 50% is achieved with a rejection factor for light-quark jets of , as measured in events in data [33]. The dimuon mass resolution at the mass, dominated by instrumental effects, is measured to be 0.6% in the barrel region [34], consistent with the design goal.
The ECAL is a fine-grained hermetic calorimeter consisting of 75 848 lead tungstate crystals, arranged in a quasi-projective geometry and distributed in a barrel region () and two endcaps that extend up to . The front-face cross section of the crystals is in the barrel region and in the endcaps. Preshower detectors consisting of two planes of silicon sensors interleaved with a total of three radiation lengths of lead absorber are located in front of the endcaps. Electromagnetic showers are very narrow in lead tungstate (Molière radius of 21\mm), helping in particle identification and in the implementation of isolation criteria. In the central barrel region the energy resolution of electrons that do not radiate substantially in the tracker material indicates that the resolution of unconverted photons is consistent with design goals. For such photons the diphoton mass resolution is 1.1\GeVat a mass of 125\GeV.
The HCAL barrel and endcaps are sampling calorimeters consisting of brass and scintillator plates, covering . Their thickness varies from 7 to 11 interaction lengths, depending on ; a scintillator “tail catcher” placed outside the coil of the solenoid, just in front of the innermost muon detector, extends the instrumented thickness to more than 10 interaction lengths everywhere. Iron forward calorimeters with quartz fibers, read out by photomultipliers, extend the calorimeter coverage up to .
Muons are measured in the range , with detection planes based on three technologies: drift tubes ( 1.2), cathode strip chambers (), and resistive plate chambers (). The first two technologies provide a precise position measurement and trigger whilst the third provides precise timing information as well as a second and independent trigger. The muon system consists of four stations in the barrel and endcaps, designed to ensure robust triggering and detection of muons over a large angular range. In the barrel region each muon station consists of twelve drift-tube layers, except for the outermost station, which has eight layers. In the endcaps, each muon station consists of six detection planes. The precision of the - measurement is 100\mumin the drift tubes and varies from 60 to 140\mumin the cathode strip chambers.
The CMS trigger and data acquisition systems ensure that potentially interesting events are recorded with high efficiency. The first level (L1) trigger, comprising the calorimeter, muon, and global trigger processors, uses coarse-granularity information to select the most interesting events in less than 4\mus. The detector data are pipelined to ensure negligible deadtime up to a L1 rate of 100\unitkHz. After L1 triggering, data are transferred from the readout electronics of all subdetectors, through the readout network, to the high-level-trigger processor farm, which operates offline-quality reconstruction algorithms to decrease the event rate to around 0.5\unitkHz, before data storage.
The CMS experiment employs a highly distributed computing infrastructure, with a primary Tier-0 centre at CERN, supplemented by seven Tier-1, more than 50 Tier-2, and many Tier-3 centres at national laboratories and universities throughout the world. The CMS software running on this high-performance computing system executes numerous tasks, including the reconstruction and analysis of the collected data, as well as the generation and detailed detector simulation of Monte Carlo (MC) event samples.
0.3 Event reconstruction
The CMS “particle-flow” event description algorithm [35, 36] is used to reconstruct and identify each single particle with an optimized combination of all subdetector information. In this process, the identification of the particle (photon, electron, muon, charged hadron, neutral hadron) plays an important role in the determination of the particle momentum. The reconstructed particles are henceforth referred to as objects.
Jets are reconstructed by clustering the particle-flow objects with the anti-kT algorithm [37] using a distance parameter of 0.5. Additional selection criteria are applied to each event to remove spurious features originating from isolated noise patterns in certain HCAL regions, and from anomalous signals caused by particles depositing energy in the silicon avalanche photodiodes used in the ECAL barrel region. The average number of pp interactions per LHC bunch crossing is estimated to be about 9 and 19 in the 7\TeV(2011) and 8\TeV(2012) data sets, respectively. Energy from overlapping pp interactions (“pileup”), and from the underlying event, is subtracted using the FastJet technique [38, 39, 40], which is based on the calculation of the -dependent transverse momentum density, evaluated on an event-by-event basis.
The jet momentum is determined as the vector sum of all particle momenta in the jet. Jet energy corrections are derived from simulation studies and from in situ measurements using the energy balance of dijet and +jet events [41]. These corrections are between 5% and 10% of the true momentum over the entire \ptspectrum and detector acceptance. The jet momentum resolution achieved is for central jets. A selection is applied to separate jets originating in the primary interaction from those due to energy deposits associated with pileup. The discrimination is based on the differences in the jet shapes, in the relative multiplicity of charged and neutral components, and in the fraction of transverse momentum carried by the hardest components. Within the tracker acceptance the jet tracks are also required to be consistent with originating at the primary vertex.
The missing transverse energy vector is taken as the negative vector sum of all particle transverse momenta, and its magnitude is referred to as . The typical missing transverse energy resolution is around [42], where is the scalar sum of all particle transverse momenta in \GeVns.
The energy deposited in the ECAL is clustered both with general clustering algorithms [43] and with algorithms that constrain the clusters in and to the shapes expected from electrons and photons with high [44]. These specialised algorithms are used to cluster electromagnetic showers without any hypothesis regarding whether the particle originating from the interaction point was a photon or an electron; doing this for electrons from events provides a measurement of the photon trigger, reconstruction, and identification efficiencies, as well as of the photon energy scale and resolution. The width of the reconstructed resonance is used to quantify the performance of the ECAL, using decays to two electrons whose energies are measured using the ECAL alone, with only their directions being determined from the tracks. In the 7\TeVdata set, the dielectron mass resolution at the boson mass is 1.56\GeVin the barrel and 2.57\GeVin the endcaps, while in the 8\TeVsample, reconstructed with preliminary calibration constants, the corresponding values are 1.61 and 3.75\GeV. For electrons, the reconstruction combines the clusters in the ECAL and the trajectory in the silicon tracker [45]. Trajectories in the tracker volume are reconstructed using a model of electron energy loss and fitted with a Gaussian sum filter [46]. The electron momentum is determined from the combination of ECAL and tracker measurements.
Muon candidates are reconstructed with two algorithms, one in which the tracks in the silicon detector are matched to segments in the muon chambers, and another in which a combined fit is performed to the signals found in both the silicon tracker and muon systems [43]. The efficiency to reconstruct a muon of \GeVis larger than 95%, while the probability to misidentify a hadron as a muon is below 0.1%. For \GeVthe precision of the momentum measurement improves when the silicon tracker signals are complemented with the information from the muon chambers.
Selection based on isolation of lepton and photon objects is used extensively. A requirement is placed on the scalar sum of the transverse momenta of the particles reconstructed within a distance of the object, sometimes normalised to the of the object. The distance is defined as , where and are the pseudorapidity and azimuthal angle differences between the particle direction and the object direction. Typically is chosen to be 0.3 or 0.4.
The measurement of the integrated luminosity in CMS is based on a pixel cluster counting method, which exploits the large number of silicon pixels, and hence their low occupancy in a pp collision [47]. The cross section normalisation is derived from van der Meer scans [48]. The uncertainties in the luminosity measurements are 2.2% and 4.4% for the 7\TeVand 8\TeVdata sets, respectively.
0.4 Searches for the standard model Higgs boson
Initial phenomenological discussions of Higgs boson production and decay can be found in Refs. [49, 50, 51, 52, 53, 54, 55, 56]. Four main mechanisms are predicted for Higgs boson production in pp collisions: the gluon-gluon fusion mechanism, which has the largest cross section, followed in turn by vector-boson fusion (VBF), associated and production (VH), and production in association with top quarks (). The cross sections for the individual production mechanisms and the decay branching fractions, together with their uncertainties, have been computed following Refs. [57, 58, 59, 60, 61, 62, 63, 64, 65, 66, 67, 68, 69, 70, 71, 72, 73, 74, 75, 76, 77, 78, 79, 80, 81, 82, 83, 84, 85, 86, 87, 88, 89, 90, 91, 92, 93, 94, 95, 96, 97, 98, 99, 100, 69, 101] and are compiled in Refs. [23, 102].
The particular set of sensitive decay modes of the SM Higgs boson depends strongly on . The results presented in this paper are based on the five most sensitive decay modes in the low-mass region: ; followed by decays to ; followed by decays to ; followed by at least one leptonic decay; and followed by -quark fragmentation into jets. This list is presented in Table 0.4 and comprises the full set of decay modes and subchannels, or categories, for which both the 7 and 8\TeVdata sets have been analysed. Other lower sensitivity subchannels (, ; , ; , ; ) have also been studied, so far only in the 7\TeVdata, and are not included here. Adding these analyses in the combination results in an improvement of 0.1 in the overall expected local significance at \GeV.
Summary of the subchannels, or categories, used in the analysis of each decay mode. Decay Production No. of range Int. Lum. (\fbinv) mode tagging subchannels (\GeVns) 7\TeV 8\TeV untagged 4 110–150 5.1 5.3 dijet (VBF) 1 or 2 untagged 3 110–160 5.1 5.3 untagged 4 110–160 4.9 5.1 dijet (VBF) 1 or 2 untagged 16 110–145 4.9 5.1 dijet (VBF) 4 bb lepton, (VH) 10 110–135 5.0 5.1
For a given value of , the search sensitivity depends on the production cross section, the decay branching fraction into the chosen final state, the signal selection efficiency, the mass resolution, and the level of background from identical or similar final-state topologies.
Samples of MC events used to represent signal and background are fully simulated using 4 [103]. The simulations include pileup interactions matching the distribution of the number of such interactions observed in data. The description of the Higgs boson signal is obtained from MC simulation using, for most of the decay modes and production processes, the next-to-leading-order (NLO) matrix-element generator \POWHEG [104, 105], interfaced with \PYTHIA6.4 [106]. For the dominant gluon-gluon fusion process, the transverse momentum spectrum of the Higgs boson in the 7\TeVMC samples is reweighted to the next-to-next-to-leading-logarithmic (NNLL) + NLO distribution computed with hqt [107, 71, 72] and FeHiPro [108, 109], except in the analysis, where the effect is marginal. The agreement of the spectrum in the simulation at 8\TeVwith the NNLL + NLO distribution makes reweighting unnecessary. The improved agreement is due to a modification in the \POWHEGsetup recommended in Ref. [102]. The simulation of associated-production signal samples uses \PYTHIAand all signal samples for are made using \POWHEGinterfaced to herwig++ [110]. Samples used for background studies are generated with \PYTHIA, \POWHEG, and \MADGRAPH [111], and the normalisations are obtained from the best available NNLO or NLO calculations. The uncertainty in the signal cross section related to the choice of parton distribution functions is determined with the PDF4LHC prescription [96, 97, 98, 99, 100].
The overall statistical methodology [112] used in this paper was developed by the CMS and ATLAS Collaborations in the context of the LHC Higgs Combination Group. A more concise summary of CMS usage in the search for a Higgs boson is given in Ref. [21]. The modified frequentist criterion [113, 114] is used for the calculation of exclusion limits. Systematic uncertainties are incorporated as nuisance parameters and are treated according to the frequentist paradigm. The combination of searches requires simultaneous analysis of the data selected by all individual analyses, accounting for all statistical and systematic uncertainties and their correlations. The probability for a background fluctuation to be at least as large as the observed maximum excess is termed the local -value, and that for an excess anywhere in a specified mass range the global -value. This probability can be evaluated by generating sets of simulated data incorporating all correlations between analyses optimized for different Higgs boson masses. The global -value (for the specified region) is greater than the local -value, and this fact is often referred to as the look-elsewhere effect (LEE) [115]. Both the local and global -values can be expressed as a corresponding number of standard deviations using the one-sided Gaussian tail convention. The magnitude of a possible Higgs boson signal is characterised by the production cross section times the relevant branching fractions, relative to the SM expectation, denoted and referred to as the signal strength. The results presented in this paper are obtained using asymptotic formulae [116], including updates recently introduced in the RooStats package [117].
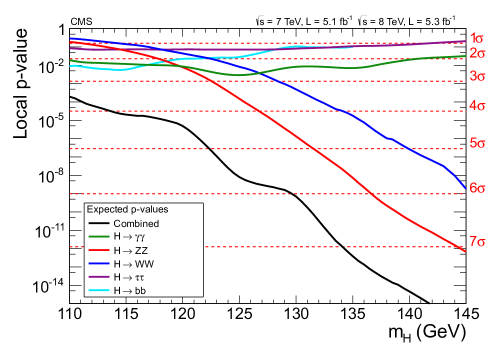
Figure 1 shows the expected local -values in the mass range 110–145\GeVfor the five decay modes reported here. The expected significance of a SM Higgs boson signal at \GeVwhen the five decay modes are combined is 5.6 . The highest sensitivity in this mass range is achieved in the , , and channels. Because of the excellent mass resolution (1–2\GeV) achieved in the and channels, they play a special role in the low-mass region, where the natural width of the SM Higgs boson is predicted to be a few \MeV. The expected signature in these channels is therefore a narrow resonance above background, with a width consistent with the detector resolution.
0.5 Decay modes with high mass resolution
0.5.1
In the analysis a search is made for a narrow peak in the diphoton invariant mass distribution in the range 110–150\GeV, on a large irreducible background from QCD production of two photons. There is also a reducible background where one or more of the reconstructed photon candidates originate from misidentification of jet fragments. Early detailed studies indicated this to be one of the most promising channels in the search for a SM Higgs boson in the low-mass range [118].
To enhance the sensitivity of the analysis, candidate diphoton events are separated into mutually exclusive categories of different expected signal-to-background ratios, based on the properties of the reconstructed photons and on the presence of two jets satisfying criteria aimed at selecting events in which a Higgs boson is produced through the VBF process. The analysis uses multivariate techniques for the selection and classification of the events. As an independent cross-check, an analysis is also performed that is almost identical to the one described in Ref. [24], using simpler criteria based on the properties of the reconstructed photons to select and classify events. The multivariate analysis achieves 15% higher sensitivity than the cross-check analysis.
The reconstructed primary vertex that most probably corresponds to the interaction vertex of the diphoton candidate is identified using the kinematic properties of the tracks associated with that vertex and their correlation with the diphoton kinematics. In addition, if either of the photons converts and the tracks from the conversion are reconstructed and identified, the direction of the converted photon contributes to the identification of the hard-scattering vertex. More details can be found in Ref. [24].
The event selection requires two photon candidates satisfying requirements and “loose” photon identification criteria. These photons must be reconstructed within the fiducial region, , excluding the barrel-endcap transition region, . A threshold of () is applied to the photon leading (subleading) in , where is the diphoton invariant mass. Scaling the thresholds in this way avoids distortion of the shape of the distribution. In the case of events passing the dijet selection, the requirement on the leading photon is increased to , further reducing background with negligible loss of signal.
Jet selection criteria are applied to the two jets of largest in the event within . The jet selection requirements are optimized using simulated VBF signal and diphoton background events. The thresholds for the two jets are 30 and 20\GeV, and their separation is required to be greater than 3.5. The dijet invariant mass is required to be greater than 350 and 250\GeVfor the 7 and 8\TeVdata sets, respectively. The lower dijet invariant mass requirement for the 8\TeVdata set reflects the fact that for the analysis of that data set, the dijet event category is divided into two to increase the search sensitivity. This division creates a second “tight” dijet-tagged category in which the dijet invariant mass must be greater than 500\GeVand both jets must have \GeV. Two additional selection criteria, relating the dijet to the diphoton system, are applied: the difference between the average pseudorapidity of the two jets and the pseudorapidity of the diphoton system is required to be less than 2.5, and the difference in azimuthal angle between the diphoton system and the dijet system is required to be greater than 2.6 radians.
A multivariate regression is used to extract the photon energy and a photon-by-photon estimate of the uncertainty in that measurement. The calibration of the photon energy scale uses the Z boson mass as a reference; ECAL showers coming from electrons in events are clustered and reconstructed in exactly the same way as photon showers. The photon selection efficiency, energy resolution, and associated systematic uncertainties are estimated from data, using events to derive data/simulation correction factors. The jet reconstruction efficiency, the efficiency to correctly locate the vertex position, and the trigger efficiency, together with the corresponding systematic uncertainties, are also evaluated from data.
For the multivariate analysis, a boosted decision tree (BDT) [119, 120] is trained to give a high output value (score) for signal-like events and for events with good diphoton invariant mass resolution, based on the following observables: (i) the photon quality determined from electromagnetic shower shape and isolation variables; (ii) the expected mass resolution; (iii) the per-event estimate of the probability of locating the diphoton vertex within 10\mmof its true location along the beam direction; and (iv) kinematic characteristics of the photons and the diphoton system. The kinematic variables are constructed so as to contain no information about the invariant mass of the diphoton system. The diphoton events not satisfying the dijet selection are classified into five categories based on the output of the BDT, with category boundaries optimized for sensitivity to a SM Higgs boson. Events in the category with smallest expected signal-to-background ratio are rejected, leaving four categories of events. Dijet-tagged events with BDT scores smaller than the threshold for the fourth category are also rejected. Simulation studies indicate that the background in the selected event categories is dominated by the irreducible background from QCD production of two photons and that fewer than 30% of the diphoton events used in the analysis contain one or more misidentified photons (predominantly from +jet production).
Table 0.5.1 shows the expected number of signal events in each event category for a SM Higgs boson (of \GeV), and the background at \GeV, estimated from the fit described below. The estimated mass resolution is also shown, measured both by , half the minimum width containing 68% of the signal events, and by the full width at half maximum (FWHM). A large variation in the expected signal-to-background ratio between the categories can be seen, although as a consequence of the optimization of the category boundaries the expected signal significances in each category are rather similar. The differences in the relative signal-to-background ratio between the categories are almost independent of .
Expected numbers of SM Higgs boson events (\GeV) and estimated background (at \GeV) for all event categories of the 7 and 8\TeVdata sets. There are two dijet-tagged categories for the 8\TeVdata as described in the text, and for both data sets the remaining untagged events are separated into four categories labelled here BDT 0–3, BDT 0 having the largest expected signal-to-background ratio. The composition of the SM Higgs boson signal in terms of the production processes, and its mass resolution, are also given.
| Event categories | SM Higgs boson expected signal (\GeV) | Background (events/\GeVns) | ||||||||
| Events | ggH | VBF | VH | ttH | (\GeVns) | FWHM/2.35 (\GeVns) | ||||
| 7\TeV, 5.1\fbinv | BDT 0 | 3.2 | 61% | 17% | 19% | 3% | 1.21 | 1.14 | 3.3 | 0.4 |
| BDT 1 | 16.3 | 88% | 6% | 6% | – | 1.26 | 1.08 | 37.5 | 1.3 | |
| BDT 2 | 21.5 | 92% | 4% | 4% | – | 1.59 | 1.32 | 74.8 | 1.9 | |
| BDT 3 | 32.8 | 92% | 4% | 4% | – | 2.47 | 2.07 | 193.6 | 3.0 | |
| Dijet tag | 2.9 | 27% | 72% | 1% | – | 1.73 | 1.37 | 1.7 | 0.2 | |
| 8\TeV, 5.3\fbinv | BDT 0 | 6.1 | 68% | 12% | 16% | 4% | 1.38 | 1.23 | 7.4 | 0.6 |
| BDT 1 | 21.0 | 87% | 6% | 6% | 1% | 1.53 | 1.31 | 54.7 | 1.5 | |
| BDT 2 | 30.2 | 92% | 4% | 4% | – | 1.94 | 1.55 | 115.2 | 2.3 | |
| BDT 3 | 40.0 | 92% | 4% | 4% | – | 2.86 | 2.35 | 256.5 | 3.4 | |
| Dijet tight | 2.6 | 23% | 77% | – | – | 2.06 | 1.57 | 1.3 | 0.2 | |
| Dijet loose | 3.0 | 53% | 45% | 2% | – | 1.95 | 1.48 | 3.7 | 0.4 | |
The background is estimated from data, without the use of MC simulation, by fitting the diphoton invariant mass distribution in each of the categories in a range (100 180\GeV) extending slightly above and below that in which the search is performed. The choices of the function used to model the background and of the fit range are made based on a study of the possible bias in the measured signal strength. Polynomial functions are used. The degree is chosen by requiring that the potential bias be at least a factor of 5 smaller than the statistical accuracy of the fit prediction. The required polynomial degree ranges from 3 to 5.
A further independent analysis (referred to as the sideband background model) is performed using a different approach to the background modelling. Its sensitivity is very similar to that of the standard analysis. It employs a fit to the output of an additional BDT that takes as input the diphoton invariant mass and the diphoton BDT output, and uses a background model derived from the sidebands of the invariant-mass distribution. A fit to the diphoton invariant-mass distribution is used to obtain the background normalisation. This fit is of a power law and excludes a window of width 2% around the mass hypothesis. The methodology allows a systematic uncertainty to be assigned to the fit shape.
The expected 95% CL upper limit on the signal strength , in the background-only hypothesis, for the combined 7 and 8\TeVdata, is less than 1.0 in the range 110 140\GeV, with a value of 0.76 at = 125\GeV. The observed limit indicates the presence of a significant excess at = 125\GeVin both the 7 and 8\TeVdata. The features of the observed limit are confirmed by the independent sideband-background-model and cross-check analyses. The local -value is shown as a function of in Fig. 2 for the 7 and 8\TeVdata, and for their combination. The expected (observed) local -value for a SM Higgs boson of mass 125\GeVcorresponds to In the sideband-background-model and cross-check analyses, the observed local -values for correspond to 4.6 and , respectively. The best-fit signal strength for a SM Higgs boson mass hypothesis of 125\GeVis .
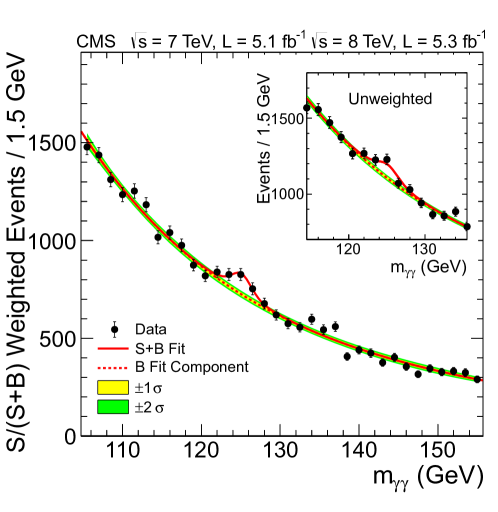
In order to illustrate, in the distribution, the significance given by the statistical methods, it is necessary to take into account the large differences in the expected signal-to-background ratios of the event categories shown in Table 0.5.1. The events are weighted according to the category in which they fall. A weight proportional to is used, as suggested in Ref. [121], where and are the number of signal and background events, respectively, calculated from the simultaneous signal-plus-background fit to all categories (with varying overall signal strength) and integrating over a wide window, in each category, centred on 125\GeV. Figure 3 shows the data, the signal model, and the background model, all weighted. The weights are normalised such that the integral of the weighted signal model matches the number of signal events given by the best fit. The unweighted distribution, using the same binning but in a more restricted mass range, is shown as an inset. The excess at 125\GeVis evident in both the weighted and unweighted distributions.
0.5.2
In the decay mode a search is made for a narrow four-lepton mass peak in the presence of a small continuum background. Early detailed studies outlined the promise of this mode over a wide range of Higgs boson masses [122]. Only the search in the range 110–160\GeVis reported here. Since there are differences in the reducible background rates and mass resolutions between the subchannels 4e, 4, and 2e2, they are analysed separately. The background sources include an irreducible four-lepton contribution from direct production via and gluon-gluon processes. Reducible contributions arise from and production where the final states contain two isolated leptons and two -quark jets producing secondary leptons. Additional background arises from jets and jets events where jets are misidentified as leptons. Compared to the analysis reported in Ref. [25], the present analysis employs improved muon reconstruction, improved lepton identification and isolation, and a kinematic discriminant exploiting the decay kinematics expected for the signal events. An algorithm to recover final-state radiation (FSR) photons has also been deployed.
Electrons are required to have \GeVand . The corresponding requirements for muons are \GeVand . Electrons are selected using a multivariate identifier trained using a sample of jets events, and the working point is optimized using jets events. Both muons and electrons are required to be isolated. The combined reconstruction and selection efficiency is measured using electrons and muons in boson decays. Muon reconstruction and identification efficiency for muons with \GeVis measured using J/ decays.
The electron or muon pairs from boson decays are required to originate from the same primary vertex. This is ensured by requiring that the significance of the impact parameter with respect to the event vertex satisfy for each lepton, where , is the three-dimensional lepton impact parameter at the point of closest approach to the vertex, and its uncertainty.
Final-state radiation from the leptons is recovered and included in the computation of the lepton-pair invariant mass. The FSR recovery is tuned using simulated samples of and tested on data samples of \cPZ boson decays to electrons and muons. Photons reconstructed within are considered as possibly due to FSR. The photons must satisfy the following requirements. They must be within of a muon and have \GeV(most photon showers within this distance of an electron having already been automatically clustered with the electron shower); or if their distance from a lepton is in the range , they must satisfy \GeV, and be isolated within . Such photon candidates are combined with the lepton if the resulting three-body invariant mass is less than 100\GeVand closer to the \cPZ boson mass than the mass before the addition of the photon.
The event selection requires two pairs of same-flavour, oppositely charged leptons. The pair with invariant mass closest to the Z boson mass is required to have a mass in the range 40–120\GeVand the other pair is required to have a mass in the range 12–120\GeV. The ZZ background is evaluated from MC simulation studies. Two different approaches are employed to estimate the reducible and instrumental backgrounds from data. Both start by selecting events in a background control region, well separated from the signal region, by relaxing the isolation and identification criteria for two same-flavour reconstructed leptons. In the first approach, the additional pair of leptons is required to have the same charge (to avoid signal contamination) while in the second, two opposite-charge leptons failing the isolation and identification criteria are required. In addition, a control region with three passing leptons and one failing lepton is used to estimate contributions from backgrounds with three prompt leptons and one misidentified lepton. The event rates measured in the background control region are extrapolated to the signal region using the measured probability for a reconstructed lepton to pass the isolation and identification requirements. This probability is measured in an independent sample. Within uncertainties, comparable background counts in the signal region are estimated by both methods.
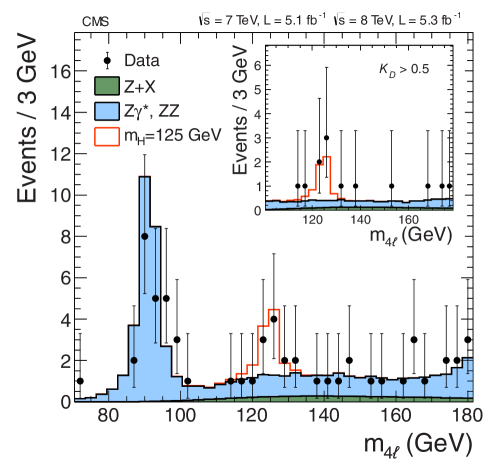
The number of selected candidate events in the mass range \GeV, in each of the three final states, is given in Table 0.5.2, where is the four-lepton invariant mass. The number of predicted background events, in each of the three final states, and their uncertainties are also given, together with the number of signal events expected from a SM Higgs boson of \GeV. The distribution is shown in Fig. 4. There is a clear peak at the Z boson mass where the decay is reconstructed. This feature of the data is well reproduced by the background estimation. The figure also shows an excess of events above the expected background around 125\GeV. The total background and the numbers of events observed in the three bins where an excess is seen are also shown in Table 0.5.2. The combined signal reconstruction and selection efficiency, with respect to the generated signal with as the only cut, is 18% for the 4\Pe channel, 40% for the 4\Pgm channel, and 27% for the 2\Pe2\Pgm channel.
The number of selected events, compared to the expected background yields and expected number of signal events (\GeV) for each final state in the analysis. The estimates of the background are based on data. These results are given for the mass range from 110 to 160\GeV. The total background and the observed numbers of events are also shown for the three bins (“signal region”) of Fig. 4 where an excess is seen (\GeV). Channel background 2.7 0.3 5.7 0.6 7.2 0.8 15.6 1.4 All backgrounds ( GeV) Observed ( GeV) 6 6 9 21 Signal (\GeV) 1.36 0.22 2.74 0.32 3.44 0.44 7.54 0.78 All backgrounds (signal region) Observed (signal region) 1 3 5 9
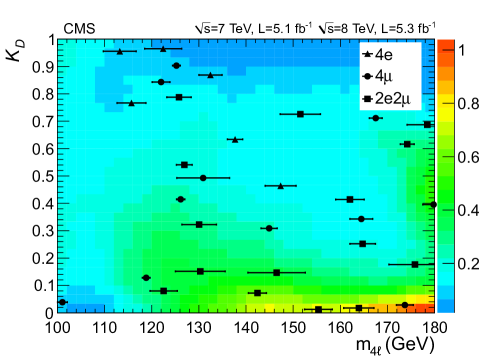
The kinematics of the process in its centre-of-mass frame, for a given invariant mass of the four-lepton system, is fully described by five angles and the invariant masses of the two lepton pairs [123, 124, 125]. These seven variables provide significant discriminating power between signal and background. The momentum of the system may further differentiate signal from background, but would introduce dependence on the production mechanism, and on the modelling of the QCD effects, and is therefore not considered here. A kinematic discriminant is constructed based on the probability ratio of the signal and background hypotheses, , as described in Ref. [126]. The likelihood ratio is defined for each value of . For the signal, the phase-space and \cPZ propagator terms [127] are included in a fully analytic parameterization [124], while the background probability is tabulated using a simulation of the process. The statistical analysis only includes events with \GeV.
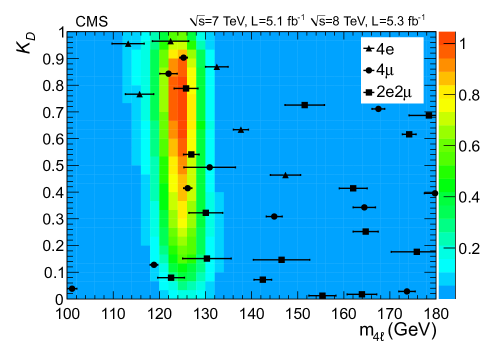
Figure 5 (upper) shows the distribution of versus for events selected in the subchannels. The colour-coded regions show the expected background. Figure 5 (lower) shows the same two-dimensional distribution of events, but this time superimposed on the expected event density from a SM Higgs boson ( = 125\GeV). A clustering of events is observed around 125\GeVwith a large value of , where the background expectation is low and the signal expectation is high, corresponding to the excess seen in the one-dimensional mass distribution. The distribution of events satisfying is shown in the inset in Fig. 4.
There are three final states and two data sets (7 and 8\TeV), and thus the statistical treatment requires six simultaneous two-dimensional maximum-likelihood fits for each value of , in the variables and . Systematic uncertainties are evaluated from data for the trigger efficiency and for the combined lepton reconstruction, identification, and isolation efficiencies, as described in [128]. Systematic uncertainties in the energy/momentum calibration and in the energy resolution are estimated from data. Additional systematic uncertainties arise from limited statistical precision in the reducible background control regions.
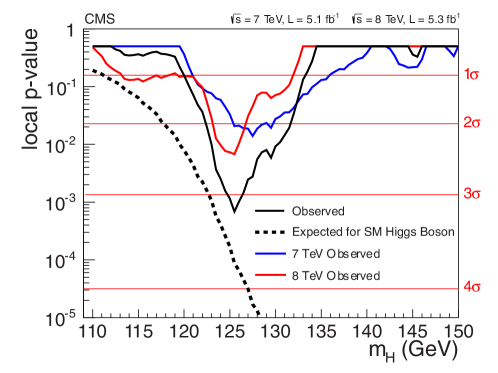
The expected 95% CL upper limit on the signal strength , in the background-only hypothesis, for the combined 7 and 8\TeVdata, falls steeply between 110 and 140\GeV, and has a value of 0.6 at \GeV. The observed upper limit indicates the presence of a significant excess in the range \GeV. The local -value is shown as a function of in Fig. 6 for the 7 and 8\TeVdata, and for their combination. The minimum local -value in the data occurs at \GeVand has a significance of 3.2 (expected 3.8). The combined best-fit signal strength for a SM Higgs boson mass hypothesis of 125.6\GeVis .
0.6 Decay modes with low mass resolution
0.6.1
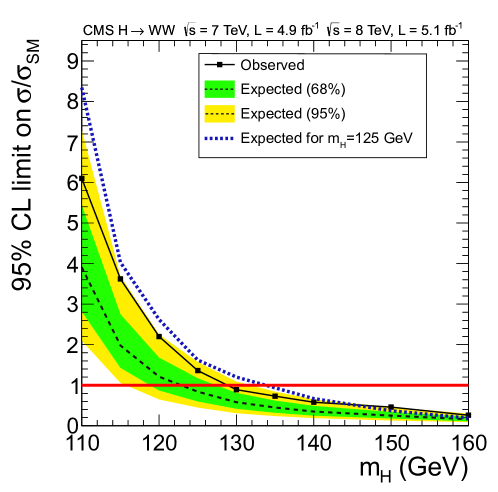
The decay mode is highly sensitive to a SM Higgs boson in the mass range around the threshold of 160\GeV. With the development of tools for lepton identification and reconstruction optimized for LHC pileup conditions, it is possible to extend the sensitivity down to 120\GeV. This decay mode is analysed by selecting events in which both bosons decay leptonically, resulting in a signature with two isolated, oppositely charged leptons (electrons or muons) and large due to the undetected neutrinos [129, 130]. A threshold of 20 (10)\GeVis applied to the lepton leading (subleading) in . The analysis of the 7\TeVdata is described in Ref. [26] and remains unchanged, while the 8\TeVanalysis was modified to cope with more difficult conditions induced by the higher pileup of the 2012 data taking.
Events are classified according to the number of jets (0, 1, or 2) with and within ( for the 7\TeVdata set), and further separated into same-flavour ( and ) or different-flavour () categories. Events with more than two jets are rejected. To improve the sensitivity of the analysis, the selection criteria are optimized separately for the different event categories since they are characterised by different dominating backgrounds. The zero-jet category has the best signal sensitivity. Its main backgrounds are irreducible nonresonant production and reducible W+jets processes, where a jet is misidentified as a lepton. The one-jet and zero-jet same-flavour categories only contribute to the signal sensitivity at the 10% level because of larger backgrounds, from top-quark decays and Drell–Yan production, respectively. Event selection in the two-jet category is optimized for the VBF production mechanism. This category has the highest expected signal-to-background ratio, but its contribution to the overall sensitivity is small owing to the lower cross section relative to inclusive production.
The projected variable [26] is used to reduce the Drell–Yan background arising from events where the vector is aligned with the lepton , as well as events with mismeasured associated with poorly reconstructed leptons and jets. The projected is defined as the transverse component of the vector with respect to the closest lepton direction, if it is closer than in azimuthal angle, or the full otherwise. Since pileup degrades the projected resolution, the minimum of two different projected definitions is used: the first includes all particle candidates in the event, while the second uses only the charged particle candidates associated with the primary vertex. In the analysis, the minimum projected defined in this way is then required to be above a threshold that varies by category. For , projected is required to be greater than in the channel, and greater than 45\GeVin the same-flavour channels. For in the same-flavour channels, where it is more difficult to separate the signal from the Drell–Yan background, a multivariate selection is used, combining kinematic and topological variables. In the two-jet category, a simple selection of is applied. To further reduce the Drell–Yan background in the same-flavour final states, events with a dilepton mass within of the boson mass are rejected. The background from low-mass resonances is rejected by requiring a dilepton invariant mass greater than 12\GeV.
To suppress the top-quark background, a “top tagging” technique based on soft-muon and b-jet tagging is applied. The first method is designed to veto events containing muons from jets coming from decays of top quarks. The second method uses a -jet tagging algorithm, which looks within jets for tracks with large impact parameters. The algorithm is applied also in the case of zero-jet events, which may contain low- jets below the selection threshold. To reduce the background from production, events with a third lepton passing the identification and isolation requirements are rejected.
Yields for the dominant backgrounds are estimated using control regions in the data. The W+jets contribution is derived from data using a “tight-loose” sample in which one lepton passes the standard criteria and the other does not, but instead satisfies a “loose” set of requirements. The efficiency for a jet that satisfies the loose selection to pass the tight selection is determined using data from an independent loose lepton-trigger sample dominated by jets. The background contamination is then estimated using the events of the “tight-loose” sample weighted by . The normalisation of the top-quark background is estimated by counting the number of top-tagged events and applying the corresponding top-tagging efficiency. The nonresonant contribution is normalised by using events with a dilepton mass larger than , where the Higgs boson signal contamination is negligible, extrapolated to the signal region using simulated samples. The same-flavour Drell–Yan background is normalised using the number of events observed with a dilepton mass within 7.5\GeVof the boson mass, after subtracting the non-Drell–Yan contribution. Other minor backgrounds from , , and are estimated from simulation.
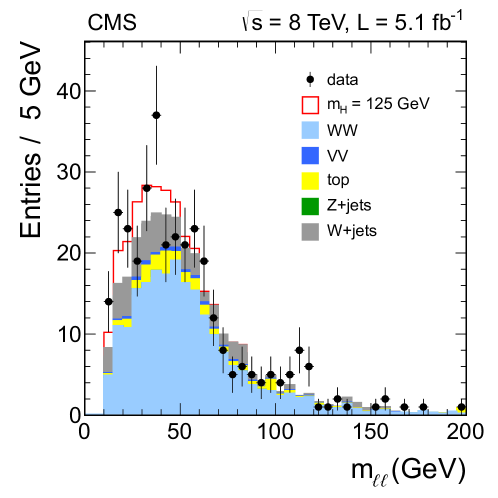
The data are analysed by training a BDT for each Higgs boson mass hypothesis in the zero-jet and one-jet event categories, while a simple selection strategy is employed in the VBF category [26]. In the BDT analysis, the Higgs boson signal is separated from the background by using a binned maximum-likelihood fit to the classifier distribution. The analysis is based on a simple selection strategy optimized for each mass hypothesis, where additional kinematic and topological requirements are applied to improve the signal-to-background ratio. One of the most sensitive variables to discriminate between decays and nonresonant production is the dilepton invariant mass . This quantity is shown in Fig. 7 for the zero-jet category after the full selection for \GeV, except for the selection on itself. Table 0.6.1 shows for the analysis the number of events selected in data, background estimates, and signal predictions for = 125\GeVin each analysis category after applying all the selection requirements. About 97% of the signal events selected in the zero-jet category are expected to be produced by the gluon-gluon fusion process, whereas 83% of the signal in the two-jet category is expected to be produced by the VBF process. The 95% CL expected and observed limits for the combination of the 7 and 8\TeVanalyses are shown in Fig. 8. A broad excess is observed that is consistent with a SM Higgs boson of mass 125\GeV. This is illustrated by the dotted curve in Fig. 8 showing the median expected limit in the presence of a SM Higgs boson with The expected significance for a SM Higgs of mass 125\GeVis 2.4 and the observed significance is 1.6.
Observed number of events, background estimates, and signal predictions for \GeVin each category of the analysis of the 8\TeVdata set. All the selection requirements have been applied. The combined experimental and theoretical, systematic and statistical uncertainties are shown. The Z process includes the dimuon, dielectron, and final states. Category: 0-jet 0-jet 1-jet 1-jet 2-jet 2-jet 87.6 9.5 60.4 6.7 19.5 3.7 9.7 1.9 0.4 0.1 0.3 0.1 2.2 0.2 37.7 12.5 2.4 0.3 8.7 4.9 0.1 0.0 3.1 1.8 Top 9.3 2.7 1.9 0.5 22.3 2.0 9.5 1.1 3.4 1.9 2.0 1.2 19.1 7.2 10.8 4.3 11.7 4.6 3.9 1.7 0.3 0.3 0.0 0.0 6.0 2.3 4.6 2.5 5.9 3.2 1.3 1.2 0.0 0.0 0.0 0.0 All backgrounds 124.2 12.4 115.5 15.0 61.7 7.0 33.1 5.7 4.1 1.9 5.4 2.2 Signal 23.9 5.2 14.9 3.3 10.3 3.0 4.4 1.3 1.5 0.2 0.8 0.1 Data 158 123 54 43 6 7
0.6.2
The decay mode is searched for in four exclusive subchannels, corresponding to different decays of the pair: , , , and , where electrons and muons arise from leptonic decays, and denotes hadronic decays. The latter are reconstructed by selecting decays consistent with the hypothesis of three charged pions, or one charged pion and up to two neutral pions [131]. The search is made in the mass range 110–145\GeV, and a signal should appear as a broad excess in the distribution of the -pair invariant mass .
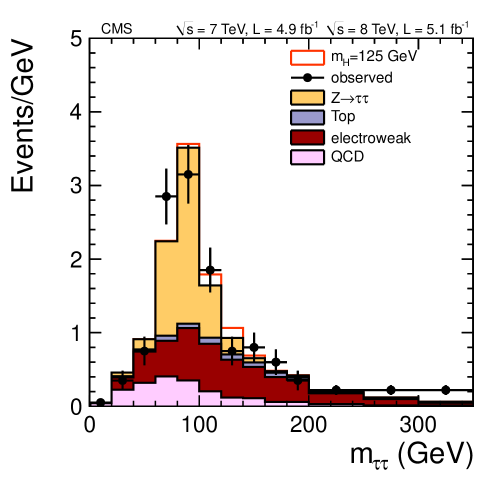
The sensitivity of the search is improved by classifying the events according to jet multiplicity and the transverse momentum of the reconstructed . The multiplicity of jets with reflects the production mechanism: events with zero or one jet are likely to come from the gluon-gluon fusion process, while events with two jets are candidates for VBF production. Events including jets with are removed from zero- and one-jet categories. The signal purities in the zero- and one-jet categories are increased, and the resolution is improved, by separating events into low- and high- subchannels. The high- subchannels are defined by in channels with a hadronic decay, and in the channel. The mass is reconstructed with an algorithm [132] combining the visible decay products and the missing transverse energy, achieving a resolution of about 20% on . Figure 9 shows as an example the reconstructed distribution in the VBF category for the combined and data samples.
Backgrounds in the and channels arise from and Drell–Yan production, while and production with a misidentified candidate from an electron, muon, or jet dominates in the hadronic channels. Backgrounds from decays are modelled with events in data where each muon is replaced with particles from simulated decays of a with the same momentum as the muon. Reducible backgrounds, comprising jets, QCD multijet production, and residual events, are estimated from the data [27]. An improved signal-to-background ratio is achieved by including explicitly in the event selection for the VBF production mechanism the pseudorapidity separation between forward jets and the large invariant mass of the dijet system. Table 0.6.2 shows the numbers of expected and observed events in the most sensitive event categories (VBF) for the 7 and 8\TeVdata sets. The expected signal yields for a SM Higgs boson with \GeVare also shown.
Numbers of expected and observed events in the most sensitive event categories (VBF) in the analysis for the 7 and 8\TeVdata sets. The expected signal yields for a SM Higgs boson with \GeVare also shown. Combined statistical and systematic uncertainties in each estimate are reported. Subchannel 53 5 100 9 56 12 5.3 0.4 QCD 35 7 41 9 7.4 1.4 jets 46 10 72 15 jets 13 2 2.5 0.6 70 8 7.0 1.7 14 3 24 2 6.7 1.5 Dibosons 1.2 0.9 2.9 2.1 11 2 2.4 0.9 All backgrounds 156 13 233 20 99 13 85 9 Signal (\GeV) 4.3 0.6 7.7 1.1 3.5 0.4 0.8 0.1 Data 142 263 110 83
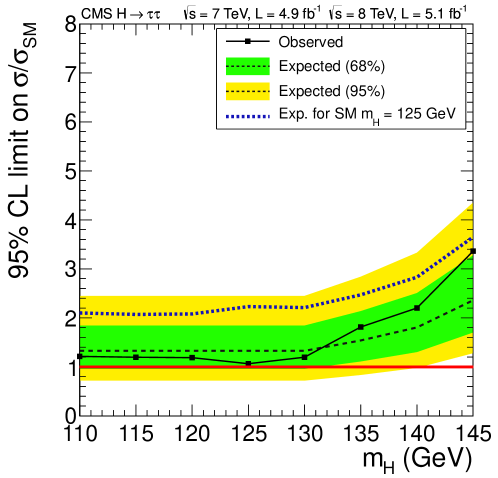
To search for the presence of a Higgs boson signal in the selected events, a binned maximum-likelihood fit to is performed jointly across the four final states, each with five event categories. Systematic uncertainties are represented by nuisance parameters in the fitting process. The expected and observed 95% CL limits on the signal strength for the combination of all categories are shown in Fig. 10. The expected and observed limits are 1.3 and 1.1 times the SM Higgs boson cross section at mass 125\GeV, respectively. The expected significance for a SM Higgs boson of mass 125\GeVis 1.4, and the observed value is zero.
0.6.3
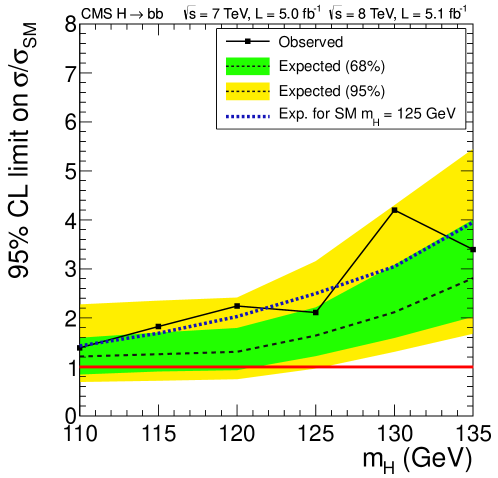
For \GeV, the decay has the largest branching fraction of the five search modes, but the inclusive signal is overwhelmed by QCD production of bottom quarks. The analysis is therefore designed to search for the associated production of the Higgs boson in events where a dijet resonance is produced at high in association with a or boson; this largely suppresses the QCD background. Five independent search channels are explored corresponding to different decays of the vector boson: , , and . Events are further separated into two categories based on the of the vector boson, ranging from – for the lowest bin in the search, to greater than 170\GeVfor the highest bin in the search. For the search, two subchannels are defined as and . The two jets comprising the candidate Higgs boson decay are required to be identified as jets, and the dijet system must satisfy a threshold that is optimized within each channel: greater than 120\GeVfor , 160\GeVfor , and no explicit threshold for
Dominant backgrounds arise from production of vector bosons in association with jets, pair- or single-production of top quarks, and diboson production (, , ) with one of the bosons decaying hadronically. Significant background rejection is achieved in general by requiring large for the dijet, while also requiring that there be minimal additional jet activity and that the vector boson and dijet be back to back in azimuth. The effect on the signal efficiency of this selection due to higher-order electroweak [133] and QCD [91] corrections are accounted for in the systematic uncertainties. Further signal discrimination is obtained from the dijet invariant mass, which is expected to peak near . A multivariate regression algorithm to better estimate -jet is trained on jets in simulated signal events and achieves a final dijet mass resolution of 8–9% for . The performance of the regression algorithm is checked in data using jets and events.
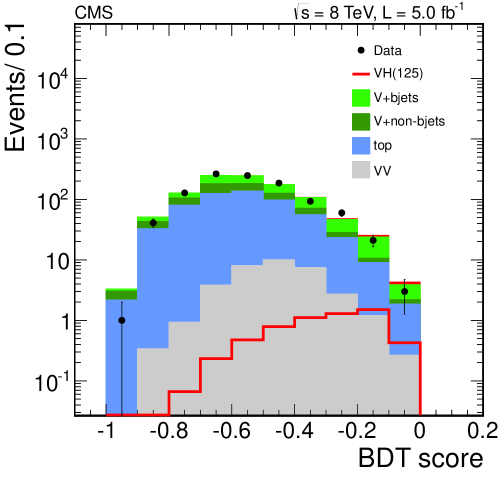
A search for the signal is made in the distribution of scores of a BDT trained at discrete mass points. Input variables to the BDT algorithm exploit kinematic and topological information about the vector boson and dijet systems, and the colour-singlet nature of the Higgs boson [134]. The distribution of scores in simulated background events is checked using control regions in the data designed to enrich individual background contributions. Figure 11 shows as an example the BDT scores for the high- subchannel of the channel in the data set, after all selection criteria have been applied.
The rates for the dominant backgrounds arising from production of jets and top-quark pairs are estimated in data [28], while contributions from single-top and diboson production are estimated from simulation studies. The signal is then searched for as an excess in the BDT score distribution using the predicted shapes for signal and background events, for Higgs boson masses in the range 110–135\GeV.
Combined results for expected and observed CL limits obtained from the 7 and 8\TeVdata sets are displayed in Fig. 12. The expected and observed limits are 1.6 and 2.1 times the SM Higgs boson cross section at mass 125\GeV. The expected local -value for a SM Higgs of mass 125\GeVcorresponds to 1.9, while the observed value corresponds to 0.7.
0.7 Combined results
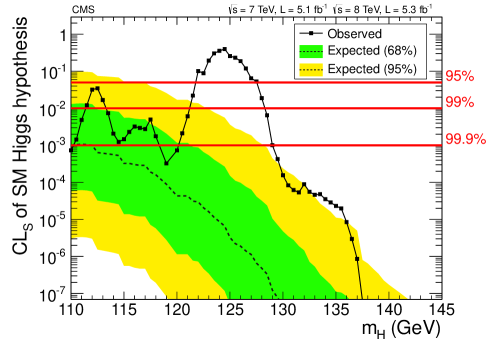
The individual results for the channels analysed for the five decay modes, summarised in Table 0.4, are combined using the methods outlined in Section 0.4. The combination assumes the relative branching fractions predicted by the SM and takes into account the experimental statistical and systematic uncertainties as well as the theoretical uncertainties, which are dominated by the imperfect knowledge of the QCD scale and parton distribution functions. The is shown in Fig. 13 as a function of the Higgs boson mass hypothesis. The observed values are shown by the solid points. The dashed line indicates the median of the expected results for the background-only hypothesis, with the green (dark) and yellow (light) bands indicating the ranges in which the values are expected to lie in 68% and 95% of the experiments under the background-only hypothesis. The probabilities for an observation, in the absence of a signal, to lie above or below the 68% (95%) band are 16% (2.5%) each. The thick horizontal lines indicate values of 0.05, 0.01, and 0.001. The mass regions where the observed values are below these lines are excluded with the corresponding () confidence levels. Our previously published results exclude the SM Higgs boson from 127 to 600\GeV [21]. In the search described here, the SM Higgs boson is excluded at 95% CL in the range \GeV. In the range \GeVa significant excess is seen and the SM Higgs boson cannot be excluded at 95% CL.
0.7.1 Significance of the observed excess
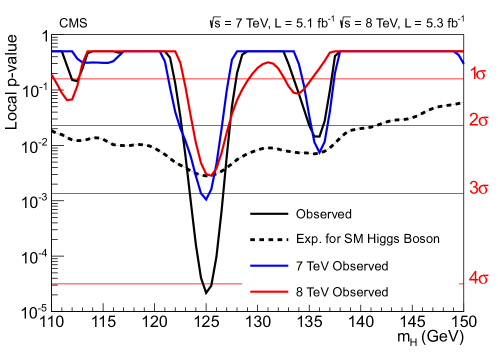
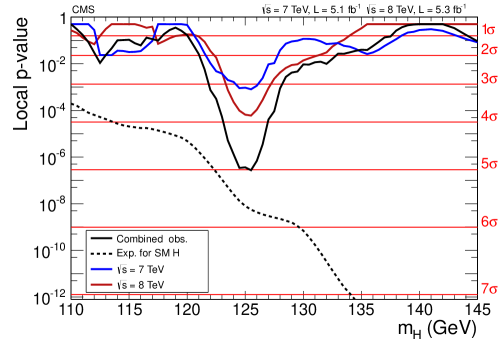
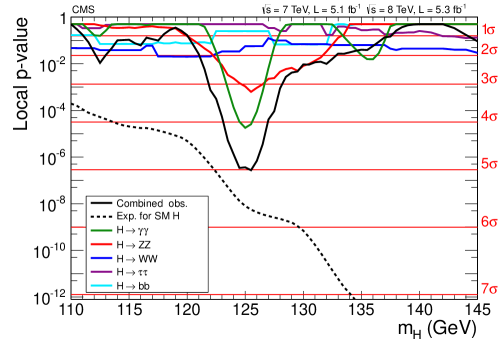
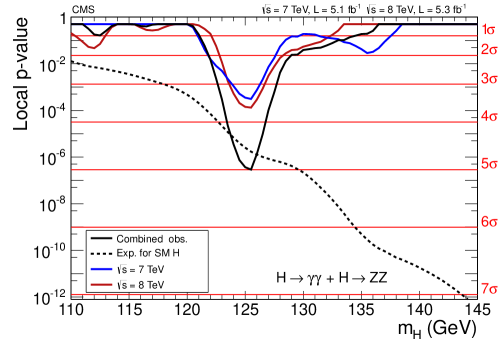
The consistency of the observed excess with the background-only hypothesis may be judged from Fig. 14, which shows a scan of the local -value for the 7 and 8\TeVdata sets and their combination. The 7 and 8\TeVdata sets exhibit an excess of and significance, respectively, for a Higgs boson mass of approximately 125\GeV. In the overall combination the significance is 5.0 for . Figure 15 gives the local -value for the five decay modes individually and displays the expected overall -value.
The largest contributors to the overall excess in the combination are the and decay modes. They both have very good mass resolution, allowing good localization of the invariant mass of a putative resonance responsible for the excess. Their combined significance reaches 5.0 (Fig. 16). The decay mode has an exclusion sensitivity comparable to the and decay modes but does not have a good mass resolution. It has an excess with local significance 1.6 for \GeV. When added to the and decay modes, the combined significance becomes 5.1 . Adding the and channels in the combination, the final significance becomes 5.0 . Table 0.7.1 summarises the expected and observed local -values for a SM Higgs boson mass hypothesis of 125.5\GeVfor the various combinations of channels.
The expected and observed local -values, expressed as the corresponding number of standard deviations of the observed excess from the background-only hypothesis, for \GeV, for various combinations of decay modes. Decay mode/combination Expected () Observed () 2.8 4.1 3.8 3.2 + 2.4 0.5 + 4.7 5.0 + + 5.2 5.1 + + + + 5.8 5.0
The global -value for the search range 115–130 (110–145)\GeVis calculated using the method suggested in Ref. [115], and corresponds to (). These results confirm the very low probability for an excess as large as or larger than that observed to arise from a statistical fluctuation of the background. The excess constitutes the observation of a new particle with a mass near 125\GeV, manifesting itself in decays to two photons or to . These two decay modes indicate that the new particle is a boson; the two-photon decay implies that its spin is different from one [135, 136].
0.7.2 Mass of the observed boson
The mass of the observed boson is determined using the and decay modes, with the former dominating the precision of the measurement. The calibration of the energy scale in the decay mode is achieved with reference to the known \cPZ boson mass, as described in Section 0.5.1. There are two main sources of systematic uncertainty: (i) imperfect simulation of the differences between electrons and photons and (ii) the need to extrapolate from to \GeV. The systematic uncertainties are evaluated by making comparisons between data and simulated samples of and (\GeV). The two uncertainties, which together amount to 0.5%, are assumed to be fully correlated between all the event categories in the 7 and 8\TeVdata. For the decay mode the energy scale (for electrons) and momentum scale (for muons) are calibrated using the leptonic decays of the boson, with an assigned uncertainty of 0.4%.
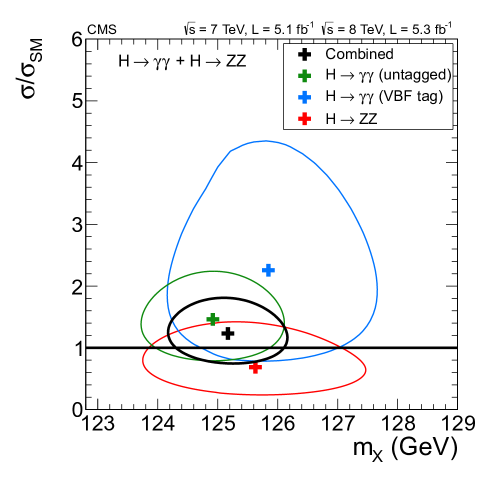
Figure 17 shows the two-dimensional 68% CL regions for the signal strength versus for the three channels (untagged , dijet-tagged , and ). The combined 68% CL contour shown in Fig. 17 assumes that the relative event yields among the three channels are those expected from the standard model, while the overall signal strength is a free parameter.
To extract the value of in a model-independent way, the signal yields of the three channels are allowed to vary independently. Thus the expected event yields in these channels are scaled by independent factors, while the signal is assumed to be due to a particle with a unique mass . The combined best-fit mass is \GeV.
0.7.3 Compatibility with the SM Higgs boson hypothesis
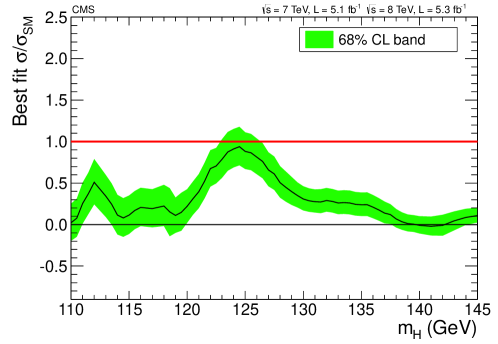
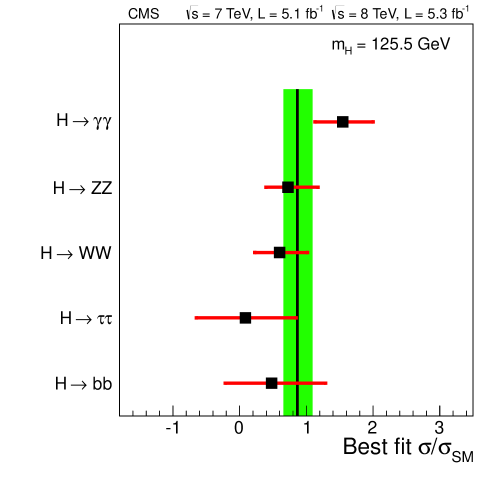
A first test of the compatibility of the observed boson with the SM Higgs boson is provided by examination of the best-fit value for the common signal strength , obtained in a combination of all search channels. Figure 18 shows a scan of the overall obtained in the combination of all channels versus a hypothesised Higgs boson mass . The band corresponds to the uncertainty (statistical and systematic). The excesses seen in the 7\TeVand 8\TeVdata, and in their combination, around 125\GeVare consistent with unity within the uncertainties. The observed value for an excess at 125.5\GeVin a combination of all data is . The different decay channels and data sets have been examined for self-consistency. Figure 19 shows the measured values of results obtained for the different decay modes. These results are consistent, within uncertainties, with the expectations for a SM Higgs boson.
0.8 Conclusions
Results are presented from searches for the standard model Higgs boson in proton-proton collisions at and 8\TeVin the CMS experiment at the LHC, using data samples corresponding to integrated luminosities of up to 5.1\fbinvat 7\TeVand 5.3\fbinvat 8\TeV. The search is performed in five decay modes: , , , , and . An excess of events is observed above the expected background, with a local significance of 5.0, at a mass near 125\GeV, signalling the production of a new particle. The expected local significance for a standard model Higgs boson of that mass is 5.8. The global -value in the search range of 115–130 (110–145)\GeVcorresponds to 4.6 (4.5 ). The excess is most significant in the two decay modes with the best mass resolution, and , and a fit to these signals gives a mass of . The decay to two photons indicates that the new particle is a boson with spin different from one. The results presented here are consistent, within uncertainties, with expectations for a standard model Higgs boson. The collection of further data will enable a more rigorous test of this conclusion and an investigation of whether the properties of the new particle imply physics beyond the standard model.
Acknowledgements
We congratulate our colleagues in the CERN accelerator departments for the excellent performance of the LHC machine. We thank the computing centres in the Worldwide LHC computing Grid for the provisioning and excellent performance of computing infrastructure essential to our analyses. We gratefully acknowledge the contributions of the technical staff at CERN and other CMS institutes. We also thank the administrative staff at CERN and the other CMS institutes and acknowledge support from BMWF and FWF (Austria); FNRS and FWO (Belgium); CNPq, CAPES, FAPERJ, and FAPESP (Brazil); MES (Bulgaria); CERN; CAS, MoST, and NSFC (China); COLCIENCIAS (Colombia); MSES (Croatia); RPF (Cyprus); MEYS (Czech Republic); MoER, SF0690030s09 and ERDF (Estonia); Academy of Finland, MEC, and HIP (Finland); CEA and CNRS/IN2P3 (France); BMBF, DFG, and HGF (Germany); GSRT (Greece); OTKA and NKTH (Hungary); DAE and DST (India); IPM (Iran); SFI (Ireland); INFN (Italy); NRF and WCU (Korea); LAS (Lithuania); CINVESTAV, CONACYT, SEP, and UASLP-FAI (Mexico); MSI (New Zealand); PAEC (Pakistan); MSHE and NSC (Poland); FCT (Portugal); JINR (Armenia, Belarus, Georgia, Ukraine, Uzbekistan); MON, RosAtom, RAS and RFBR (Russia); MSTD (Serbia); SEIDI and CPAN (Spain); Swiss Funding Agencies (Switzerland); NSC (Taipei); TUBITAK and TAEK (Turkey); NASU (Ukraine); STFC (United Kingdom); DOE and NSF (USA). Individuals have received support from the Marie-Curie programme and the European Research Council (European Union); the Leventis Foundation; the A. P. Sloan Foundation; the Alexander von Humboldt Foundation; the Austrian Science Fund (FWF); the Belgian Federal Science Policy Office; the Fonds pour la Formation à la Recherche dans l’Industrie et dans l’Agriculture (FRIA-Belgium); the Agentschap voor Innovatie door Wetenschap en Technologie (IWT-Belgium); the Council of Science and Industrial Research, India; the Compagnia di San Paolo (Torino); and the HOMING PLUS programme of Foundation for Polish Science, cofinanced from European Union, Regional Development Fund.
References
- [1] F. Englert and R. Brout, “Broken symmetry and the mass of gauge vector mesons”, Phys. Rev. Lett. 13 (1964) 321, 10.1103/PhysRevLett.13.321.
- [2] P. W. Higgs, “Broken symmetries, massless particles and gauge fields”, Phys. Lett. 12 (1964) 132, 10.1016/0031-9163(64)91136-9.
- [3] P. W. Higgs, “Broken symmetries and the masses of gauge bosons”, Phys. Rev. Lett. 13 (1964) 508, 10.1103/PhysRevLett.13.508.
- [4] G. S. Guralnik, C. R. Hagen, and T. W. B. Kibble, “Global conservation laws and massless particles”, Phys. Rev. Lett. 13 (1964) 585, 10.1103/PhysRevLett.13.585.
- [5] P. W. Higgs, “Spontaneous symmetry breakdown without massless bosons”, Phys. Rev. 145 (1966) 1156, 10.1103/PhysRev.145.1156.
- [6] T. W. B. Kibble, “Symmetry breaking in non-Abelian gauge theories”, Phys. Rev. 155 (1967) 1554, 10.1103/PhysRev.155.1554.
- [7] S. L. Glashow, “Partial-symmetries of weak interactions”, Nucl. Phys. 22 (1961) 579, 10.1016/0029-5582(61)90469-2.
- [8] S. Weinberg, “A Model of Leptons”, Phys. Rev. Lett. 19 (1967) 1264, 10.1103/PhysRevLett.19.1264.
- [9] A. Salam, “Weak and electromagnetic interactions”, in Elementary particle physics: relativistic groups and analyticity, N. Svartholm, ed., p. 367. Almqvist & Wiskell, 1968. Proceedings of the eighth Nobel symposium.
- [10] J. M. Cornwall, D. N. Levin, and G. Tiktopoulos, “Uniqueness of spontaneously broken gauge theories”, Phys. Rev. Lett. 30 (1973) 1268, 10.1103/PhysRevLett.30.1268.
- [11] J. M. Cornwall, D. N. Levin, and G. Tiktopoulos, “Derivation of Gauge Invariance from High-Energy Unitarity Bounds on the s Matrix”, Phys. Rev. D 10 (1974) 1145, 10.1103/PhysRevD.10.1145. Also Erratum, 10.1103/PhysRevD.11.972.
- [12] C. H. Llewellyn Smith, “High-Energy Behavior and Gauge Symmetry”, Phys. Lett. B 46 (1973) 233, 10.1016/0370-2693(73)90692-8.
- [13] B. W. Lee, C. Quigg, and H. B. Thacker, “Weak interactions at very high energies: The role of the Higgs-boson mass”, Phys. Rev. D 16 (1977) 1519, 10.1103/PhysRevD.16.1519.
- [14] ALEPH, CDF, D0, DELPHI, L3, OPAL, SLD Collaborations, the LEP Electroweak Working Group, the Tevatron Electroweak Working Group, and the SLD Electroweak and Heavy Flavour Groups, “Precision Electroweak Measurements and Constraints on the Standard Model”, CERN PH-EP-2010-095, (2010). At this time, the most up-to-date Higgs boson mass constraints come from http://lepewwg.web.cern.ch/LEPEWWG/plots/winter2012/.
- [15] ALEPH, DELPHI, L3, OPAL Collaborations, and LEP Working Group for Higgs Boson Searches, “Search for the standard model Higgs boson at LEP”, Phys. Lett. B 565 (2003) 61, 10.1016/S0370-2693(03)00614-2, arXiv:hep-ex/0306033.
- [16] CDF and D0 Collaborations, “Combination of Tevatron Searches for the Standard Model Higgs Boson in the Decay Mode”, Phys. Rev. Lett. 104 (2010) 061802, 10.1103/PhysRevLett.104.061802.
- [17] CDF Collaboration, “Combined search for the standard model Higgs boson decaying to a pair using the full CDF data set”, (2012). arXiv:1207.1707. Submitted to Phys. Rev. Lett.
- [18] CDF and D0 Collaborations, “Evidence for a particle produced in association with weak bosons and decaying to a bottom-antibottom quark pair in Higgs boson search at the Tevatron”, (2012). arXiv:1207.6436. Submitted to Phys. Rev. Lett.
- [19] D0 Collaboration, “Combined search for the standard model Higgs boson decaying to using the D0 Run II data set”, (2012). arXiv:1207.6631. Submitted to Phys. Rev. Lett.
- [20] L. Evans and P. Bryant (editors), “LHC Machine”, JINST 3 (2008) S08001, 10.1088/1748-0221/3/08/S08001.
- [21] CMS Collaboration, “Combined results of searches for the standard model Higgs boson in pp collisions at TeV”, Phys. Lett. B 710 (2012) 26, 10.1016/j.physletb.2012.02.064, arXiv:1202.1488.
- [22] ATLAS Collaboration, “Combined search for the Standard Model Higgs boson in collisions at TeV with the ATLAS detector”, Phys. Rev. D 86 (2012) 032003, 10.1103/PhysRevD.86.032003, arXiv:1207.0319.
- [23] LHC Higgs Cross Section Working Group et al., “Handbook of LHC Higgs Cross Sections: 1. Inclusive Observables”, (CERN, Geneva, 2011). arXiv:1101.0593.
- [24] CMS Collaboration, “Search for the standard model Higgs boson decaying into two photons in collisions at TeV”, Phys. Lett. B 710 (2012) 403, 10.1016/j.physletb.2012.03.003, arXiv:1202.1487.
- [25] CMS Collaboration, “Search for the standard model Higgs boson in the decay channel in collisions at ”, Phys. Rev. Lett. 108 (2012) 111804, 10.1103/PhysRevLett.108.111804, arXiv:1202.1997.
- [26] CMS Collaboration, “Search for the standard model Higgs boson decaying to \PWp\PWm in the fully leptonic final state in pp collisions at ”, Phys. Lett. B 710 (2012) 91, 10.1016/j.physletb.2012.02.076, arXiv:1202.1489.
- [27] CMS Collaboration, “Search for neutral Higgs bosons decaying to tau pairs in collisions at ”, Phys. Lett. B 713 (2012) 68, 10.1016/j.physletb.2012.05.028, arXiv:1202.4083.
- [28] CMS Collaboration, “Search for the standard model Higgs boson decaying to bottom quarks in pp collisions at TeV”, Phys. Lett. B 710 (2012) 284, 10.1016/j.physletb.2012.02.085, arXiv:1202.4195.
- [29] M. Della Negra et al., “Muon trigger and identification”, in Proceedings of the Large Hadron Collider Workshop, G. Jarlskog and D. Rein, eds., p. 467. Aachen, Germany, 1990. CERN 90-10-V-3/ECFA 90-133-V-3.
- [30] CMS Collaboration, “Letter of intent by the CMS Collaboration for a general purpose detector at the LHC”, Technical Report CERN-LHCC-92-03, CERN-LHCC-I-1, CERN, (1992).
- [31] N. Ellis and T. S. Virdee, “Experimental challenges in high luminosity collider physics”, Ann. Rev. Nucl. Part. Sci. 44 (1994) 609, 10.1146/annurev.ns.44.120194.003141.
- [32] CMS Collaboration, “The CMS experiment at the CERN LHC”, JINST 3 (2008) S08004, 10.1088/1748-0221/3/08/S08004.
- [33] CMS Collaboration, “b-Jet Identification in the CMS Experiment”, CMS Physics Analysis Summary CMS-PAS-BTV-11-004, (2012).
- [34] CMS Collaboration, “Upsilon production cross section in collisions at TeV”, Phys. Rev. D 83 (2011) 112004, 10.1103/PhysRevD.83.112004, arXiv:1012.5545.
- [35] CMS Collaboration, “Particle–Flow Event Reconstruction in CMS and Performance for Jets, Taus, and \MET”, CMS Physics Analysis Summary CMS-PAS-PFT-09-001, (2009).
- [36] CMS Collaboration, “Commissioning of the Particle-flow Event Reconstruction with the first LHC collisions recorded in the CMS detector”, CMS Physics Analysis Summary CMS-PAS-PFT-10-001, (2010).
- [37] M. Cacciari, G. P. Salam, and G. Soyez, “The anti- jet clustering algorithm”, JHEP 04 (2008) 063, 10.1088/1126-6708/2008/04/063.
- [38] M. Cacciari and G. P. Salam, “Pileup subtraction using jet areas”, Phys. Lett. B 659 (2008) 119, 10.1016/j.physletb.2007.09.077.
- [39] M. Cacciari, G. P. Salam, and G. Soyez, “The catchment area of jets”, JHEP 04 (2008) 005, 10.1088/1126-6708/2008/04/005.
- [40] M. Cacciari, G. P. Salam, and G. Soyez, “FastJet user manual (for version 3.0.2)”, Eur. Phys. J. C 72 (2012) 1896, 10.1140/epjc/s10052-012-1896-2, arXiv:1111.6097.
- [41] CMS Collaboration, “Determination of jet energy calibration and transverse momentum resolution in CMS”, JINST 6 (2011) 11002, 10.1088/1748-0221/6/11/P11002, arXiv:1107.4277.
- [42] CMS Collaboration, “Missing transverse energy performance of the CMS detector”, JINST 6 (2011) 9001, 10.1088/1748-0221/6/09/P09001, arXiv:1106.5048.
- [43] CMS Collaboration, “Commissioning of the particle-flow event reconstruction with leptons from J/ and W decays at 7 TeV”, CMS Physics Analysis Summary CMS-PAS-PFT-10-003, (2010).
- [44] CMS Collaboration, “Electron Reconstruction and Identification at TeV”, CMS Physics Analysis Summary CMS-PAS-EGM-10-004, (2010).
- [45] S. Baffioni et al., “Electron reconstruction in CMS”, Eur. Phys. J. C 49 (2007) 1099, 10.1140/epjc/s10052-006-0175-5.
- [46] W. Adam et al., “Reconstruction of electrons with the Gaussian-sum filter in the CMS tracker at the LHC”, J. Phys. G 31 (2005) N9, 10.1088/0954-3899/31/9/N01.
- [47] CMS Collaboration, “Absolute Calibration of the Luminosity Measurement at CMS: Winter 2012 Update”, CMS Physics Analysis Summary CMS-PAS-SMP-12-008, (2012).
- [48] S. van der Meer, “Calibration of the effective beam height in the ISR”, Technical Report CERN-ISR-PO-68-31, CERN, Geneva, (1968).
- [49] J. R. Ellis, M. K. Gaillard, and D. V. Nanopoulos, “A phenomenological profile of the Higgs boson”, Nucl. Phys. B 106 (1976) 292, 10.1016/0550-3213(76)90382-5.
- [50] H. M. Georgi et al., “Higgs Bosons from Two Gluon Annihilation in Proton Proton Collisions”, Phys. Rev. Lett. 40 (1978) 692, 10.1103/PhysRevLett.40.692.
- [51] S. L. Glashow, D. V. Nanopoulos, and A. Yildiz, “Associated Production of Higgs Bosons and Z Particles”, Phys. Rev. D 18 (1978) 1724, 10.1103/PhysRevD.18.1724.
- [52] R. N. Cahn et al., “Transverse Momentum Signatures for Heavy Higgs Bosons”, Phys. Rev. D 35 (1987) 1626, 10.1103/PhysRevD.35.1626.
- [53] J. F. Gunion, G. L. Kane, and J. Wudka, “Search techniques for charged and neutral intermediate mass Higgs bosons”, Nucl. Phys. B 299 (1988) 231, 10.1016/0550-3213(88)90284-2.
- [54] D. L. Rainwater and D. Zeppenfeld, “Searching for in weak boson fusion at the LHC”, JHEP 12 (1997) 005, 10.1088/1126-6708/1997/12/005, arXiv:hep-ph/9712271.
- [55] D. L. Rainwater, D. Zeppenfeld, and K. Hagiwara, “Searching for H in weak boson fusion at the CERN LHC”, Phys. Rev. D 59 (1998) 014037, 10.1103/PhysRevD.59.014037, arXiv:hep-ph/9808468.
- [56] D. L. Rainwater and D. Zeppenfeld, “Observing in weak boson fusion with dual forward jet tagging at the CERN LHC”, Phys. Rev. D 60 (1999) 113004, 10.1103/PhysRevD.60.113004, arXiv:hep-ph/9906218. Also Erratum, 10.1103/PhysRevD.61.099901.
- [57] A. Djouadi, M. Spira, and P. M. Zerwas, “Production of Higgs bosons in proton colliders: QCD corrections”, Phys. Lett. B 264 (1991) 440, 10.1016/0370-2693(91)90375-Z.
- [58] S. Dawson, “Radiative corrections to Higgs boson production”, Nucl. Phys. B 359 (1991) 283, 10.1016/0550-3213(91)90061-2.
- [59] M. Spira et al., “Higgs boson production at the LHC”, Nucl. Phys. B 453 (1995) 17, 10.1016/0550-3213(95)00379-7, arXiv:hep-ph/9504378.
- [60] R. V. Harlander and W. B. Kilgore, “Next-to-next-to-leading order Higgs production at hadron colliders”, Phys. Rev. Lett. 88 (2002) 201801, 10.1103/PhysRevLett.88.201801, arXiv:hep-ph/0201206.
- [61] C. Anastasiou and K. Melnikov, “Higgs boson production at hadron colliders in NNLO QCD”, Nucl. Phys. B 646 (2002) 220, 10.1016/S0550-3213(02)00837-4, arXiv:hep-ph/0207004.
- [62] V. Ravindran, J. Smith, and W. L. van Neerven, “NNLO corrections to the total cross section for Higgs boson production in hadron hadron collisions”, Nucl. Phys. B 665 (2003) 325, 10.1016/S0550-3213(03)00457-7, arXiv:hep-ph/0302135.
- [63] S. Catani et al., “Soft-gluon resummation for Higgs boson production at hadron colliders”, JHEP 07 (2003) 028, 10.1088/1126-6708/2003/07/028.
- [64] U. Aglietti et al., “Two-loop light fermion contribution to Higgs production and decays”, Phys. Lett. B 595 (2004) 432, 10.1016/j.physletb.2004.06.063, arXiv:hep-ph/0404071.
- [65] G. Degrassi and F. Maltoni, “Two-loop electroweak corrections to Higgs production at hadron colliders”, Phys. Lett. B 600 (2004) 255, 10.1016/j.physletb.2004.09.008, arXiv:hep-ph/0407249.
- [66] S. Actis et al., “NLO Electroweak Corrections to Higgs Boson Production at Hadron Colliders”, Phys. Lett. B 670 (2008) 12, 10.1016/j.physletb.2008.10.018, arXiv:0809.1301.
- [67] C. Anastasiou, R. Boughezal, and F. Petriello, “Mixed QCD-electroweak corrections to Higgs boson production in gluon fusion”, JHEP 04 (2009) 003, 10.1088/1126-6708/2009/04/003, arXiv:0811.3458.
- [68] D. de Florian and M. Grazzini, “Higgs production through gluon fusion: updated cross sections at the Tevatron and the LHC”, Phys. Lett. B 674 (2009) 291, 10.1016/j.physletb.2009.03.033, arXiv:0901.2427.
- [69] J. Baglio and A. Djouadi, “Higgs production at the lHC”, JHEP 03 (2011) 055, 10.1007/JHEP03(2011)055, arXiv:1012.0530.
- [70] D. de Florian and M. Grazzini, “Higgs production at the LHC: updated cross sections at TeV”, (2012). arXiv:1206.4133.
- [71] G. Bozzi et al., “Transverse-momentum resummation and the spectrum of the Higgs boson at the LHC”, Nucl. Phys. B 737 (2006) 73, 10.1016/j.nuclphysb.2005.12.022, arXiv:hep-ph/0508068.
- [72] D. de Florian et al., “Transverse-momentum resummation: Higgs boson production at the Tevatron and the LHC”, JHEP 11 (2011) 064, 10.1007/JHEP11(2011)064.
- [73] G. Passarino, C. Sturm, and S. Uccirati, “Higgs Pseudo-Observables, Second Riemann Sheet and All That”, Nucl. Phys. B 834 (2010) 77, 10.1016/j.nuclphysb.2010.03.013, arXiv:1001.3360.
- [74] I. W. Stewart and F. J. Tackmann, “Theory Uncertainties for Higgs and Other Searches Using Jet Bins”, Phys. Rev. D 85 (2012) 034011, 10.1103/PhysRevD.85.034011, arXiv:1107.2117.
- [75] A. Djouadi, J. Kalinowski, and M. Spira, “HDECAY: A program for Higgs boson decays in the standard model and its supersymmetric extension”, Comput. Phys. Commun. 108 (1998) 56, 10.1016/S0010-4655(97)00123-9, arXiv:hep-ph/9704448.
- [76] A. Djouadi et al., “An update of the program HDECAY”, in The Les Houches 2009 workshop on TeV colliders: The tools and Monte Carlo working group summary report. 2010. arXiv:1003.1643.
- [77] A. Bredenstein et al., “Precise predictions for the Higgs-boson decay H WW/ZZ 4 leptons”, Phys. Rev. D 74 (2006) 013004, 10.1103/PhysRevD.74.013004, arXiv:hep-ph/0604011.
- [78] A. Bredenstein et al., “Radiative corrections to the semileptonic and hadronic Higgs-boson decays H WW/ZZ 4 fermions”, JHEP 02 (2007) 080, 10.1088/1126-6708/2007/02/080, arXiv:hep-ph/0611234.
- [79] S. Actis et al., “NNLO Computational Techniques: the Cases and ”, Nucl. Phys. B 811 (2009) 182, 10.1016/j.nuclphysb.2008.11.024, arXiv:0809.3667.
- [80] A. Denner et al., “Standard Model Higgs-Boson Branching Ratios with Uncertainties”, Eur. Phys. J. C 71 (2011) 1753, 10.1140/epjc/s10052-011-1753-8, arXiv:1107.5909.
- [81] M. Ciccolini, A. Denner, and S. Dittmaier, “Strong and Electroweak Corrections to the Production of a Higgs Boson+2 Jets via Weak Interactions at the Large Hadron Collider”, Phys. Rev. Lett. 99 (2007) 161803, 10.1103/PhysRevLett.99.161803, arXiv:0707.0381.
- [82] M. Ciccolini, A. Denner, and S. Dittmaier, “Electroweak and QCD corrections to Higgs production via vector-boson fusion at the LHC”, Phys. Rev. D 77 (2008) 013002, 10.1103/PhysRevD.77.013002, arXiv:0710.4749.
- [83] T. Figy, C. Oleari, and D. Zeppenfeld, “Next-to-leading order jet distributions for Higgs boson production via weak-boson fusion”, Phys. Rev. D 68 (2003) 073005, 10.1103/PhysRevD.68.073005, arXiv:hep-ph/0306109.
- [84] K. Arnold et al., “VBFNLO: A parton level Monte Carlo for processes with electroweak bosons”, Comput. Phys. Commun. 180 (2009) 1661, 10.1016/j.cpc.2009.03.006, arXiv:0811.4559.
- [85] P. Bolzoni et al., “Higgs production via vector-boson fusion at NNLO in QCD”, Phys. Rev. Lett. 105 (2010) 011801, 10.1103/PhysRevLett.105.011801, arXiv:1003.4451.
- [86] T. Han and S. Willenbrock, “QCD correction to the and total cross-sections”, Phys. Lett. B 273 (1991) 167, 10.1016/0370-2693(91)90572-8.
- [87] O. Brein, A. Djouadi, and R. Harlander, “NNLO QCD corrections to the Higgs-strahlung processes at hadron colliders”, Phys. Lett. B 579 (2004) 149, 10.1016/j.physletb.2003.10.112, arXiv:hep-ph/0307206.
- [88] M. L. Ciccolini, S. Dittmaier, and M. Krämer, “Electroweak radiative corrections to associated and production at hadron colliders”, Phys. Rev. D 68 (2003) 073003, 10.1103/PhysRevD.68.073003, arXiv:hep-ph/0306234.
- [89] R. Hamberg, W. L. van Neerven, and T. Matsuura, “A complete calculation of the order correction to the Drell-Yan factor”, Nucl. Phys. B 359 (1991) 343, 10.1016/0550-3213(91)90064-5.
- [90] A. Denner et al., “EW corrections to Higgs strahlung at the Tevatron and the LHC with HAWK”, (2011). arXiv:1112.5258.
- [91] G. Ferrera, M. Grazzini, and F. Tramontano, “Associated WH production at hadron colliders: a fully exclusive QCD calculation at NNLO”, Phys. Rev. Lett. 107 (2011) 152003, 10.1103/PhysRevLett.107.152003, arXiv:1107.1164.
- [92] W. Beenakker et al., “Higgs radiation off top quarks at the Tevatron and the LHC”, Phys. Rev. Lett. 87 (2001) 201805, 10.1103/PhysRevLett.87.201805, arXiv:hep-ph/0107081.
- [93] W. Beenakker et al., “NLO QCD corrections to H production in hadron collisions.”, Nucl. Phys. B 653 (2003) 151, 10.1016/S0550-3213(03)00044-0, arXiv:hep-ph/0211352.
- [94] S. Dawson et al., “Associated top quark Higgs boson production at the LHC”, Phys. Rev. D 67 (2003) 071503, 10.1103/PhysRevD.67.071503, arXiv:hep-ph/0211438.
- [95] S. Dawson et al., “Associated Higgs production with top quarks at the Large Hadron Collider: NLO QCD corrections”, Phys. Rev. D 68 (2003) 034022, 10.1103/PhysRevD.68.034022, arXiv:hep-ph/0305087.
- [96] M. Botje et al., “The PDF4LHC Working Group Interim Recommendations”, (2011). arXiv:1101.0538.
- [97] S. Alekhin et al., “The PDF4LHC Working Group Interim Report”, (2011). arXiv:1101.0536.
- [98] H.-L. Lai et al., “New parton distributions for collider physics”, Phys. Rev. D 82 (2010) 074024, 10.1103/PhysRevD.82.074024, arXiv:1007.2241.
- [99] A. D. Martin et al., “Parton distributions for the LHC”, Eur. Phys. J. C 63 (2009) 189, 10.1140/epjc/s10052-009-1072-5, arXiv:0901.0002.
- [100] NNPDF Collaboration, “Impact of Heavy Quark Masses on Parton Distributions and LHC Phenomenology”, Nucl. Phys. B 849 (2011) 296, 10.1016/j.nuclphysb.2011.03.021, arXiv:1101.1300.
- [101] C. Anastasiou et al., “Inclusive Higgs boson cross-section for the LHC at 8 TeV”, JHEP 04 (2012) 004, 10.1007/JHEP04(2012)004, arXiv:1202.3638.
- [102] LHC Higgs Cross Section Working Group et al., “Handbook of LHC Higgs Cross Sections: 2. Differential Distributions”, (CERN, Geneva, 2012). arXiv:1201.3084.
- [103] GEANT4 Collaboration, “GEANT4—a simulation toolkit”, Nucl. Instrum. Meth. A 506 (2003) 250, 10.1016/S0168-9002(03)01368-8.
- [104] S. Alioli et al., “NLO Higgs boson production via gluon fusion matched with shower in POWHEG”, JHEP 04 (2009) 002, 10.1088/1126-6708/2009/04/002.
- [105] P. Nason and C. Oleari, “NLO Higgs boson production via vector-boson fusion matched with shower in POWHEG”, JHEP 02 (2010) 037, 10.1007/JHEP02(2010)037.
- [106] T. Sjöstrand, S. Mrenna, and P. Z. Skands, “PYTHIA 6.4 physics and manual”, JHEP 05 (2006) 026, 10.1088/1126-6708/2006/05/026.
- [107] G. Bozzi et al., “The spectrum of the Higgs boson at the LHC in QCD perturbation theory”, Phys. Lett. B 564 (2003) 65, 10.1016/S0370-2693(03)00656-7.
- [108] C. Anastasiou, K. Melnikov, and F. Petriello, “Fully differential Higgs boson production and the di-photon signal through next-to-next-to-leading order”, Nucl. Phys. B 724 (2005) 197, 10.1016/j.nuclphysb.2005.06.036.
- [109] C. Anastasiou, S. Bucherer, and Z. Kunszt, “HPro: A NLO Monte-Carlo for Higgs production via gluon fusion with finite heavy quark masses”, JHEP 10 (2009) 068, 10.1088/1126-6708/2009/10/068.
- [110] S. Gieseke et al., “Herwig++ 2.0 Release Note”, (2006). arXiv:hep-ph/0609306.
- [111] J. Alwall et al., “MadGraph/MadEvent v4: the new web generation”, JHEP 09 (2007) 028, 10.1088/1126-6708/2007/09/028, arXiv:0706.2334.
- [112] ATLAS and CMS Collaborations, LHC Higgs Combination Group, “Procedure for the LHC Higgs boson search combination in Summer 2011”, Technical Report ATL-PHYS-PUB 2011-11, CMS NOTE 2011/005, (2011).
- [113] T. Junk, “Confidence level computation for combining searches with small statistics”, Nucl. Instrum. Meth. A 434 (1999) 435, 10.1016/S0168-9002(99)00498-2.
- [114] A. L. Read, “Presentation of search results: the CLs technique”, J. Phys. G 28 (2002) 2693, 10.1088/0954-3899/28/10/313.
- [115] E. Gross and O. Vitells, “Trial factors for the look elsewhere effect in high energy physics”, Eur. Phys. J. C 70 (2010) 525, 10.1140/epjc/s10052-010-1470-8, arXiv:1005.1891.
- [116] G. Cowan et al., “Asymptotic formulae for likelihood-based tests of new physics”, Eur. Phys. J. C 71 (2011) 1, 10.1140/epjc/s10052-011-1554-0, arXiv:1007.1727.
- [117] L. Moneta et al., “The RooStats Project”, in 13 Int. Workshop on Advanced Computing and Analysis Techniques in Physics Research (ACAT2010). 2010. arXiv:1009.1003. PoS ACAT:057.
- [118] C. J. Seez et al., “Photon decay modes of the intermediate mass Higgs”, in Proceedings of the Large Hadron Collider Workshop, G. Jarlskog and D. Rein, eds., p. 474. Aachen, Germany, 1990. CERN 90-10-V-2/ECFA 90-133-V-2.
- [119] H.-J. Yang, B. P. Roe, and J. Zhu, “Studies of boosted decision trees for MiniBooNE particle identification”, Nucl. Instrum. Meth. A 555 (2005) 370, 10.1016/j.nima.2005.09.022.
- [120] H. Voss et al., “TMVA: Toolkit for Multivariate Data Analysis with ROOT”, in XI Int. Workshop on Advanced Computing and Analysis Techniques in Physics Research. 2007. arXiv:physics/0703039. PoS ACAT:040.
- [121] R. J. Barlow, “Event classification using weighting methods”, J. Comp. Phys. 72 (1987) 202, 10.1016/0021-9991(87)90078-7.
- [122] M. Della Negra et al., “Search for leptons at the LHC”, in Proceedings of the Large Hadron Collider Workshop, G. Jarlskog and D. Rein, eds., p. 509. Aachen, Germany, 1990. CERN 90-10-V-2/ECFA 90-133-V-2.
- [123] N. Cabibbo and A. Maksymowicz, “Angular Correlations in Decays and Determination of Low-Energy - Phase Shifts”, Phys. Rev. B 137 (1965) 438, 10.1103/PhysRev.137.B438. Also Erratum, 10.1103/PhysRev.168.1926.
- [124] Y. Gao et al., “Spin determination of single-produced resonances at hadron colliders”, Phys. Rev. D 81 (2010) 075022, 10.1103/PhysRevD.81.075022, arXiv:1001.3396.
- [125] A. De Rujula et al., “Higgs look-alikes at the LHC”, Phys. Rev. D 82 (2010) 013003, 10.1103/PhysRevD.82.013003, arXiv:1001.5300.
- [126] CMS Collaboration, “Search for a Higgs boson in the decay channel in pp collisions at = 7 TeV”, JHEP 04 (2012) 036, 10.1007/JHEP04(2012)036, arXiv:1202.1416.
- [127] S. Y. Choi et al., “Identifying the Higgs spin and parity in decays to Z pairs”, Phys. Lett. B 553 (2003) 61, 10.1016/S0370-2693(02)03191-X, arXiv:hep-ph/0210077.
- [128] CMS Collaboration, “Measurement of the inclusive W and Z production cross sections in pp collisions at with the CMS experiment”, JHEP 10 (2011) 132, 10.1007/JHEP10(2011)132.
- [129] V. D. Barger et al., “Intermediate mass Higgs boson at hadron supercolliders”, Phys. Rev. D 43 (1991) 779, 10.1103/PhysRevD.43.779.
- [130] M. Dittmar and H. K. Dreiner, “How to find a Higgs boson with a mass between 155 GeV and 180 GeV at the CERN LHC”, Phys. Rev. D 55 (1997) 167, 10.1103/PhysRevD.55.167, arXiv:hep-ph/9608317.
- [131] CMS Collaboration, “Performance of -lepton reconstruction and identification in CMS”, JINST 7 (2011) P01001, 10.1088/1748-0221/7/01/P01001.
- [132] CMS Collaboration, “Search for Neutral MSSM Higgs Bosons Decaying to Tau Pairs in Collisions at TeV”, Phys. Rev. Lett. 106 (2011) 231801, 10.1103/PhysRevLett.106.231801, arXiv:1104.1619.
- [133] A. Denner et al., “Electroweak corrections to Higgs-strahlung off W/Z bosons at the Tevatron and the LHC with HAWK”, JHEP 03 (2012) 075, 10.1007/JHEP03(2012)075, arXiv:1112.5142.
- [134] J. Gallicchio and M. D. Schwartz, “Seeing in Color: Jet Superstructure”, Phys. Rev. Lett. 105 (2010) 022001, 10.1103/PhysRevLett.105.022001, arXiv:1001.5027.
- [135] L. D. Landau, “On the angular momentum of a two-photon system”, Dokl. Akad. Nauk 60 (1948) 207.
- [136] C. N. Yang, “Selection Rules for the Dematerialization of a Particle into Two Photons”, Phys. Rev. 77 (1950) 242, 10.1103/PhysRev.77.242.