The Ninth Data Release of the Sloan Digital Sky Survey: First Spectroscopic Data from the SDSS-III Baryon Oscillation Spectroscopic Survey
Abstract
The Sloan Digital Sky Survey III (SDSS-III) presents the first spectroscopic data from the Baryon Oscillation Spectroscopic Survey (BOSS). This ninth data release (DR9) of the SDSS project includes 535,995 new galaxy spectra (median ), 102,100 new quasar spectra (median ), and 90,897 new stellar spectra, along with the data presented in previous data releases. These spectra were obtained with the new BOSS spectrograph and were taken between 2009 December and 2011 July. In addition, the stellar parameters pipeline, which determines radial velocities, surface temperatures, surface gravities, and metallicities of stars, has been updated and refined with improvements in temperature estimates for stars with K and in metallicity estimates for stars with . DR9 includes new stellar parameters for all stars presented in DR8, including stars from SDSS-I and II, as well as those observed as part of the SDSS-III Sloan Extension for Galactic Understanding and Exploration-2 (SEGUE-2).
The astrometry error introduced in the DR8 imaging catalogs has been corrected in the DR9 data products. The next data release for SDSS-III will be in Summer 2013, which will present the first data from the Apache Point Observatory Galactic Evolution Experiment (APOGEE) along with another year of data from BOSS, followed by the final SDSS-III data release in December 2014.
Subject headings:
Atlases—Catalogs—Surveys1. Introduction
The Sloan Digital Sky Survey III (SDSS-III; Eisenstein et al. 2011) is an extension of the SDSS-I and II projects (York et al., 2000). It uses the dedicated 2.5-meter wide-field Sloan Foundation Telescope (Gunn et al., 2006) at Apache Point Observatory (APO), and fiber-fed multi-object spectrographs to carry out four surveys to study dark energy through observations of distant galaxies and quasars (the Baryon Oscillation Sky Survey; BOSS), to understand the structure of the Milky Way Galaxy (the Sloan Extension for Galaxy Understanding and Exploration; SEGUE-2, and the APO Galactic Evolution Experiment; APOGEE), and to search for extrasolar planets (the Multi-object APO Radial Velocity Exoplanet Large-area Survey; MARVELS). SDSS-III commenced in Fall 2008, and will carry out observations for six years through Summer 2014. The first data release of this phase of SDSS (and the eighth release overall; DR8; Aihara et al. 2011a) was made public in Winter 2011. In addition to all the data from SDSS-I and II (Abazajian et al., 2009), DR8 included additional five-band imaging data over 2500 deg2 over the Southern Galactic Cap, as well as stellar spectra from SEGUE-2.
This paper presents the ninth data release (DR9) from SDSS, including all survey-quality data from BOSS gathered through 2011 July. BOSS (Dawson et al., 2012) uses new spectrographs (Smee et al., 2012) to obtain spectra of galaxies with and quasars with to measure the scale of the baryon oscillation peak in the correlation function of matter in order to probe the geometry and dynamics of the universe. DR9 includes the first year of BOSS data, and this paper describes the characteristics of these data (summarized in §2), with a particular emphasis on how it differs from the spectroscopy carried out in SDSS-I and SDSS-II (§3).
The erratum to the DR8 paper (Aihara et al., 2011b) describes a systematic error in the astrometry in the imaging catalogs in DR8. This has now been fixed, as we describe in §4.
The SEGUE Stellar Parameters Pipeline (SSPP) fits detailed models to the spectrum of each star, to determine surface temperatures, metallicities, and gravities. It has been continuously improved since its introduction in the sixth data release (DR6, Adelman-McCarthy et al. 2008; see also Lee et al. 2008a). In §5, we describe the improvements since DR8 that are incorporated into the DR9 outputs.
2. Scope of DR9
DR9 presents the release of the first 1.5 years of data from the SDSS-III BOSS spectroscopic survey. BOSS started commissioning in early Fall 2009, and began survey-quality observations on the night of 2009 December 5 (UTC-7; MJD 55171). All processed data from that date until the summer telescope shutdown989898The SDSS telescope pauses science operations during the month-long “monsoon” in July/August in the southwestern United States. This time is used for telescope maintenance and engineering work. in 2011 July are included in DR9. All raw data taken by the BOSS spectrograph from the start of commissioning (2009 September) through and including 2011 July 10 (MJD 55752) are also available as flat files as part of the DR9 release, although the commissioning data are of quite poor quality, and don’t always include data from both spectrographs. DR9 also includes the spectroscopic data from SDSS-I/II and SEGUE2; it is unchanged since DR8.
The details of the data included in DR9 are summarized in Table 1, and the footprints of the imaging and spectroscopic data are shown in Figure 1. The imaging data and imaging catalogs are the same as in DR8, with the key update of an improved astrometric solution to correct an error affecting objects at high declinations (Aihara et al., 2011b).
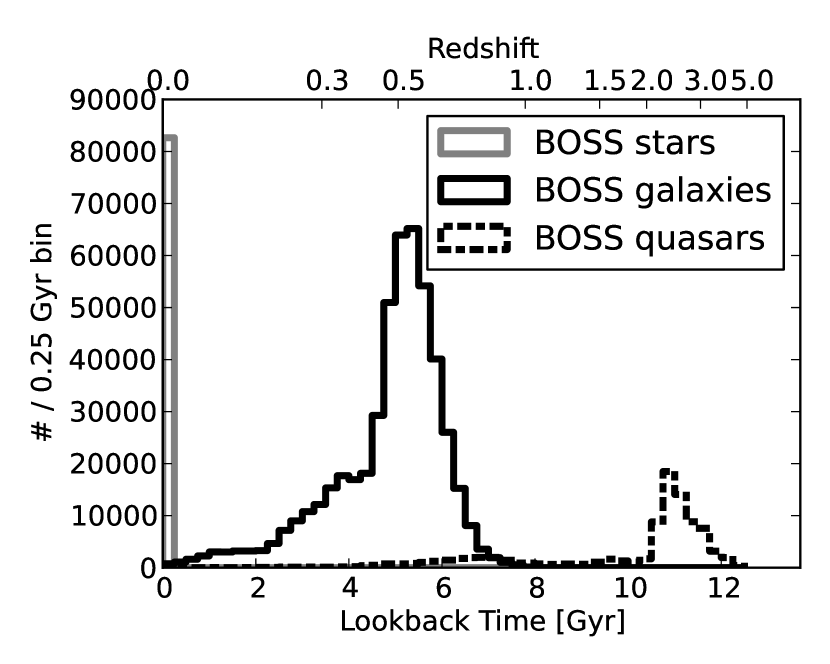
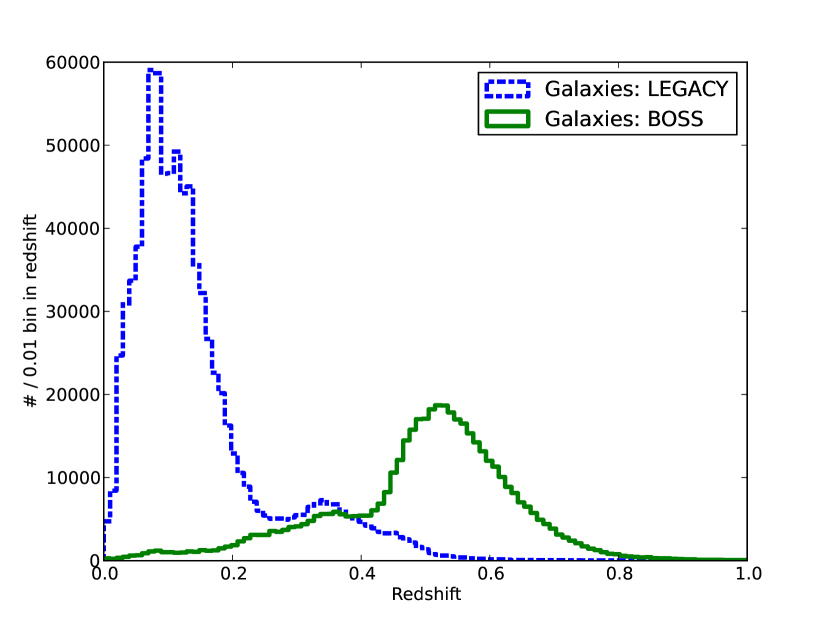
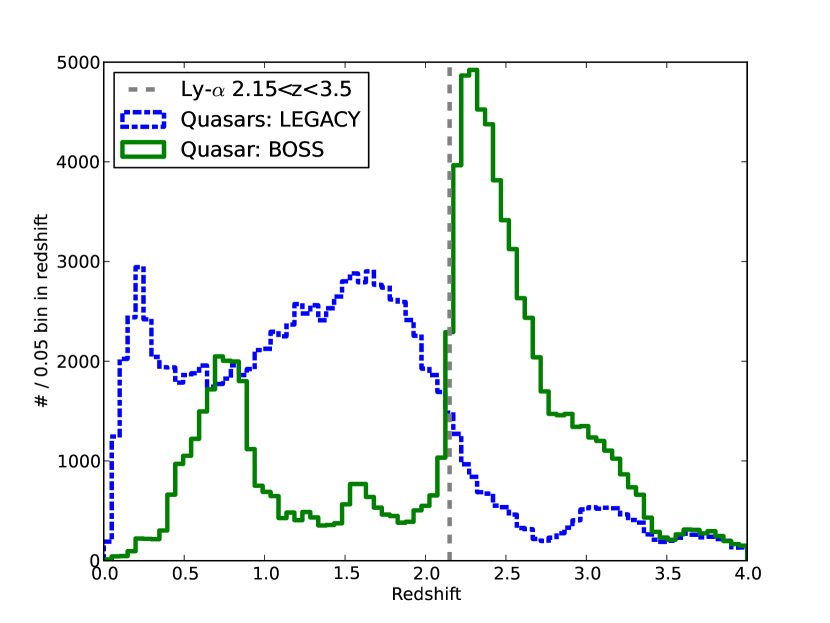
Fig. 2 presents the distribution with look-back time of spectroscopically confirmed stars, galaxies, and quasars from BOSS in the DR9 data set. Fig. 3 compares these distributions to those of all previous SDSS spectra of galaxies and quasars.
All data released with DR9 are publicly available at http://www.sdss3.org/dr9.

| ImagingaaThese numbers are unchanged since DR8. | ||
|---|---|---|
| Total | UniquebbRemoving all duplicates and overlaps. | |
| Area Imaged | 31,637 deg2 | 14,555 deg2 |
| Cataloged Objects | 1,231,051,050 | 469,053,874 |
| New BOSS SpectroscopyccSee Bolton et al. (2012) for full details. | ||
| Total | UniquebbRemoving all duplicates and overlaps. | |
| Spectroscopic footprint effective area | 3275 deg2 | |
| PlatesddTwelve plates of the 831 observed plates were re-plugged and re-observed for calibration purposes. Six of the 819 unique plates are different drillings of the same tiling objects. | 831 | 819 |
| Spectra observedeeThis excludes the small fraction of the observations through broken fibers or those that fell out of their holes. There were 831,000 spectra attempted. | 829,073 | 763,425 |
| Galaxies | 535,995 | 493,845 |
| CMASS galaxies | 336,695 | 309,307 |
| LOWZ galaxies | 110,427 | 102,890 |
| All Quasars | 102,100 | 93,003 |
| Main QuasarsffThis counts only quasars from the main survey (§3.1.2), and does not include those from ancillary programs (§3.1.3) or that were used for calibration purposes. | 85,977 | 79,570 |
| Main Quasars, ggQuasars with redshifts in the range provide the most signal in the BOSS spectra of the Ly- forest. | 59,783 | 55,047 |
| Ancillary program spectra | 32,381 | 28,968 |
| Stars | 90,897 | 82,645 |
| Standard stars | 16,905 | 14,915 |
| Sky spectra | 78,573 | 75,850 |
| All Spectroscopy from SDSS-I/II/III | ||
| Total number of spectra | 2,674,200 | |
| Total number of useful spectrahhSpectra on good or marginal plates. “Spectrum” refers to a combined set of sub-exposures that define a completed plate. Duplicates are from plates that were observed more than once, or are objects that were observed on overlapping plates. | 2,598,033 | |
| Galaxies | 1,457,002 | |
| Quasars | 228,468 | |
| Stars | 668,054 | |
| Sky | 181,619 | |
| UnclassifiediiNon-sky spectra for which the automated redshift/classification pipeline (Bolton et al., 2012) gave unreliable results, as indicated by the ZWARNING flag. | 62,890 | |
3. The Baryon Oscillation Spectroscopic Survey
When the Universe was radiation-dominated, sound waves propagated through the radiation-matter fluid at a significant fraction of the speed of light. They slowed dramatically after matter-radiation equality, and were frozen in after recombination. Sound waves propagating from overdensities thus propagated a given distance, roughly 150 comoving Mpc (given standard cosmological parameters) from the initial perturbations; the resulting overdensity gives an excess in the clustering of matter at this scale. This is the origin of the oscillations seen in the power spectrum of the Cosmic Microwave Background (e.g., Komatsu et al. 2011), and was first conclusively seen in the clustering of galaxies from the Two Degree Field Galaxy Redshift Survey (Cole et al., 2005) and the SDSS (Eisenstein et al., 2005). This feature in the galaxy or matter correlation function or power spectrum is a standard ruler; measuring it as a function of redshift gives a powerful constraint on cosmological models (e.g., Weinberg et al., 2012).
The initial SDSS detection of the baryon oscillation feature (Eisenstein et al. 2005; see also Tegmark et al. 2006; Percival et al. 2010; Padmanabhan et al. 2012a) was based upon a galaxy sample at . BOSS aims to measure spectra (and thus redshifts) for a sample of 1.5 million galaxies extending to over 10,000 deg2, to use the baryon oscillation feature to make a 1% measurement of the angular diameter distance at and a separate uncorrelated 1% measurement at . In addition, 150,000 quasars with will be observed to measure the clustering of the Lyman- forest, and thus to determine the baryon oscillation scale at , an epoch before dark energy dominated the expansion of the universe.
The samples of galaxies and quasars needed to carry out this program are significantly fainter than those targeted in SDSS-I and SDSS-II (Eisenstein et al., 2001; Strauss et al., 2002; Richards et al., 2002), and have a higher density on the sky. The SDSS spectrographs and supporting infrastructure were extensively rebuilt to increase throughput and observing efficiency, as described in detail in Smee et al. (2012). In particular:
-
•
The optical fibers, which bring light from the focal plane to the spectrographs, subtended ″ on the sky in SDSS-I/II. Given the smaller angular size of the higher redshift BOSS galaxy targets, the fibers now subtend ″.
-
•
The number of fibers was increased from 640 to 1000.
-
•
New high-throughput volume phase holographic (VPH) gratings were installed.
-
•
The optics have been replaced, with improved throughput.
-
•
The CCDs were replaced, with improved response at both the blue and red limits.
The resulting spectra are broadly similar to those of SDSS-I/II, but have significantly higher signal-to-noise ratio (S/N) at a given fiber magnitude. While the resolution as a function of wavelength is similar, the spectral coverage is significantly broader, from 3600Å to 10,400Å. Finally, the target selection algorithms for galaxies (Padmanabhan et al., 2012b) and quasars (Ross et al., 2012) are significantly different from the equivalent for SDSS-I/II, given the rather different scientific goals.
The design of the BOSS survey itself is described in detail in Dawson et al. (2012). First baryon oscillation results from the DR9 galaxy sample may be found in Anderson et al. (2012) and references therein, and the first analysis of the clustering of the Lyman forest from BOSS quasar spectra is found in Slosar et al. (2011).
3.1. BOSS Main Survey Targets
There are four broad categories of targets on the BOSS plates: galaxies (§3.1.1; see Padmanabhan et al. 2012b), quasars (§3.1.2; see Ross et al. 2012), ancillary targets (§3.1.3), and standards and calibrations (Dawson et al., 2012).
3.1.1 Galaxies
The SDSS-I/II Legacy survey targeted galaxies in two categories: a magnitude-limited sample of galaxies in the band (Strauss et al., 2002), with a median redshift of , and a magnitude- and color-limited sample of fainter galaxies designed to select the most luminous red galaxies (LRG) at each redshift (Eisenstein et al., 2001); the LRG sample is approximately volume-limited to , and includes galaxies to . BOSS aims to measure large-scale clustering of galaxies at higher redshifts and at lower luminosities (to sample the density field at higher space density), and thus targets significantly fainter galaxies.
The galaxy target selection algorithm is described in detail in Padmanabhan et al. (2012b). In brief, it uses the DR8 imaging catalog to select two categories of objects using colors that track the locus of a passively evolving galaxy population with redshift (Maraston et al., 2009). The “LOWZ” subsample, containing about a quarter of all galaxies in BOSS, targets galaxies with with colors similar to LRGs, but with lower luminosity; the space density of LOWZ galaxies is about 2.5 times that of the SDSS-I/II LRG sample. The constant-mass or “CMASS” sample, containing three times more galaxies than LOWZ, is designed to select galaxies with . The rest-frame color distribution of this sample is significantly broader than that of the LRG sample, thus CMASS contains a nearly complete sample of massive galaxies above the magnitude limit of the survey. The LOWZ and CMASS samples together give a very roughly volume-limited sample, with space density of order to , and a tail to . In practice, it is somewhat difficult to select objects at as the 4000Å break falls between the and bands. The space density of the sample at that redshift is consequently 25% lower.
The CMASS sample includes a “SPARSE” extension in color space, to better understand incompleteness in the CMASS sample and to sample a population of fainter, bluer, and less massive galaxies. The galaxies were selected by extending the CMASS color-magnitude cut, and are sub-sampled at 5 galaxies deg-2.
As described in Padmanabhan et al. (2012b), there was an error in the implementation of the LOWZ sample for the early BOSS data (plate numbers 3987 and less); these data should be excluded from any analysis which requires a uniform LOWZ sample.
The BOSS galaxy sample extends about half a magnitude fainter than the SDSS-I/II LRG sample, and thus the S/N of the spectra tend to be lower, despite the higher throughput of the spectrographs. Nevertheless, in DR9 the vast majority of the galaxy targets are confirmed galaxies with confidently measured redshifts: 95.4% of all CMASS targets and 99.2% of all LOWZ targets. The 4.6% of unsuccessful galaxy redshifts for CMASS targets are mostly erroneously targeted red stars. As described in §3.3, the signal-to-noise ratio of the spectra is sufficient that higher-order quantities (stellar masses, velocity dispersions, emission-line properties, and so on) can be measured for most objects.
3.1.2 Quasars
The BOSS Quasar Survey uses imaging data from DR8 (Aihara et al., 2011a) to select its main spectroscopic targets. The aim is to observe quasars, as for these objects the Lyman- forest enters into the spectral coverage of the BOSS spectrographs. This is a challenging task, given the fact that the quasar locus in SDSS color space crosses that of F stars at (Fan, 1999). Ross et al. (2012) give full details on the BOSS quasar target selection methods that were used. In brief, we implemented and tested a range of methods over the commissioning period and the first year of BOSS spectroscopy (Year One, ending in 2010 July). Quasar targets were selected based on their optical fluxes and colors, and properties in other bands, including radio and near infrared. Unlike the SDSS-I/II Legacy quasar sample (Richards et al., 2002), the BOSS quasar selection actively selects against quasars with redshifts less than (in particular, most ultraviolet excess sources).
As the main science goal of the BOSS quasar sample is to probe the foreground hydrogen in the inter-galactic medium (IGM), priority was placed on maximizing the surface density of quasars (McDonald & Eisenstein, 2007; McQuinn & White, 2011), rather than engineering the most homogeneous data set possible. Thus the full target selection is a complicated heterogeneous combination of several methods, using ancillary data sets where available (Ross et al., 2012).
However, to allow statistical studies of quasar physical properties, demographics, and clustering, we defined a subsample (called “CORE” in Ross et al., 2012) that will be uniformly selected throughout BOSS. It uses a single selection algorithm, the extreme deconvolution method (hereafter XDQSO) of Bovy et al. (2011), using single-epoch SDSS photometry. However, we settled on XDQSO only at the end of Year One, and thus the CORE sample in the first year of data is not homogeneous. CORE targets were allocated at 20 deg-2, of which – deg-2 are confirmed spectroscopically to be quasars at . An additional 20 targets deg-2 (the “BONUS” sample) were selected using a heterogeneous set of selection criteria to maximize the surface density of high- quasars; of these, deg-2 are found to be quasars at . In Year One, especially in the commissioning period, we increased the number density of targets as we fine-tuned the selection algorithms.
Finally, given the improved throughput of the BOSS spectrographs and extended blue coverage, we re-observed all previously known quasars (most of which were discovered by SDSS-I/II; see Schneider et al. 2010) to obtain higher S/N in the Lyman- forest.
Approximately half of the quasar targets observed in DR9 were confirmed to be quasars, with the remainder consisting largely of F stars.
All quasar targets, plus all objects spectroscopically identified as quasars via our automated pipeline, have been visually inspected, and both automated pipeline results and these visual redshifts and classifications are provided in DR9. The resulting quasar catalog, together with measurements of broad absorption lines and damped Lyman- systems, will be made public in Pâris et al. (2012). A subsample of BOSS quasar spectra suitable for Lyman- forest analysis () will be described in Lee et al. (2012), which will provide additional products such as quasar continua, improved noise estimates, and pixel masks.
3.1.3 BOSS Ancillary Targets
In addition to the main galaxy and quasar programs, roughly 3.5% of the BOSS fibers in DR9 were devoted to a series of 25 small ancillary projects, each consisting of a few hundred to a few thousand targets. These programs, described in detail in Appendix A of Dawson et al. (2012), were selected via internal collaboration review, and cover scientific goals ranging from studies of nearby stars to quasars. The ancillary programs allow fibers to be used that would otherwise go unplugged in regions where the principal targets are more sparse than average. These spectra are processed with the same pipeline (Schlegel et al., 2012; Bolton et al., 2012) as all the other spectra.
A particular focus of many of these ancillary programs is the roughly 220 deg2 in the Southern Galactic Cap covered by “Stripe 82” (, ) that was imaged repeatedly in SDSS (Adelman-McCarthy et al., 2008). Using stacked photometry and variability information, for example, the quasar sample on Stripe 82 is particularly complete (e.g., Palanque-Delabrouille et al. 2011).
3.2. Differences between SDSS-I/II Spectra and SDSS-III BOSS Spectra
Readers who are familiar with the SDSS-I/II spectra will be able to use the BOSS spectra quickly, since the twin BOSS spectrographs are upgraded versions of the original SDSS-I/II spectrographs, as described above. In addition, the pipelines used to process the BOSS spectra (Schlegel et al., 2012; Bolton et al., 2012) are improved versions of those used in SDSS-I/II. In this section, we briefly outline the main differences between the BOSS spectra and the SDSS-I/II spectra. For more detailed information on the BOSS spectrographs, the reader is referred to Smee et al. (2012), while the BOSS operations are described in Dawson et al. (2012).
The BOSS spectrographs include 1000 fibers in each plate, in comparison with 640 fibers per plate in SDSS-I/II. In addition, the spectral coverage has been increased from – Å to – Å, with the dichroic split between the blue and red sides occurring at roughly Å (as it was in SDSS-I/II). The expanded blue coverage means that the Cd I arc line at Å is now included in the wavelength calibration, enabling a more accurate wavelength solution on the blue end (see the discussion in Adelman-McCarthy et al. 2008). The median resolution of the BOSS spectra remains as in SDSS-I/II, with a similar wavelength dependence (Smee et al., 2012); the resolution ranges from at Å, to at Å.
In addition, the diameter of the spectroscopic fibers in BOSS has been decreased in size from to . While this improves the S/N for point-like objects and the smaller galaxies targeted by BOSS due to decreased sky background relative to the source signal, the smaller fiber size affects the spectrophotometry for galaxies, and is more subject to differential chromatic aberration and seeing effects. As in SDSS-I/II, the spectrophotometry is tied to the PSF photometry of stars on each plate. In SDSS-I/II, the RMS scatter between the PSF photometry and synthesized photometry from the calibrated spectra was of order 4% (Adelman-McCarthy et al., 2008); with BOSS, it is closer to 6% (Dawson et al. 2012, but see the discussion below about quasar spectrophotometry). The photometric catalog released in DR8 and DR9 (§6) provides the 2″ photometry (termed FIBER2MAG) for each object to complement 3″ photometry (FIBERMAG).
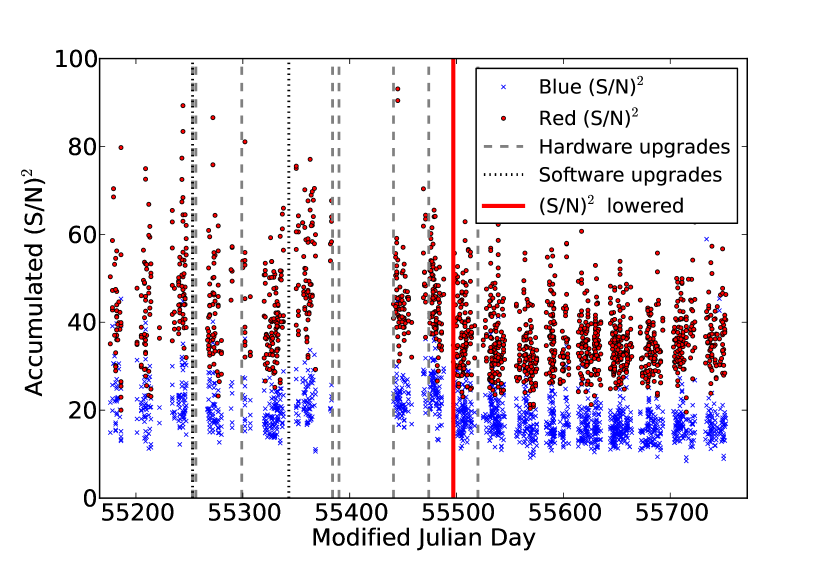
The more sensitive CCDs, improved throughput of the VPH gratings, and improved optics have further improved the S/N in the BOSS spectra, enabling the targeting of fainter objects. For each plate, the median log S/N per pixel within wavelength regions corresponding to the SDSS imaging bands and (Fukugita et al., 1996) is tabulated against the corresponding ″ fiber magnitude. A line of slope 0.3 is fit to this line, and the intercept at the fiducial magnitudes of and is noted. This quantity is compared for SDSS DR7 and BOSS plates in Figure 4. The median exposure times of BOSS DR9 plates (1.5 hours) are only 70% longer than those in SDSS-I/II (0.89 hours), but due to the instrument upgrades the resulting (S/N)2 values of the BOSS spectra are more than twice those in SDSS-I/II at the same magnitude.

Because one of the stated goals of the BOSS survey is to study the Lyman- forest absorption in quasars, efforts have been made to improve the S/N at the blue end of the BOSS objects targeted as quasars. In particular, the focal plane of the SDSS telescope was designed to be in focus for BOSS at Å, whereas the Lyman- forest lies at Å, a wavelength that will be out of focus and offset radially due to differential chromatic aberration. To correct for this, we have offset the quasar target fibers in both the radial and axial directions to maximize the throughput at Å. The radial offset was implemented by drilling the quasar plug holes at slightly different positions (depending on the assumed hour angle at which the plate will be observed), whilst in the axial direction we have introduced thin washers to the plug holes on the fiber side of the plates, with thicknesses of 175 and 300 micron in the regions spanning 1.02–1.34 deg and 1.34–1.50 deg radially from the plate center, respectively (Dawson et al., 2012). These offsets are tabulated in the ZOFFSET and LAMBDA_EFF flags in the survey data (§6).
The current pipeline flux calibration (Schlegel et al., 2012) does not take these fiber offsets into account, therefore the spectrophotometry of the objects in the quasar targets is biased toward bluer colors, with excess flux relative to the SDSS imaging data at Å and a flux decrement at longer wavelengths (Pâris et al., 2012). We have measured the mean difference between spectrophotometric and imaging magnitudes for those objects targeted as quasars but that turned out to be stars111We exclude quasars from this comparison to avoid introducing intrinsic quasar variability between the time the photometry and spectroscopy were carried out into the comparison between the two different magnitudes. – the values are () mag in (, , ). Objects observed at higher airmass show larger offsets.
Quasars targeted solely as part of ancillary programs were not subject to these offsets, and thus their spectrophotometry should show no significant bias. Of course, these objects will have reduced S/N in the blue. However, some quasars targeted in ancillary programs were also targets in the main CORE or BONUS samples; these ancillary quasars do have the washer offsets applied (at least after MJD 55441, when the washers started to be applied; see §3.4 below).
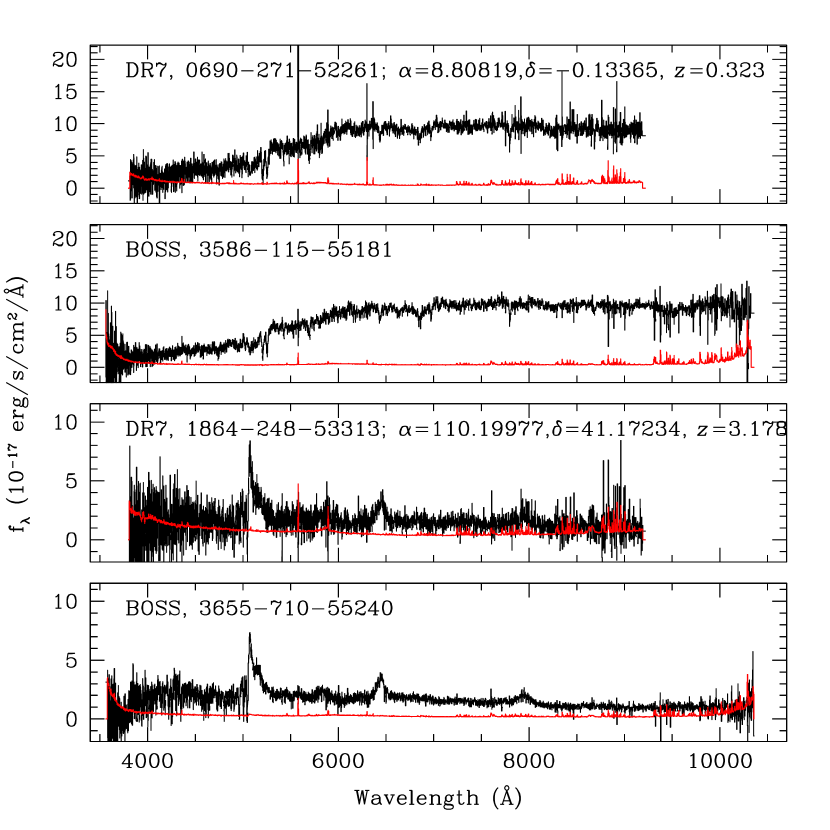
DR9 includes new BOSS observations of objects observed with the previous spectrograph in SDSS-I/II. This includes 4,074 galaxies; 16,967 quasars (mostly specifically re-targeted to obtain better Ly forest measurements); and 7,875 stars. The repeated galaxy and star observations confirm that the redshift scales are consistent within a few . However, due to an updated set of quasar templates in the BOSS pipeline (Bolton et al., 2012), quasar redshifts are 175 higher in the median in BOSS than in SDSS-I/II. The limitations of the quasar redshifts in previous data releases were highlighted by Hewett & Wild (2010) in a reanalysis of DR6 quasar redshifts. While the new templates are designed to more fully represent the range of quasars found, obtaining accurate redshifts remains challenging because of the uncertainty in the relative velocity offsets of different emission lines from the rest frame of the quasar host galaxy system. See Pâris et al. (2012) and Bolton et al. (2012) for a discussion of the details and caveats of quasar redshift determination in DR9.
Figure 5 shows spectra of a galaxy and a quasar, observed both with SDSS-I/II and BOSS. This figure illustrates the greater wavelength coverage and the significantly higher S/N of the BOSS spectra for observations of the same object.
3.3. Quantities Derived from Galaxy Spectra
The spectroscopic pipeline (Bolton et al., 2012) initially classifies all spectra without regard to its imaging data. That is, each object is tested against galaxy, quasar, and stellar templates, regardless of how it was targeted. However, in BOSS, we found that galaxy targets were often incorrectly matched to quasar templates with unphysical fit parameters, e.g., negative coefficients causing a quasar template emission feature to fit a galaxy absorption feature. Thus, for galaxy targets in BOSS, the best classification and redshift are selected only from the fits to the galaxy and star templates. The resulting quantities are listed with the suffix _NOQSO in the DR9 database. Results without this template restriction are also made available.
In addition, we have computed a variety of derived quantities from the galaxy spectra following the spectroscopic pipeline, applying stellar population models to derive stellar masses, emission-line fluxes and equivalent widths, stellar and gas kinematics and velocity dispersions (Chen et al., 2012; Maraston et al., 2012; Thomas et al., 2012).
Each of the stellar population models is applied to all objects that the spectroscopic pipeline calls a galaxy with a reliable and positive definite redshift (i.e., CLASS_NOQSO=“GALAXY” and ZWARNING_NOQSO=0 and Z_NOQSO Z_ERR_NOQSO 0; see Bolton et al. 2012).
-
•
Portsmouth spectro-photometric stellar masses (Maraston et al., 2012) are calculated using the BOSS spectroscopic redshift, Z_NOQSO, and photometry by means of broad-band spectral energy distribution (SED) fitting of population models. Separate calculations are carried out with a passive template and a star-forming template, and in each case for both Salpeter (1955) and Kroupa (2001) initial mass functions, and for stellar evolution with and without stellar mass loss. Templates are based on Maraston (2005) and Maraston et al. (2009) for the star-forming and passive stellar population models, respectively. In order not to underestimate stellar mass, internal galaxy reddening is not included in the Portsmouth SED fitting procedures used in DR9. Reddening for individual galaxies may, however, be computed via the Portsmouth emission-line flux calculations (see below).
-
•
Portsmouth emission-line fluxes and equivalent widths, and stellar and gas kinematics (Thomas et al., 2012), are based on the stellar population synthesis models of Maraston & Strömbäck (2011) applied to BOSS spectra using an adaptation of the publicly available Gas AND Absorption Line Fitting (GANDALF; Sarzi et al., 2006) and penalized PiXel Fitting (pPXF; Cappellari & Emsellem, 2004).
-
•
Wisconsin stellar masses and velocity dispersions are derived from the optical rest-frame spectral region (3700–5500Å) using a principal component analysis (PCA) method (Chen et al., 2012). The estimation is based on a library of model spectra generated using the single stellar population models of Bruzual & Charlot (2003) assuming a Kroupa (2001) initial mass function, and with a broad range of star-formation histories, metallicities, dust extinctions, and stellar velocity dispersions.
The different stellar mass estimates for BOSS galaxies encompass calculations based on different stellar population models (Bruzual & Charlot 2003 for Wisconsin, and Maraston 2005 for Portsmouth), different assumptions regarding galaxy star formation histories, and multiple choices for the initial mass function and stellar mass-loss rates, and each method focuses on a different aspect of the available imaging and spectroscopic data. The Portsmouth SED fitting focuses on broad-band colors and BOSS redshifts, the Wisconsin PCA analysis on considering the full spectrum, while the Portsmouth emission-line fitting focuses on specific regions of the spectrum that contain specific information on gas and stellar kinematics. The uncertainty in the Wisconsin spectral PCA results generally decreases with increasing spectrum S/N, whereas the Portsmouth SED-fit results provide a wider choice of stellar population models relevant to BOSS galaxies. The array of choices allows consistent comparisons with the literature and future surveys. A detailed comparison between the Portsmouth SED and the Wisconsin spectral PCA calculations is discussed in Maraston et al. (2012, Appendix A).
The Galspec product (Kauffmann et al., 2003; Brinchmann et al., 2004; Tremonti et al., 2004) provided by the Max Planck Institute for Astrophysics and the Johns Hopkins University (MPA-JHU) introduced in DR8 is maintained for SDSS-I/II galaxies, but is not available for SDSS-III BOSS spectra. The Portsmouth and Wisconsin stellar population model algorithms are new to DR9 and currently available only for SDSS-III BOSS spectra. However, Chen et al. (2012) and Thomas et al. (2012) each found that a comparison of their respective techniques (Wisconsin PCA, and Portsmouth emission-line) to the SDSS-I/II MPA-JHU demonstrated consistent results with the values for a set of SDSS galaxies from DR7.
3.4. Changes in BOSS Spectrographs and Survey Strategy
| Date | MJDaaAll data taken on and after the given MJD include the respective change. | Change |
|---|---|---|
| 2009 Aug 28 | 55071 | Earliest BOSS commissioning data available in SAS |
| 2009 Dec 06 | 55171 | Beginning of survey-quality data |
| 2010 Feb 26 | 55253 | Installed mask in the central optics to eliminate a secondary light path that was directly imaged onto the CCD |
| 2010 Feb 26 | 55253 | Guider improvements |
| 2010 Feb 26 | 55253 | CCD dewars adjusted for better focus |
| 2010 Mar 01 | 55256 | Installed a collimator mask to remove light being reflected off of the slithead and re-imaged onto the CCD. |
| 2010 Apr 12 | 55299 | R2 CCD replaced |
| 2010 May 28 | 55343 | Field acquisition and calibration efficiency improvements |
| 2010 Jul 7 | 55384 | CCD positions adjusted inside dewars for better focus |
| 2010 Jul 13 | 55390 | R1,R2 CCD change from 1- to 2-phase slightly changed effective pixel size |
| 2010 Sep 02 | 55441 | Washers for quasar targets, some plates |
| 2010 Oct 05 | 55474 | Washers for quasar targets, all plates |
| 2010 Oct 28 | 55497 | Changed (S/N)2 thresholds and target selection |
| 2010 Nov 20 | 55520 | B1 triplet lenses replaced |
While commissioning of the BOSS spectrographs was completed in early December 2009, we continued to make a series of improvements and changes to the spectrographs, the observing system, and the exposure depths. In this section, we outline those changes that affect the DR9 data. The effects on the quality of the resulting spectra due to these changes are subtle, but the reader interested in detailed comparisons of the BOSS data as a function of time should be aware of them.
BOSS observes spectra with 15 minute exposures which are repeated until the summed signal-to-noise squared per pixel, (S/N)2, reaches a given threshold in each of the four spectrograph cameras (B1, B2, R1, R2 for the blue and red arms of spectrographs 1 and 2). A quick-look pipeline runs after each exposure to estimate the accumulated (S/N)2 in near real-time and a plate is exposed again until given (S/N)2 thresholds are reached.
For the first year of the survey BOSS conservatively observed a little deeper than believed necessary and planned on re-evaluating and updating these (S/N)2 thresholds for future years. After the first year of observations, it became clear that that we were not covering the sky sufficiently quickly to reach our goal of 10,000 deg2 by the end of the survey in Summer 2014. BOSS thus conducted a review of the fiducial (S/N)2 thresholds needed to optimize both survey speed and spectroscopic completeness. The decision was made to lower the (S/N)2 thresholds and impose a more restrictive cut on the galaxy surface brightness faint limit. On MJD 55497 the (S/N)2 thresholds were reduced from to for the blue spectrograph cameras (for ) and from to for the red spectrograph cameras (for ).222These values of (S/N)2 are as measured by the quick reductions done of each exposure immediately after it is taken. The full reductions have a moderately higher (S/N)2. The full pipeline also uses a different set of fiducial magnitudes for tracking (S/N)2: mag, mag, and mag. It is these full pipeline (S/N)2 values that are shown in Figure 4. At the same time, the CMASS target selection limiting magnitude was changed from IFIBER2MAG to . There is a very slight change in spectroscopic survey completeness after this date. Further details are provided in Dawson et al. (2012), §5.
Improvements to the guider software were made on MJD 55253, leading to better guiding and thus improved throughput. Improvements to the field acquisition software and the efficiency of calibration observations were made on MJD 55343 and resulted in reduced observing overheads and a larger fraction of open-shutter time.
Table 2 summarizes a series of hardware changes that further improved throughput and image quality and reduced scattered light. This allowed us to reach the fiducial (S/N)2 in the spectra in fewer exposures. Air bubbles had developed in the oil interfaces between the B1 triplet lenses, reducing throughput and causing scattered light. These were replaced on MJD 55520. The triplet lenses for the other spectrograph arms have also been replaced, but after the 2011 July date that marks the end of DR9. The R2 CCD was replaced on MJD 55298 due to a hardware failure. The R1 and R2 CCD clocking was changed from 1- to 2-phase for charge collection on MJD 55390. The use of washers to optimize (S/N)2 for quasar targets began on MJD 55441 and was fully implemented for all CORE and BONUS quasar targets starting MJD 55474. Finally, we did two rounds of adjusting the focus of the CCDs in their dewars, further improving the throughput.
4. Fixed and Improved Astrometry

The DR8 imaging suffered from several errors in the astrometric calibration, as described in an erratum published shortly after the DR8 release (Aihara et al., 2011b).333These errors do not appear in the DR7 and earlier releases. These errors have been corrected in DR9, and the resulting astrometry and proper motions are improved relative to both DR7 and DR8.444While the FITS images distributed as part of the Science Archive Server, http://data.sdss3.org/sas/dr9/, are identical to DR8 on a pixel-by-pixel basis, the FITS image metadata (in particular, the World Coordinate System headers) have been changed to match the revised astrometry in DR9.
The issues with the DR8 astrometry were, in brief:
- •
-
•
Color terms were not used in calculating CCD position to sky position, introducing systematic errors of 10–20 mas.
-
•
UCAC2 proper motions were not applied correctly, introducing further errors of order 5–10 mas.
-
•
Stellar positions were always measured in the -band photometry, even if the -band was saturated or had a lower S/N detection than other filters. For faint objects this increases the statistical uncertainty for the measurement, but for -band saturated objects the difference can be as much as 100 mas between using -band positions and those in non-saturated filters.
All of these issues have been corrected for DR9. The discovery of the mistakes in DR8 prompted the development of a new set of astrometric quality-assurance metrics that are fully described in the SDSS-III DR9 datamodel.555http://data.sdss3.org/datamodel
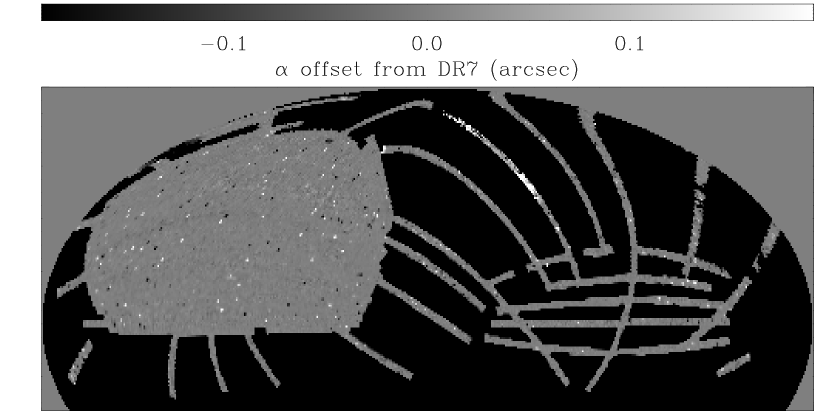
With these problems corrected, the DR9 astrometry fixes errors in both DR8 and DR7. In particular, DR7 contained very large errors in a handful of runs (3358, 4829, 5960, 6074, and 6162) that are corrected in DR9 (the most prominent of these is the black and white arc in the upper central region of the top panels of Figure 7).
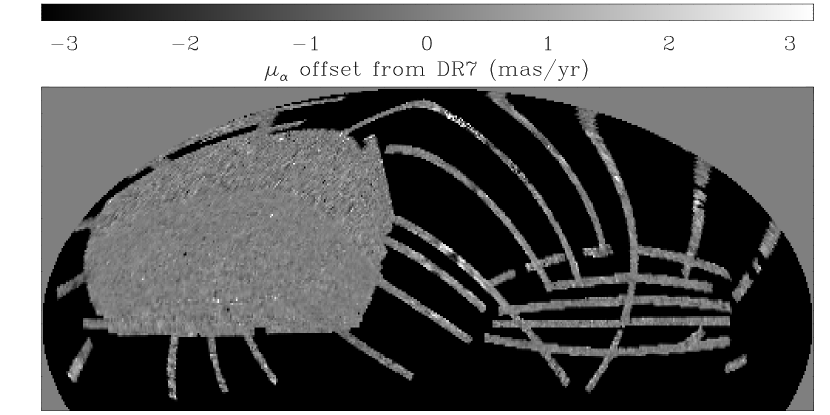
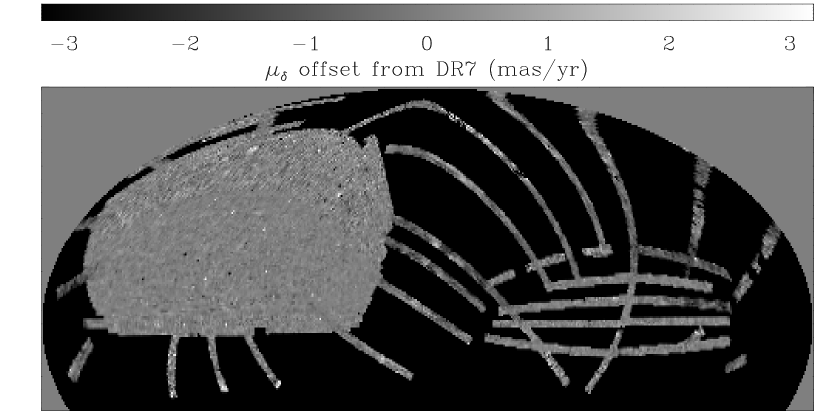
Proper motions in DR9 are similarly improved relative to DR8 and DR7. As Figure 7 shows, they are mostly unchanged in the mean at high Galactic latitudes. However, the corrected color terms in the astrometry have fixed a small fraction of objects with outlying proper motions in the DR9 relative to DR8 (this error did not affect DR7 or earlier). Furthermore, at low Galactic latitudes DR7 had some large offsets caused by star-galaxy separation errors. Proper motions are measured with respect to a reference frame of stationary galaxies, so stellar contamination in the galaxy sample can systematically affect the proper motion estimates. In DR7, errors in star-galaxy separation (in particular in photometric rerun 648) caused the galaxy sample to have significant stellar contamination, leading to systematic errors in the proper motions. DR9 fixes this problem.
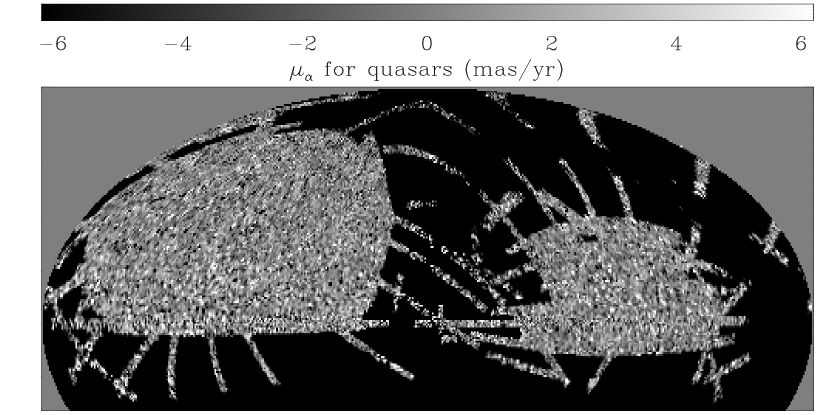
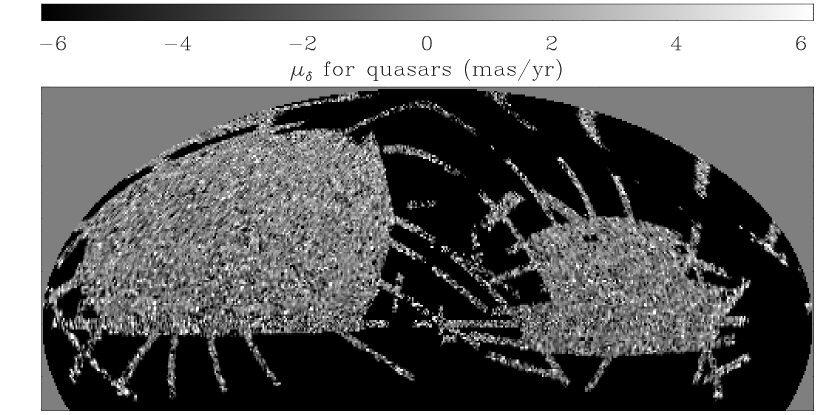
The proper motions can be independently tested by looking at the proper motions of photometrically identified low redshift quasars, which are easy to select and should have zero proper motions. Figure 8 shows the proper motions of the low redshift quasars as selected by Bovy et al. (2011). These show very little systematic offset from zero, except for a small shift in at low Declination. This offset is further described by Bond et al. (2010) in the context of the DR7 proper motions, and could be due to small differential refraction correction issues in USNO-B for these very blue objects (and is therefore likely not relevant to the proper motions of typical stars).
5. Improvements in the SEGUE Stellar Parameter Pipeline for DR9
The SEGUE Stellar Parameter Pipeline (SSPP; Lee et al., 2008a, b; Allende Prieto et al., 2008; Smolinski et al., 2011) utilizes multiple approaches to estimate effective temperature (), surface gravity (log ), and metallicity ([Fe/H]) from stellar spectra. Each method is optimized for a certain range of stellar color and S/N, and is measured over a range of wavelengths determined to deliver the best estimate of each parameter. The SSPP is designed to obtain reliable results for stars targeted as part of the SDSS-II SEGUE and SDSS-III SEGUE-2 surveys (Rockosi et al., 2012). With each SDSS data release the SSPP has been refined and modified to provide more accurate estimates of the stellar atmospheric parameters. Here we briefly highlight major changes and improvements made since the DR8 public release that are used for the DR9 data.
A sample of 126 high-resolution spectra of SDSS/SEGUE stars, taken with Keck, Subaru, the Hobby-Eberly Telescope and the Very Large Telescope, have been analyzed in a homogeneous fashion, and a new set of stellar parameters were obtained from this analysis (Allende Prieto et al., 2008; Smolinski et al., 2011). The sample covers K, , and [Fe/H] . However, this data set contains no metal-poor ([Fe/H] ) dwarfs or metal-rich ([Fe/H] ) giants. Additional information on this high-resolution sample can be found in Allende Prieto et al. (2008) and Smolinski et al. (2011).
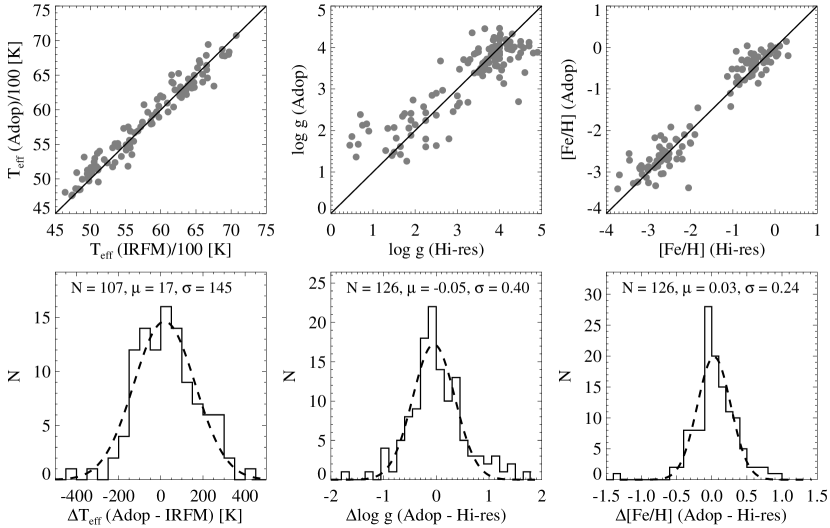
The individual methods in the SSPP, in particular estimates of surface gravity and metallicity, have been thoroughly re-calibrated based on these new data. The SSPP also adopts a much-improved color ()-temperature relation, the InfraRed Flux Method (IRFM) as described by Casagrande et al. (2010). Each SSPP temperature estimate was re-scaled to match the IRFM temperature estimate. This technique particularly improves the temperature estimates for cool stars ( K).
Figure 9 shows the results of the comparisons of the SSPP parameters with the IRFM for temperature, and the high-resolution analysis for gravity and metallicity. Implementation of a grid of synthetic spectra with microturbulences that vary appropriately with surface gravity also yields improved estimates of metallicity for metal-rich stars ([Fe/H] ).
A parameter comparison from a sample of about 9,000 multiply-observed stellar spectra in SEGUE provides the basis for an estimate of the internal uncertainties of the SSPP – 50 K for , 0.12 dex for log , and 0.10 dex for [Fe/H] for a typical G-type dwarf or redder stars in the color range of with S/N per pixel = 30. These errors increase to 80 K, 0.30 dex, and 0.25 dex for , log , and [Fe/H], respectively, for stars with , [Fe/H] , and S/N .
A comparison with the DR8 parameters for stars from SEGUE-1 indicates that the DR9 average is higher by 60 K, the DR9 log is lower by 0.2 dex, and the metallicity does not change significantly, although these values vary with spectral type and spectral S/N.
These new SSPP results are made available for all stars in SDSS-I/II, including those of SEGUE-1 (Yanny et al., 2009), and the SEGUE-2 stars in SDSS-III. SSPP measurements are not currently available for the stars observed as part of BOSS, although we plan to include that in future data releases.
6. Data Distribution
All Data Release 9 data are available through data access tools linked from the DR9 web site.666http://www.sdss3.org/dr9 The data are stored both as flat files in the Science Archive Server (SAS),777The Science Archive Server (SAS) is the SDSS-III equivalent of the SDSS-I/II Data Archive Server (DAS). and as a searchable database in the Catalog Archive Server (CAS). A number of different interfaces are available, each designed to accomplish a specific task: (1) Color images of regions of the sky in JPEG format (based on the , and images; see Lupton et al. 2004) can be viewed in a web browser with the SkyServer Navigate tool; (2) FITS images can be downloaded through the SAS; (3) Complete catalog information (astrometry, photometry, etc.) of any imaging object can be viewed through the SkyServer Explore tool; and (4) FITS files of the spectra can be downloaded through the SAS.
In addition, a number of catalog search tools are available through the SkyServer interface to the CAS, each of which returns catalog data for objects that match supplied criteria. For more advanced queries, a powerful and flexible catalog search website called “CasJobs” allows users to create their own personalized data sets and then to modify or graph their data.
The DR9 web site also features data access tutorials, a glossary of SDSS terms, and detailed documentation about algorithms used to process the imaging and spectroscopic data and select spectroscopic targets.
Imaging and spectroscopic data from all prior data releases are also available through DR9 data access tools.
7. Conclusions
The SDSS-III Data Release 9 presents the first data from the BOSS survey, with 102,000 new quasar spectra, 91,000 new stellar spectra and 536,000 new galaxy spectra. The astrometry has been improved since DR8, and the stellar properties for SEGUE-I/II and SDSS-I/II stars have been updated.
These data are already sufficient for cosmological analyses of large-scale structure, investigations of the structure of the Milky Way, measurements of quasar physics, clustering, and demographics, and countless other science investigations. We invite the larger scientific community to investigate and explore this new data set.
The SDSS-III project will present two more public data releases. DR10, in summer 2013, will include the first data from the APOGEE survey and another year of BOSS data. DR11 will be an internal release only, as a public release would occur only six months before the final public data release for SDSS-III, DR12, which will be released in December 2014 and will contain all of the data taken during the six years of the project.
References
- Abazajian et al. (2009) Abazajian, K. N., et al. 2009, ApJS, 182, 543
- Adelman-McCarthy et al. (2008) Adelman-McCarthy, J. K., et al. 2008, ApJS, 175, 297
- Aihara et al. (2011a) Aihara, H., et al. 2011a, ApJS, 193, 29
- Aihara et al. (2011b) —. 2011b, ApJS, 195, 26
- Allende Prieto et al. (2008) Allende Prieto, C., et al. 2008, AJ, 136, 2070
- Anderson et al. (2012) Anderson, L., et al. 2012, ArXiv e-prints
- Bolton et al. (2012) Bolton, A. et al. 2012, submitted to AJ
- Bond et al. (2010) Bond, N. A., et al. 2010, ApJ, 716, 1
- Bovy et al. (2011) Bovy, J., et al. 2011, ApJ, 729, 141
- Brinchmann et al. (2004) Brinchmann, J., Charlot, S., White, S. D. M., Tremonti, C., Kauffmann, G., Heckman, T., & Brinkmann, J. 2004, MNRAS, 351, 1151
- Bruzual & Charlot (2003) Bruzual, G. & Charlot, S. 2003, MNRAS, 344, 1000
- Cappellari & Emsellem (2004) Cappellari, M. & Emsellem, E. 2004, PASP, 116, 138
- Casagrande et al. (2010) Casagrande, L., Ramírez, I., Meléndez, J., Bessell, M., & Asplund, M. 2010, A&A, 512, A54
- Chen et al. (2012) Chen, Y.-M., et al. 2012, MNRAS, 421, 314
- Cole et al. (2005) Cole, S., et al. 2005, MNRAS, 362, 505
- Dawson et al. (2012) Dawson, K. et al. 2012, submitted to AJ
- Eisenstein et al. (2001) Eisenstein, D. J., et al. 2001, AJ, 122, 2267
- Eisenstein et al. (2011) Eisenstein, D. J., et al. 2011, AJ, 142, 72
- Eisenstein et al. (2005) Eisenstein, D. J., et al. 2005, ApJ, 633, 560
- Fan (1999) Fan, X. 1999, AJ, 117, 2528
- Fukugita et al. (1996) Fukugita, M., Ichikawa, T., Gunn, J. E., Doi, M., Shimasaku, K., & Schneider, D. P. 1996, AJ, 111, 1748
- Gunn et al. (2006) Gunn, J. E., et al. 2006, AJ, 131, 2332
- Hewett & Wild (2010) Hewett, P. C. & Wild, V. 2010, MNRAS, 405, 2302
- Kauffmann et al. (2003) Kauffmann, G., et al. 2003, MNRAS, 341, 33
- Komatsu et al. (2011) Komatsu, E., et al. 2011, ApJS, 192, 18
- Kroupa (2001) Kroupa, P. 2001, MNRAS, 322, 231
- Lee et al. (2012) Lee, K.-G. et al. 2012, in prep
- Lee et al. (2008a) Lee, Y. S., et al. 2008a, AJ, 136, 2022
- Lee et al. (2008b) Lee, Y. S., et al. 2008b, AJ, 136, 2050
- Lupton et al. (2004) Lupton, R., Blanton, M. R., Fekete, G., Hogg, D. W., O’Mullane, W., Szalay, A., & Wherry, N. 2004, PASP, 116, 133
- Maraston (2005) Maraston, C. 2005, MNRAS, 362, 799
- Maraston et al. (2012) Maraston, C., Pforr, J., Henriques, B. M., Thomas, D., Wake, D., Brownstein, J. R., Capozzi, D., Bundy, K., Skibba, R. A., Beifiori, A., Nichol, R. C., Edmondson, E., Schneider, D. P., Chen, Y., Masters, K. L., Steele, O., Bolton, A. S., York, D. G., Bizyaev, D., Brewington, H., Malanushenko, E., Malanushenko, V., Snedden, S., Oravetz, D., Pan, K., Shelden, A., & Simmons, A. 2012, ArXiv e-prints, submitted to MNRAS.
- Maraston & Strömbäck (2011) Maraston, C. & Strömbäck, G. 2011, MNRAS, 418, 2785
- Maraston et al. (2009) Maraston, C., Strömbäck, G., Thomas, D., Wake, D. A., & Nichol, R. C. 2009, MNRAS, 394, L107
- McDonald & Eisenstein (2007) McDonald, P. & Eisenstein, D. J. 2007, Phys. Rev. D, 76, 063009
- McQuinn & White (2011) McQuinn, M. & White, M. 2011, MNRAS, 415, 2257
- Monet et al. (2003) Monet, D. G., et al. 2003, AJ, 125, 984
- Padmanabhan et al. (2012a) Padmanabhan, N., Xu, X., Eisenstein, D. J., Scalzo, R., Cuesta, A. J., Mehta, K. T., & Kazin, E. 2012a, ArXiv e-prints
- Padmanabhan et al. (2012b) Padmanabhan, N. et al. 2012b, in prep
- Palanque-Delabrouille et al. (2011) Palanque-Delabrouille, N., et al. 2011, A&A, 530, A122
- Pâris et al. (2012) Pâris, I. et al. 2012, submitted to A&A
- Percival et al. (2010) Percival, W. J., et al. 2010, MNRAS, 401, 2148
- Richards et al. (2002) Richards, G. T., et al. 2002, AJ, 123, 2945
- Rockosi et al. (2012) Rockosi, C. et al. 2012, in prep
- Ross et al. (2012) Ross, N. P., et al. 2012, ApJS, 199, 3
- Salpeter (1955) Salpeter, E. E. 1955, ApJ, 121, 161
- Sarzi et al. (2006) Sarzi, M., et al. 2006, MNRAS, 366, 1151
- Schlegel et al. (2012) Schlegel, D. et al. 2012, in prep
- Schneider et al. (2010) Schneider, D. P., et al. 2010, AJ, 139, 2360
- Slosar et al. (2011) Slosar, A., et al. 2011, J. Cosmology Astropart. Phys, 9, 1
- Smee et al. (2012) Smee, S. et al. 2012, in prep
- Smolinski et al. (2011) Smolinski, J. P., et al. 2011, AJ, 141, 89
- Strauss et al. (2002) Strauss, M. A., et al. 2002, AJ, 124, 1810
- Tegmark et al. (2006) Tegmark, M., et al. 2006, Phys. Rev. D, 74, 123507
- Thomas et al. (2012) Thomas, D., Steele, O., Maraston, C., Johansson, J., Beifiori, A., Pforr, J., Strombaeck, G., Tremonti, C. A., Wake, D., Bizyaev, D., Bolton, A., Brewington, H., Brownstein, J. R., Comparat, J., Kneib, J. P., Malanushenko, E., Malanushenko, V., Oravetz, D., Pan, K., Parejko, J. K., Schneider, D. P., Shelden, A., Simmons, A., Snedden, S., Tanaka, M., Weaver, B. A., & Yan, R. 2012, ArXiv e-prints, submitted to MNRAS.
- Tremonti et al. (2004) Tremonti, C. A., et al. 2004, ApJ, 613, 898
- Weinberg et al. (2012) Weinberg, D. H., Mortonson, M. J., Eisenstein, D. J., Hirata, C., Riess, A. G., & Rozo, E. 2012, ArXiv e-prints
- Yanny et al. (2009) Yanny, B., et al. 2009, AJ, 137, 4377
- York et al. (2000) York, D. G., et al. 2000, AJ, 120, 1579
- Zacharias et al. (2004) Zacharias, N., Urban, S. E., Zacharias, M. I., Wycoff, G. L., Hall, D. M., Monet, D. G., & Rafferty, T. J. 2004, AJ, 127, 3043