Orbit and Stellar Properties of the Young Triple V807 Tau
Abstract
We present new orbital measurements of the pre-main sequence triple system, V807 Tau, using adaptive optics imaging at the Keck Observatory. We computed an orbit for the close pair, V807 Tau BaBb, with a period of 12.312 0.058 years and a semi-major axis of 38.59 0.16 mas. By modeling the center of mass motion of the components in the close pair relative to the wide component, V807 Tau A, we measured a mass ratio of 0.843 0.050 for Bb/Ba. Combined with the total mass from the relative orbit, we derived individual masses of M⊙ and M⊙ at an average distance of 140 pc to the Taurus star forming region. We computed spectral energy distributions to determine the luminosities of the three components. We also measured their spectral types, effective temperatures, and rotational velocities based on spatially resolved spectra obtained at the Keck Observatory. If the rotational axes are aligned, then the projected rotational velocities imply that V807 Tau Ba and Bb are rotating much faster than V807 Tau A. The uncertainty in the stellar effective temperatures and distance to the system currently limit the comparison of our dynamical mass measurements with predictions based on evolutionary tracks for pre-main sequence stars. We also report preliminary results from a program to map the 3.6 cm radio emission from V807 Tau using the Very Long Baseline Array. With continued monitoring, these observations will provide a precise parallax for placing the dynamical masses on an absolute scale.
1 Introduction
V807 Tau (Elias 12, HBC 404) is a pre-main sequence (PMS) hierarchical triple system located in the Taurus star forming region. The system was resolved into two wide components at a separation of 300 mas by Ghez et al. (1993, 1995), Leinert et al. (1993), and Simon et al. (1996). White & Ghez (2001) and Hartigan & Kenyon (2003) identified the primary (V807 Tau A, Elias 12 S) as a K5K7 classical T Tauri star showing signs of an accretion disk, while the secondary (V807 Tau B, Elias 12 N) was identified as a M2M3 weak-lined T Tauri star with no evidence for accretion. Simon et al. (1995) resolved the secondary into two close components (V807 Tau BaBb, Elias 12 NaNb) during a lunar occultation. This close pair is separated by 40 mas. We have been mapping the orbital motion of V807 Tau as a triple system beginning in 1999 using the Fine Guidance Sensors (FGS) onboard the Hubble Space Telescope and later with adaptive optics imaging at the Keck Observatory (Schaefer et al., 2003, 2006).
Mapping the orbital motion of a binary star provides a fundamental way to measure the dynamical masses of the component stars. This can be accomplished by observing eclipsing double-lined spectroscopic binaries where the radial velocity variations and timing of the eclipse light curve yield the masses and radii of the component stars (e.g. Andersen, 1991). Alternatively, spatially resolving the visual orbit of a double-lined spectroscopic binary (SB2) yields the component stellar masses and distance to the system. At the distances to the nearest star forming regions (140 pc for the Taurus star forming region; Kenyon et al., 1994), resolving short period PMS SB2s becomes challenging and requires high angular resolution techniques (e.g. Steffen et al., 2001; Boden et al., 2005, 2007; Schaefer et al., 2008). With an orbital period of 12 years (Sect. 3.1), the velocity separation of the close binary components in V807 Tau are no more than a few km s-1. Attempts to measure the radial velocity variations are further complicated because the spectra of V807 Tau BaBb are rotationally broadened to velocity widths of 6070 km s-1 (Sect. 2.2).
Fortunately, the triple nature of V807 Tau provides an additional technique for determining the masses of the components in the close pair. When combined with an estimate for the distance to the system, the relative visual orbit between V807 Tau BaBb provides a measurement of their total mass. Additionally, the wide primary V807 Tau A provides a reference position to measure the astrometric motion of V807 Tau BaBb around their center of mass, providing a direct measurement of the mass ratio between the close components. Together, these measurements give the individual masses of the components in V807 Tau BaBb. A similar approach was followed to determine the masses for the components in the close pair in the T Tau triple system (Duchêne et al., 2006).
In this paper we present the results of a multi-wavelength campaign to study the V807 Tau triple system. We used infrared adaptive optics imaging at the Keck Observatory to map the astrometric motion of the close pair and present the orbital solution and component masses in Sect. 3.1. We also obtained spectra of the three components on several epochs using a high spectral resolution spectrometer operating with the adaptive optics system at the Keck Observatory to separate out the contribution of each component. Although we could not measure radial velocities precisely enough to determine a spectroscopic orbit, we discuss the spectral types and rotational properties of the stars within the system in Sections 2.2 and 4.2. Using estimates of the effective temperature and luminosity computed by fitting the spectral energy distribution for each component, we compare our dynamical measurements with predicted masses and ages from PMS evolutionary tracks in Section 4.1. We also report on the detection of 3.6 cm radio emission measured with the Very Long Baseline Array in Sections 2.3 and 3.3. The location of the radio emission is consistent with the infrared locations of the components in the close pair. With continued observations, the radio measurements could provide an independent measurement of the parallax of V807 Tau.
2 Observations and Data Reduction
2.1 Adaptive Optics Imaging
We obtained adaptive optics (AO) images of V807 Tau using the near-infrared camera NIRC2 (Wizinowich et al., 2000) on the 10-m Keck II Telescope at the W. M. Keck Observatory. The NIRC2 detector is a 10241024 Aladdin-3 InSb array. The images were taken with the narrow-field camera which has a plate scale of 9.9520.002 mas pixel-1 (Yelda et al., 2010). During each epoch, we obtained 1020 sets of dithered images, using a three-point dither pattern with a dither offset of . The primary star V807 Tau A was used as the AO guide star.
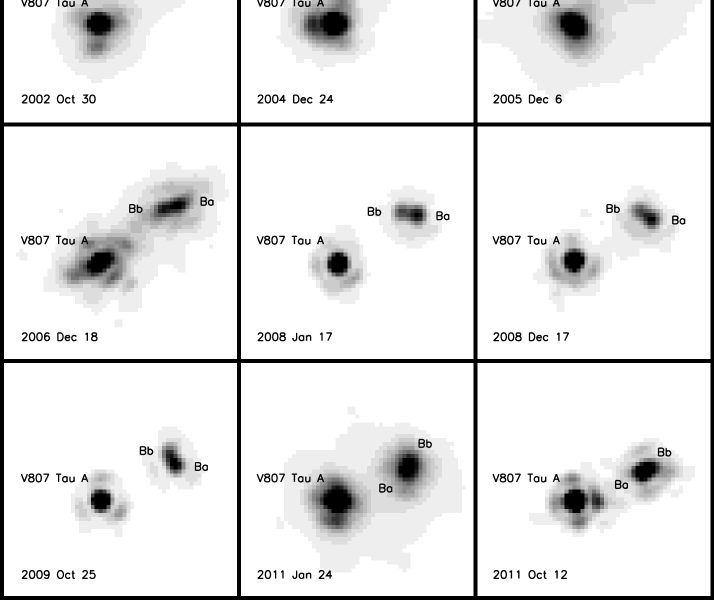
Table 1 lists the AO observations of V807 Tau taken since Schaefer et al. (2006). The table lists the filters, AO correction rates, exposure time, number of co-added exposures per image, and total number of images obtained. The images were flatfielded using dark-subtracted, median filtered dome flat fields obtained on the nights of observation. Pairs of dithered exposures were subtracted to remove the sky background. Figure 1 shows co-added AO images for V807 Tau from 20022011.
The wide primary V807 Tau A is sufficiently bright and close, within the isoplanatic patch, to V807 Tau B that it can be used as a simultaneous point-spread function (PSF) for measuring the separation and flux ratio of the close pair. We extracted subarrays from the images centered on the close pair, with widths of . We used V807 Tau A as a PSF to construct models of the close pair while searching through a grid of separations and flux ratios. We used the IDL INTERPOLATE procedure to shift the PSF by sub-pixel intervals using cubic convolution interpolation. To remove any excess light of the primary star from the extracted sub-array of the close pair, we followed a least-squares approach to fit the background as a slanting plane. We determined the position and flux ratio of the companions in the close binary from where the between the model and the data reached a minimum. After referencing the location of the close pair to V807 Tau A in the full array, we corrected the positions for geometric distortion by using the distortion solution computed by Yelda et al. (2010). We subtracted 0.252∘0.009∘ from the measured position angles to correct for the orientation of the NIRC2 camera relative to north. We determined uncertainties in the positions and flux ratios by analyzing multiple images individually and computing the standard deviation.
Table 2 lists the separation and position angle measured for V807 Tau ABa, ABb, and BaBb. The position angle is measured east of north and is referenced to the date of observation. For completeness, we also include previously published positions from Schaefer et al. (2006). We have revised the uncertainties for the close pair from the previously published values because we now use the standard deviation determined directly from the relative separation and position angle of the close pair rather than propagating the uncertainties derived from the widely spaced separations of ABa and ABb. We also corrected the previously published positions for geometric distortions in the camera.
The cumulative listing of infrared flux ratios measured for the V807 Tau triple system from the adaptive optics observations is presented in Table 3 which lists the flux ratios of Ba relative to A, Bb relative to A, and Bb relative to Ba. In the lower portion of the table we list weighted mean values for the flux ratios in the , , , and bands. We also used the photomultiplier (PMT) counts from the Fine Guidance Sensor observations (using the F583W filter) published in Schaefer et al. (2006) to estimate the V-band flux ratios. In Table 4, we convert the flux ratios to component magnitudes by using published photometry obtained for the unresolved system. The top portion of the table lists the published photometry for the total flux of V807 Tau (Kharchenko, 2001; Kharchenko & Roeser, 2009; Cutri et al., 2003) as well as magnitudes for the separated northern and southern components (White & Ghez, 2001). In the lower portion of the table we use these total magnitudes along with the average flux ratios in Table 3 to compute the magnitude of each component. We also use the FGS magnitude conversion (Holfeltz et al., 1995; Schaefer et al., 2003) to convert directly the mean PMT counts into V-band magnitudes of the components (using 1.2; White & Ghez, 2001).
2.2 High Resolution Spectroscopy
To measure radial and rotational velocities and determine spectral types, we obtained spectra with NIRSPEC, the near-infrared, cryogenic, cross-dispersed echelle spectrograph (McLean et al., 1998, 2000) on the Keck II telescope. Observations with NIRSPEC behind the AO system (NIRSPAO) separated the light of the V807 Tau components; additional unresolved spectra were taken with NIRSPEC alone. We centered the observations at 1.555 m and used the 2 pixel wide slit which yielded a spectral resolution . NIRSPAO provides a pixel scale of in the cross-dispersion direction, about 10.6 times finer than the scale for NIRSPEC. Table 5 summarizes the NIRSPEC and NIRSPAO observations. The diffraction-limited resolution at 1.6 m is . Columns 2 and 3 list the orbital phase and separation of V807 Tau BaBb during the times of the NIRSPAO observations predicted from the visual and astrometric orbital parameters (see Sect 3.1). For the 2001 and 2009 AO observations, we aligned the slit along the position angle of the BaBb binary; we also observed the A component separately in 2001. In 2003, 2006, and 2010, the slit was aligned along the AB axis which was fortuitously similar to the BaBb axis in 2003 and 2006. In 2010 the close binary was separated by less than 30 mas and thus unresolvable. Successful separation of the BaBb components was possible only for the 2001 and 2003 data. Nodding along the slit between sequential exposures by about half the slit length enabled removal of the sky background. Exposure times ranged from 60 to 360 seconds; because of the reduced throughput behind the AO system, NIRSPAO spectra required longer integrations.
The spectra were reduced and extracted using the REDSPEC software package555http://www2.keck.hawaii.edu/inst/nirspec/redspec.html. The software performs background subtraction, flat-fielding, spatial and spectral rectification, and subsequent extraction of the spectra. The spatial and spectral rectification removes curvature distortions in order to produce straight spectral traces. For non-AO observations the dispersion solution and wavelength calibration were computed with respect to OH night-sky lines (Rousselot et al., 2000). As a result of the reimaged optics and reduced throughput in the AO mode, the OH night sky lines in NIRSPAO spectra are too faint to be used for wavelength calibration and the internal Ne, Ar, Xe, and Kr arc lamps were used instead. For the purpose of measuring radial velocities, only the spectra in order 49 were extracted and used in the subsequent analysis. In addition to atomic lines, this spectral region (Figure 2) contains molecular lines, most notably OH and H2O, suitable for characterizing M and late-K spectral types, and is free of terrestrial absorption features (Prato, 1998; Prato et al., 2002; Mazeh et al., 2002).
On most NIRSPAO runs, resolved spectra of V807 Tau A and B were obtained, however, V807 Tau Ba and Bb were always blended because their separations were close to or below the diffraction limit. Nonetheless, when the components were at favorable separation and the AO correction particularly good, the pixel-1 scale of the detector in the cross-dispersion direction enabled us to extract individual spectra for Ba and Bb by fitting two Gaussians to the spatial profile of the data at each pixel, and thus wavelength, across order 49. We were able to extract unique spectra of Ba and Bb on 2001 Jan 8 and 2003 Dec 13 but were unable to separate the spectra from the later NIRSPAO runs when the components were at smaller separations. The unresolved spectra are designated Ba+Bb in Table 5.
We used our suite of NIRSPEC spectral templates (Prato et al., 2002; Bender et al., 2005) to identify by cross-correlation the template that best represented the spectrum of V807 Tau A and to measure its heliocentric radial velocity and rotational broadening. We determined the best fit by varying the spectral template and the applied rotational broadening to produce the highest cross-correlation coefficient; the radial velocity is given by the location of the peak. HR 8086, a K7V spectral type star, gave the best fit for V807 Tau A; the measured heliocentric radial velocities and rotational broadening are listed in Table 6. The average value and standard deviation of the radial velocity, km s-1, is a good approximation to the systemic velocity of the V807 Tau triple666At the pc distance of the Taurus star forming region the projected orbital separation of the V807 Tau AB triple is about 43 AU. Assuming a circular orbit and total mass 1.5 M⊙, the period is about 230 yrs, much greater than the orbital period of the BaBb binary.. The small downward trend in radial velocity at a rate of km s-1 per year is consistent with the amount of orbital motion that would be expected between the wide A-B pair. The broadening of the spectral lines indicates that V807 Tau A is rotating with a projected velocity of km s-1.
We applied the same analysis to the angularly resolved spectra of V807 Tau Ba and Bb. We obtained the best fit to the Ba spectrum with the template of Gl 752A, an M2V spectral type star, rotationally broadened to 6570 km s-1. The result for Bb is similar, the spectra are best fit by Gl 436 (M2.5V) and Gl 752A rotationally broadened to 6070 km s-1. The difference in spectral types of the two fits is not significant because the precision of spectral type determination is no better than one subtype. The spectral types are consistent with the determinations of the unresolved BaBb binary from broadband photometry (White & Ghez, 2001) and the visible light spectrum (Hartigan & Kenyon, 2003). We were unable to measure consistent radial velocities of Ba and Bb using stellar templates, or consistent velocity differences between the radial velocities of Ba and Bb by using one spectrum as the template for the other. We estimate the uncertainty of these measurements as km s-1. We were also unable to measure consistent radial velocities of the unresolved Ba Bb spectra by two-dimensional cross-correlation with stellar templates. Figure 3 shows predicted radial velocities versus phase of Ba and Bb and illustrates the difficulty in measuring their velocities. The predicted velocities were calculated using the orbital parameters and mass ratio = 0.843 in Section 3.1, systemic velocity, and 140 pc distance to the Taurus star forming region. The predicted velocity differences are never greater than km s-1. It was not possible to distinguish such small differences in radial velocities of Ba and Bb given the significant broadening of their spectra.
The observed templates used for the cross-correlation analysis are main sequence field objects while the components in V807 Tau are young stars still contracting to the main sequence. Hence, the PMS stars will have smaller surface gravities by about 0.3 to 0.5 in . Metal lines are weakly dependent on (Blake et al., 2007; Schlieder et al., 2012); the line centers remain the same while the equivalent width of most lines decreases with increasing . Therefore, the gravity dependence has no effect on our measurement of the radial velocities which are dominated by the location of the lines (e.g. Simon & Prato, 2004; Rosero et al., 2011) and only a negligible effect on the rotational broadening for lines as broad as those of V807 Tau Ba and Bb.
2.3 VLBA Radio Interferometry
Radio emission from V807 Tau was first detected by O’Neal et al. (1990) using the VLA. During two out of three epochs in 1986-1987, they measured a flux density of 0.71.2 mJy at 6 cm. We began a program to measure the radio emission at high resolution using the Very Long Baseline Array (VLBA) in 20072009. Our goals were to determine where in the system the radio emission comes from and to map the astrometric position over time to determine a parallax for the system (e.g. Lestrade et al., 1999; Loinard et al., 2005, 2008; Torres et al., 2007, 2009, 2012).
The VLBA (Napier et al., 1994; Napier, 1995) consists of ten 25-meter antennas spread across the United States territory from Saint Croix, VI to Mauna Kea, HI with baselines ranging from 236 to 8611 km. The signals are combined interferometrically by a correlator in Socorro, NM. We obtained six epochs of phase-referenced observations on V807 Tau at 3.6 cm (8.42 GHz) during 20072009. Each observation lasted a total of 10 hours, with 4 hours spent on V807 Tau. During each observation, we observed in cycles spending 2 minutes on V807 Tau and 1 minute on the primary phase reference calibrator J0426+2327=0423+233 located 1.6∘ away ( 0.14 Jy at 3.6cm)777http://www.vlba.nrao.edu/astro/calib/vlbaCalib.txt. Every 30 minutes we observed 1 minute integrations on the phase reference check sources J0429+2724=0426+273 and J0450+2249=0447+227 located 3.3∘ and 4.3∘ away, respectively ( = 0.32 and 0.12 Jy). The location of these three phase sources on the sky provides good coverage around V807 Tau, as shown in Figure 4. During the first exploratory observation, we used only J0426+2327 and J0429+2724 and spent 3 minutes on source and 2 minutes on the phase reference calibrators. In all of the epochs, we observed the fringe finder 3C 84 twice during each night. We also observed three sets of 67 calibration sources covering a range of elevations spaced apart in time by about 4 hours. These sources were observed using a wide bandwidth frequency setup to compute multi-band delays and correct for errors in the troposphere model.
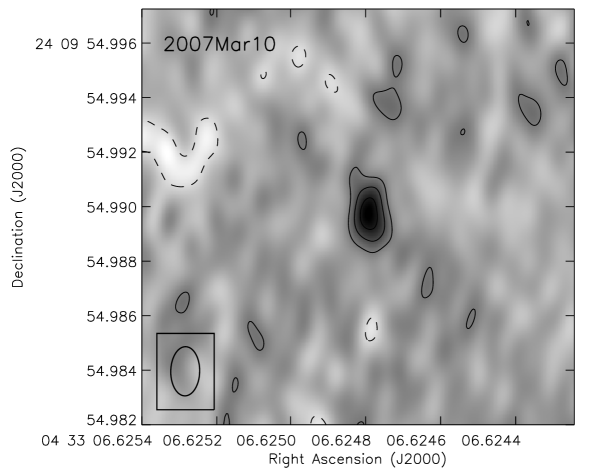
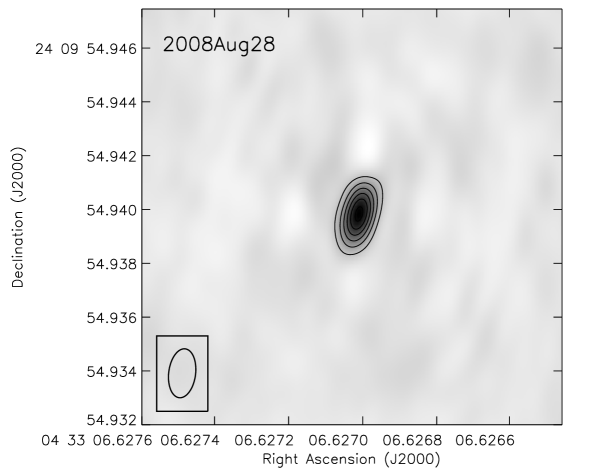
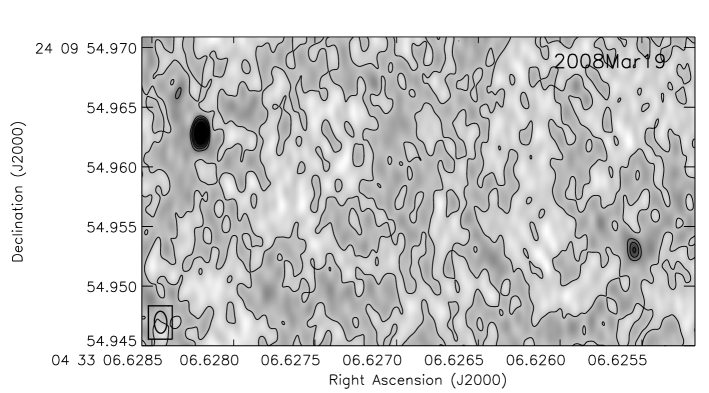
We reduced and calibrated the VLBA data using the Astronomical Image Processing System (AIPS; van Moorsel et al., 1996) developed by NRAO following the standard procedures for reducing VLBA data. This includes applying ionospheric corrections, updating Earth orientation parameters, amplitude calibration, correction to phases for the parallactic angle of the antennas, and removal of instrumental delay residuals. We corrected for errors in the tropospheric models by using the DELZN procedure (Mioduszewski & Kogan, 2009) to model the multi-band delay on the wide-band calibrator sets. We performed a global fringe fit to remove global frequency and time dependent errors. We used the primary and secondary phase calibrators to measure and correct for the phase gradient on the sky using the ATMCA routine (Fomalont & Kogan, 2005). We produced cleaned images using the difmap routine888ftp://ftp.astro.caltech.edu/pub/difmap/difmap.html (Shepherd, 1997) with natural weighting (equal weighting of all data points) to provide higher sensitivity on weak sources. Reading the image back into AIPS, we used the JMFIT task to solve for the position, integrated intensity, and angular size of the source by fitting a two-dimensional Gaussian model to the data. The results from the fit are presented in Table 7 which gives the RA and DEC coordinates, integrated intensity, major and minor axes (FWHM), and position angle of the Gaussian model. We detected compact radio emission in three of the six epochs of VLBA observations. On 2007 Mar 10 and 2008 Aug 28 we detected a single source and on 2008 Mar 19 we detected two sources. The integrated intensity ranges between 0.52 to 8.60 mJy. The non-detections during the remaining three epochs were likely caused by intrinsic variability of the source. By imaging the phase reference and check sources during each of the VLBA epochs, we determined that our measured source coordinates are consistent with the catalog positions of the calibrators to better than 0.15 mas. Figure 5 shows the cleaned images of V807 Tau during the three epochs with detected emission. The position of the radio emission is consistent with the location of the components in the close pair, V807 Tau Ba and Bb (see Sect. 3.3 for more details).
The radio emission from V807 Tau is most likely non-thermal and thus is expected to be polarized. While the phase-referenced observations were not planned with polarimetry in mind, we performed a polarization calibration in order to learn what we could from detections or limits on the polarized flux. We solved for the right-left (RL) phase difference (Cotton, 1993) using the AIPS task RLDLY and used our weakly polarized fringe-finder 3C 84 to determine the RL delay. We solved for the instrumental polarization (D-terms) using the AIPS task LPCAL (Leppänen et al., 1995) applied to the phase reference source J0426+2327. To examine the success of our polarization calibration we imaged 3C 84 in Stokes Q and U and made a polarized intensity image. We found the southern lobe of 3C 84 to be weakly polarized. Fortuitously, calibrated polarization images of 3C 84 were available via the publicly accessible MOJAVE archive (Lister et al., 2009). 3C 84 was observed on 2008 Aug 25 and the southern lobe was weakly polarized at a location coincident with our detection. Satisfied that the polarization calibration worked well enough we imaged V807 Tau in Stokes Q, U and V using the 2008 Aug 28 data. This date had a sufficient Stokes I flux that even a small fractional polarization might be detected. We found no detectable polarized flux at this epoch and set 3 limits on the fractional linear polarization of 11% and on the fractional circular polarization of 8%.
3 Analysis
3.1 Orbital Solution
Figure 6 shows the relative motion observed for the close pair based on the measurements listed in Table 2, where the position of V807 Tau Bb is plotted relative to V807 Tau Ba. Over 10 years of FGS and AO observations, the close pair has moved through a complete orbit. We computed an orbit for the close pair using a standard Newton Raphson technique. Table 8 lists the best fitting orbital parameters for the period , time of periastron , eccentricity , semi-major axis (in mas), inclination , position angle of the line of nodes , and the longitude of periastron . The and reduced of the fit are also listed in the table. The uncertainties were estimated from the diagonal elements of the covariance matrix. The orbit, with a period of 12.3 years and a semi-major axis of 38.6 mas, is overplotted in Figure 6. At an average distance to the Taurus star forming region of 140 pc (Kenyon et al., 1994), Kepler’s Third Law yields a total mass of M⊙.
In Schaefer et al. (2006) we presented a variety of possible orbit fits for V807 Tau BaBb based on a limited number of early FGS, AO, and lunar occultation measurements (we refer to the system as “Elias 12 Na-Nb” in the previous paper). Based on the preliminary analysis of orbits that fit the available data at the time, we originally estimated that the period of V807 Tau BaBb ranged from 912 years. This is quite close to the actual period of years that we measure with improved accuracy and precision because the orbital motion now covers a full orbital period. Moreover, the total mass determined from the statistical analysis of orbits that fit the data presented in Schaefer et al. (2006, 1.13 M⊙) agrees within 1 with our results, confirming our earlier conclusion that it is possible to derive a reasonable estimate of the total mass in a binary with limited orbital coverage because of the tight correlation between and . The total mass we derived in Schaefer et al. (2006) when we added the lunar occultation observation from Simon et al. (1995) to improve the time coverage of the limited set of orbital measurements ( M⊙) also agrees quite well with our more precise current value. We do not include the lunar occultation within our current solution because it represents only a one dimensional measurement of the projected separation along the direction of the occultation and we currently have sufficient orbital coverage to measure the period reliably without including it. Nonetheless, the projected separation measured in the 1992 occultation agrees within 5.3 mas (2.3 ) with the separation predicted from our orbit fit. Including the lunar occultation in the fit only marginally changes the orbital parameters within their 1 error bars, but it also raises the from 15.4 to 20.1 because of the 2.3 disagreement with the measured projected separation.
The wide component, V807 Tau A, is located within 250 mas of the close pair and lies within the adaptive optics field of view. This allows us to map the astrometric motion of the close pair relative to V807 Tau A and model the motion of Ba and Bb around their center of mass. Figure 7 shows the motion of V807 Tau Ba and Bb as measured relative to V807 Tau A. We derived a value for the mass ratio of the close pair () by modeling the center of mass motion of V807 Tau B relative to V807 Tau A. To do this, we searched through a range of mass ratios and computed the expected location of the center of mass of V807 Tau BaBb during each epoch based on the given mass ratio and the measured positions of Ba and Bb relative to V807 Tau A (Table 2). For each trial mass ratio, we then fit a representative orbit to the center of mass motion of B relative to A and selected the mass ratio that minimized the between the calculated position of the center of mass and the orbit fit (see Figure 8). An incorrect mass ratio will produce residual reflex motion that cannot be fit by a simple Keplerian orbit.
We do not have enough coverage to determine a definitive orbit for the wide A-B pair, however, it is only necessary to find a representative orbit that adequately describes the orbital motion of the center of mass over the time-frame of our measurements. In fact, there is a large range of orbits that can fit the limited data equally as well (e.g. see Figures 3, 5, and 10 in Schaefer et al., 2006, which show examples of how a family of possible orbits can fit a limited number of measurements for an incomplete orbit.). To optimize the fit to the center of mass motion, we searched through a grid of possible orbits for each mass ratio explored. The possible orbits were selected by randomly choosing , , over a range of values and performing a least-squares fit to optimize the remaining parameters following the method described in Schaefer et al. (2006) (see also Hartkopf et al., 1989). We searched through periods ranging from 100 to 500 years, eccentricities from 0 to 0.99, and allowed the time of periastron passage to vary within one orbital period. For each mass ratio, we selected the “best-fitting” representative orbit that minimized between the calculated position of the center of mass and the orbit fit. We then selected the mass ratio that produced the smallest as the best fit. We determined the uncertainty in the mass ratio from the 1 confidence interval (). When combined with the total mass, the best fitting mass ratio of 0.843 0.050 yields individual masses of M⊙ and M⊙.
The dynamical masses were computed using the average distance of 140 pc to the Taurus star forming region (Kenyon et al., 1994) and scale as . Including the 10 pc uncertainty in the average distance to the masses contributes an additional systematic uncertainty of 0.24 M⊙ to the error budget. Star formation in Taurus occurred in several clumps. Several individual members in the region are known to have precise distances ranging from 128.5 pc for Hubble 4 and 161.2 pc for HP Tau/G2 (Torres et al., 2009, and reference therein). The position on the sky of V807 Tau is near HP Tau/G2; if its distance is similar too, then the actual masses will be 1.5 times larger. VLBA observations to measure the distance to V807 Tau (see Sect 2.3 and 3.3) are in progress.
3.2 Spectral Energy Distributions
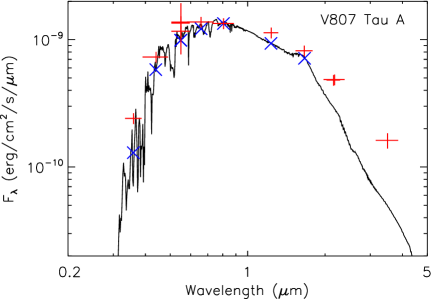
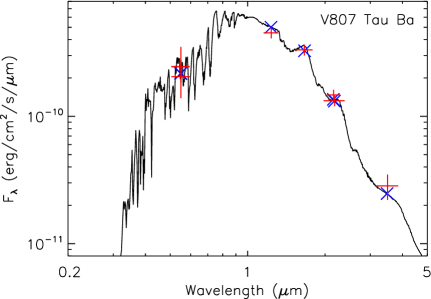
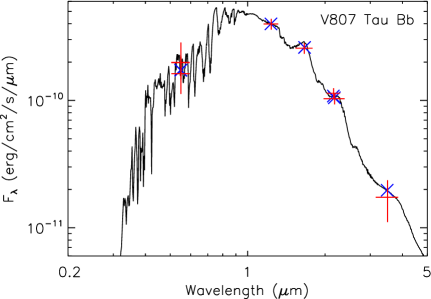
We constructed spectral energy distributions (SED) for each of the three components, V807 Tau A, Ba, and Bb, using the magnitudes listed in Table 4. We converted the observed magnitudes to measured fluxes through
| (1) |
where is the wavelength-dependent interstellar extinction assuming an R=3.1 reddening law (Cardelli et al., 1989; O’Donnell, 1994) and is the zero-point flux density for a filter at wavelength . We then fit low resolution spectral models computed by R. Kurucz and Castelli999http://kurucz.harvard.edu/grids.html,101010http://wwwuser.oat.ts.astro.it/castelli/grids/gridp00k0odfnew/fp00k0tab.html to the measured photometry. We averaged the flux of the stellar models across the width of each of the observed filter bands. The emergent flux from the star given by the models scales as the area subtended on the sky (or as the square of the stellar angular diameter). Therefore, fitting the SED with stellar models is dependent on three parameters, the effective temperature of the stellar model, the angular diameter of the star , and the interstellar extinction in the -band. The SED fits also provide an estimate of the bolometric flux and the luminosity .
We converted the spectral types determined from the NIRSPAO spectra to effective temperatures using the dwarf spectral type temperature relations used in Kraus & Hillenbrand (2007) for K0M0 and the T-Tauri temperature scale defined in Luhman et al. (2003) for M1M7. We fixed these temperatures when computing the SED fits and determined uncertainties by varying the model spectrum by one spectral step ( 250 K) and calculating the range of variation in the derived parameters. We know from the FGS photometry that V807 Tau A is variable (see Fig. 15 in Schaefer et al., 2006); this is consistent with its classification as a classical T Tauri star. To account for the variability potentially being propagated through to the magnitudes of the individual components, we applied a floor uncertainty of 0.1 mag to all of the magnitudes listed Table 4. In Table 9, we list the spectral type, adopted , and the parameters derived from the SED fit including , , , and . Figure 9 shows plots of the SED fits. For V807 Tau A, we did not include the and -band magnitudes in the fit because they are affected by the infrared excess from the circumstellar disk. Therefore, the luminosity we calculate for V807 Tau A should mostly reflect the star, with little contamination from the disk. The SED fits for V807 Tau Ba and Bb show that the infrared magnitudes are well matched by the spectral templates, confirming that there is no evidence for circumstellar disks around these weak-lined T Tauri stars (White & Ghez, 2001; Hartigan & Kenyon, 2003). The luminosities we derive are in agreement with the estimates for the AB components determined by White & Ghez (2001). The presence of a disk can also be identified by a deredenned color in excess of 0.4 (e.g. Prato et al., 2003). Converting the 2MASS magnitudes to the Bessell-Brett homogenized system (Carpenter, 2001) and averaging the two -band magnitudes from Table 4, we obtain dereddened = mag for V807 Tau A and mag and mag for Ba and Bb, respectively. As with the SED fits, these values show strong evidence for a disk in V807 Tau A and the absence of a disk around Ba and Bb.
3.3 Comparison of Radio and Infrared Positions
We detected a compact radio source in three of the six epochs of VLBA observations. Using the optical coordinates and proper motion of V807 Tau in Ducourant et al. (2005), we computed the location of the optical source during the times of the VLBA epochs. Assuming that the optical coordinates are dominated by the light from V807 Tau A and using the relative positions of V807 Tau A, Ba, and Bb from the adaptive optics images, we find that the VLBA coordinates are consistent with the location of the close pair to within 50 mas. The standard error on the optical coordinates is 39 mas (Ducourant et al., 2005).
To determine whether the radio emission is coming from V807 Tau Ba or Bb, we used our astrometric orbital fit (Fig. 7) to compute the predicted locations of Ba and Bb during the times of the VLBA observations. We then applied the appropriate parallactic shift caused by a parallax of 7.14 mas (using the 140 pc distance from Kenyon et al. 1994) and added in the proper motion to compare the infrared positions with the motion observed in the VLBA reference frame. During the two epochs with a detection of only a single source, we find that the radio position is consistent with the infrared location of V807 Tau Ba on 2007 Mar 10 and 2008 Aug 28. On 2008 Mar 19, the faint radio source agrees with the infrared location of V807 Tau Ba while the brighter radio source matches the location of V807 Tau Bb. The relative position of the two radio sources during this epoch ( mas, PA = 75.04∘) agrees quite nicely with the predicted position based on our orbit fit ( mas, PA = 75.00∘).
To minimize the difference between the infrared and radio positions, we adjusted the parallax, proper motion, and the relative shift between the two frames. Following this approach, we determined a best fitting parallax of and proper motion of mas yr-1, mas yr-1. We show a comparison of the radio and infrared positions using these proper motions in Figure 10. Our measurements are consistent with the range of proper motions measured for stars in the Taurus star forming region (Ducourant et al., 2005; Bertout & Genova, 2006). They are marginally consistent with the proper motion measured individually for V807 Tau by Ducourant et al. (2005) ( mas yr-1, mas yr-1). The optical measurement could be affected by an offset in the photocenter caused by the orbital motion of the three components in the system which might account for the discrepancy in . We note that V807 Tau lies within the same region of the Taurus cloud complex as HP Tau/G2, a target that has a reliable parallax and proper motion measured using the VLBA (see spatial distribution of VLBA sources in Fig. 5 of Torres et al., 2009). The proper motion we measure for V807 Tau is similar to that measured for HP Tau/G2 ( mas yr-1, mas yr-1, mas), as would be expected from two sources that might be located physically near to each other.
Ultimately, our goal is to combine these multi-epoch VLBA observations of V807 Tau to derive a distance with 24% precision, similar to that obtained for other young stars in Taurus and Ophiuchus (Lestrade et al., 1999; Loinard et al., 2005, 2008; Torres et al., 2007, 2009, 2012). Our preliminary parallax has a much larger uncertainty, but is consistent with the range of distances measured for other members of the Taurus star forming region (130160 pc). It was difficult to obtain a more precise parallax for V807 Tau based on the current set of VLBA data because the radio emission from the two components is weak and variable and was not detected in half of the epochs. We plan to continue these observations in the future to improve the precision of our results.
Based on the VLBA maps, the size of the radio emitting regions during each epoch is smaller than 2 mas ( 60 R⊙ or 40 R∗ assuming a stellar radius of 1.5 R⊙). The lack of disk signatures associated with V807 Tau Ba and Bb suggests that the variable and compact radio emission likely arises from magnetic activity and reconnection flares in the stellar magnetospheres of each component (e.g. Feigelson & Montmerle, 1999). The properties of the radio emission from V807 Tau Ba and Bb are consistent with those found around other weak-lined T Tauri stars which often show variability and the presence of radio flares (e.g. O’Neal et al., 1990; Feigelson et al., 1994). The compact size and correspondingly high brightness temperatures of radio emission associated with weak-lined T Tauri stars generally indicates a non-thermal emission source (Phillips et al., 1991; André et al., 1992). Using the major axis of the Gaussian models that we fit to the VLBA data as an upper limit to the size of the radio emitting regions around V807 Tau Ba and Bb, we compute a brightness temperature ranging from to (using Eq. 1 in Skinner, 1993); this is consistent with the brightness temperatures expected from non-thermal emission (; André et al., 1992). Circular polarization is often undetected in radio emitting weak-lined T Tauri stars, but has been detected occasionally in a few of the stronger radio emitting weak-lined T Tauri stars, typically at a level of a few percent (e.g. White et al., 1992). The presence of circular polarization in the stronger sources indicates that the emission is likely gyrosynchrotron radiation. The upper limit on the degree of polarization measured for V807 Tau ( 8%) is consistent with these expectations. In another young triple system, the close binary V773 Tau AaAb ( 51 days, 0.30.5 AU) shows enhanced radio flares during periastron passage (Massi et al., 2006, 2008; Torres et al., 2012). However, the larger separation between the components in V807 Tau BaBb ( 3.87.0 AU) makes it unlikely that similar inter-binary magnetic interactions would take place in the system.
4 Discussion
4.1 Comparison with evolutionary tracks
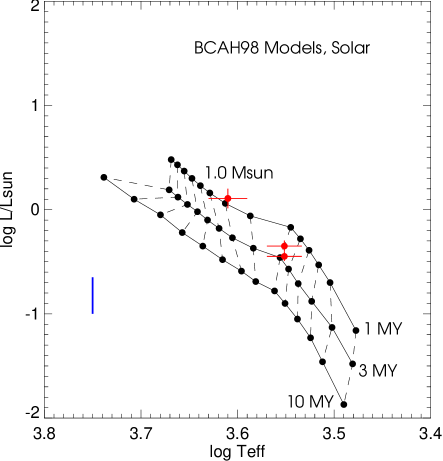
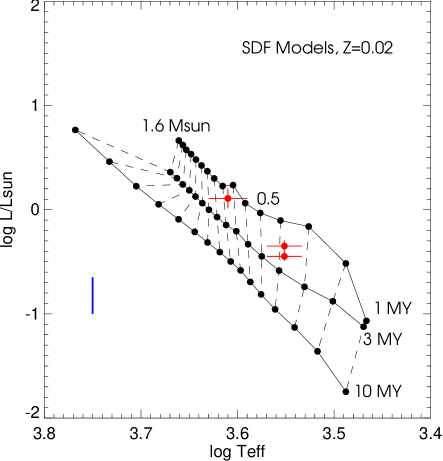
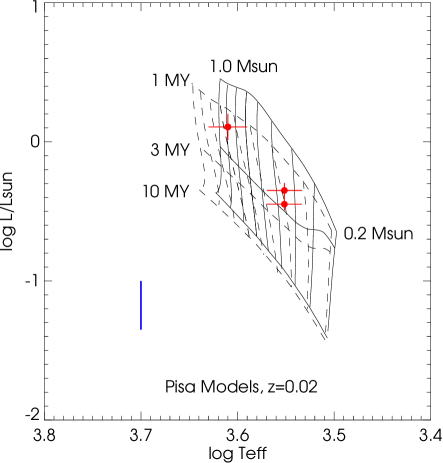
We compare the locations of V807 Tau A, Ba, and Bb in the HR diagram to theoretical models of pre-main sequence stellar evolution in Figure 11. We plot the luminosity and effective temperature of each component listed in Table 9 and compute expected masses and ages based on the evolutionary tracks computed by Baraffe et al. (1998, BCAH), Siess et al. (2000, SDF), and Tognelli et al. (2011, Pisa models).
The BCAH tracks predict a mass of M⊙ at an age of Myr for V807 Tau Ba and Bb and a mass of M⊙ at an age of Myr for V807 Tau A. The SDF tracks predict a mass of M⊙ at an age of Myr for V807 Tau Ba and Bb and a mass of M⊙ at an age of Myr for V807 Tau A. For the Ba and Bb components, the BCAH tracks predict a mass greater than the SDF tracks while the age estimates are about the same. Compared with the dynamical mass measurements at a distance of 140 pc, the BCAH tracks are in good agreement with the mass of Ba ( M⊙), while the SDF tracks underestimate its value by 2 . For the Bb component ( M⊙), the BCAH tracks overestimate the dynamical mass while the SDF tracks underestimate the value, both by 1 . The precision in determining the effective temperature based on our library of spectral templates limits our ability to discern finer differences in the predicted masses of V807 Tau Ba and Bb from the evolutionary tracks. Furthermore, if we include the uncertainty in the distance to V807 Tau, then each of the predicted evolutionary masses becomes consistent with the dynamical estimates to within 1 . The uncertainty in the distance can be improved independently, for example, by measuring a geometric parallax using the VLBA. The internal precision of the dynamical masses from the orbit fitting indicates that with an improved estimate of the distance, we can begin to make more meaningful comparisons between the evolutionary tracks.
For the Pisa models, we compare our results with tracks at solar metallicity (=0.02, =0.288, deuterium fraction 210-4) using a mixing length parameter of and 1.68. For , the Pisa tracks predict a mass of M⊙ at an age of Myr for V807 Tau Ba and Bb and a mass of M⊙ at an age of Myr for V807 Tau A. For the larger mixing length of , the Pisa tracks predict a mass of M⊙ at an age of Myr for V807 Tau Ba and Bb and a mass of M⊙ at an age of Myr for V807 Tau A. Based on these results, it appears that the tracks at are more consistent with the dynamical masses of V807 Tau Ba and Bb at a distance of 140 pc. As mentioned previously, including the current uncertainty in the distance to V807 Tau makes this distinction less significant.
For the evolutionary models that we considered, the ages for the components of V807 Tau are approximately 2 Myr. This is in agreement with the mean age of 2.5 Myr determined from a larger census of the Taurus star forming region in White & Ghez (2001). If all three components in V807 Tau formed at the same time, the agreement among the ages predicted for each component is more consistent for the SDF and Pisa tracks than it is for the BCAH models. The age of the system depends on the actual distance to V807 Tau. Because the distance provides the same scaling factor for all three components, the relative coevality between the components should remain consistent for a given set of tracks while the absolute age will shift. For members of the Taurus star forming region with accurate VLBA parallaxes, the spread in distance ranges from 130 to 160 pc (Torres et al., 2009). Our comparisons assume a distance of 140 pc. If the distance proves to be closer to 160 pc (as the location of V807 Tau in Fig. 5 of Torres et al. 2009 might suggest), then the luminosities will be 0.12 dex greater and the ages would turn out to be closer to 1 Myr.
4.2 Component Rotation
Assuming that the rotational axes of V807 Tau A, Ba, Bb, and the orbital axis of the BaBb binary are aligned, the projected rotational velocities we measured imply that Ba and Bb ( = 6070 km s-1) are rotating much faster than A ( = 15 km s-1). As discussed in Section 3.2, V807 Tau A is identified as a classical T Tauri star with an infrared excess from a circumstellar disk, while V807 Tau Ba and Bb are classified as weak-lined T Tauri stars without any evidence for a disk. The most efficient method for young stars to shed angular momentum is through disk locking (e.g. Stassun & Terndrup, 2003; Dahm et al., 2012). Therefore, the presence of a disk around V807 Tau A and none within the V807 Tau B pair may explain the large difference in the rotational velocities between the components. The difference in rotational velocities in the V807 Tau system is also consistent with the study by Meibom et al. (2007) which shows that young, close binaries typically rotate faster than single stars and wider binaries, as a consequence of the close companion shortening the lifetime of the circumstellar disk and, in turn, the amount of time available for disk-braking.
The break-up velocity of a 0.5 star is km s-1 using a radius of at 2 Myr (Siess et al., 2000). If the rotational axes of Ba and Bb are inclined by about the same amount as the orbital inclination of the BaBb binary, , then they are actually rotating about twice as fast, km s-1, or about two thirds of breakup. The rotational velocity measured for V807 Tau Ba and Bb is higher than the average value of 11 km s-1 measured for M-stars in the Taurus star forming region (Nguyen et al., 2009), however there are individual low-mass young stars which have projected rotational velocities similar to V807 Tau Ba and Bb. To remove the dependence on the inclination from this comparison, we can convert the estimated rotational velocity of the components in V807 Tau Ba and Bb to a rotation period of 0.5 days (using ) and compare to the rotation periods measured for stars in young clusters. As shown in Irwin & Bouvier (2009), although it is rare for low-mass young stars to be rotating so rapidly, there are other 0.5 stars present in nearby young clusters that have similarly short rotation periods at an age of about 25 Myr.
5 Summary
1. We measured the orbital motion within the PMS triple, V807 Tau, using adaptive optics imaging at the Keck Observatory. The relative orbit of V807 Tau BaBb combined with the motion of Ba and Bb around their center of mass, measured relative to V807 Tau A, yields dynamical masses of M⊙ and M⊙. The uncertainty in the masses represent the errors computed from the orbit fit; the systematic uncertainty in the distance is reflected by the additional scaling factor.
2. Based on spatially resolved high resolution spectra, we determined the spectral types of K7 for V807 Tau A and M2 for V807 Tau Ba and Bb. The broadening of the spectral lines indicates that V807 Tau A is rotating with a projected velocity of 15 km s-1. The spectra of V807 Tau Ba and Bb are rotationally broadened by 6570 km s-1. If the rotational axes of the three stars are aligned, this indicates that the components in the close pair are rotating much more quickly than V807 Tau A.
3. The spectral energy distribution of V807 Tau A shows an excess above the stellar model in the and -bands. This is consistent with its classification as a classical T Tauri star with an accretion disk. The spectral energy distributions for V807 Tau Ba and Bb show that the infrared magnitudes are well matched by the spectral templates, consistent with a lack of circumstellar material around these weak-lined T Tauri stars.
4. Uncertainties in the distance to the system and the effective temperatures of the components are the main limitations to a more detailed comparison of our dynamical mass measurements with predictions based on evolutionary tracks for pre-main sequence stars. At a distance of 140 pc, the tracks indicate an age of 2 Myr for the V807 Tau triple.
5. We detected compact radio emission from V807 Tau during three out of six epochs using the VLBA. The emission is variable, with the integrated intensity ranging from 0.52 to 8.60 mJy. Comparing the position of the radio source with the motion observed in our infrared images, we determined that the emission originated from V807 Tau Ba in the first and third detected epochs, while both V807 Tau Ba and Bb were detected in the second epoch. Continued monitoring with the VLBA in the future will provide a precise parallax measurement for V807 Tau. This will help place the dynamical masses on an absolute scale.
References
- Andersen (1991) Andersen, J. 1991, A&A Rev., 3, 91
- André et al. (1992) André, P., Deeney, B. D., Phillips, R. B. & Lestrade, J.-F. 1992, ApJ, 401, 667
- Baraffe et al. (1998) Baraffe, I., Chabrier, G., Allard, F., & Hauschildt, P. H. 1998, A&A, 337, 403
- Bender et al. (2005) Bender, C., Simon, M., Prato, L., Mazeh, T., & Zucker, S. 2005, AJ, 129, 402
- Bertout & Genova (2006) Bertout, C., & Genova, F. 2006, A&A, 460, 499
- Blake et al. (2007) Blake, C. H., Charbonneau, D., White, R. J., Marley, M. S., & Saumon, D. 2007, ApJ, 666, 1198
- Boden et al. (2005) Boden, A. F., et al. 2005, ApJ, 635, 442
- Boden et al. (2007) Boden, A. F., et al. 2007, ApJ, 670, 1214
- Cardelli et al. (1989) Cardelli, J. A., Clayton, G. C., & Mathis, J. S. 1989, ApJ, 345, 245
- Carpenter (2001) Carpenter, J. M. 2001, AJ, 121, 2851
- Cotton (1993) Cotton, W. D. 1993, AJ, 106, 1241
- Cutri et al. (2003) Cutri, R. M., et al. 2003, 2MASS All Sky Catalog of Point Sources (Pasadena, CA: NASA/IPAC)
- Dahm et al. (2012) Dahm, S. E., Slesnick, C. L., & White, R. J. 2012, ApJ, 745, 56
- Duchêne et al. (2006) Duchêne, G., Beust, H., Adjali, F., Konopacky, Q. M., & Ghez, A. M. 2006, A&A, 457, L9
- Ducourant et al. (2005) Ducourant, C., Teixeira, R., Périé, J. P., Lecampion, J. F., Guibert, J., & Sartori, M. J. 2005, A&A, 438, 769
- Feigelson & Montmerle (1999) Feigelson, E. D. & Montmerle, T. 1999, ARA&A, 37, 363
- Feigelson et al. (1994) Feigelson, E. D., Welty, A. D., Imhoff, C., Hall, J. C., Etzel, P. B., Phillips, R. B., & Lonsdale, C. J. 1994, ApJ, 432, 373
- Fomalont & Kogan (2005) Fomalont, E. & Kogan, L. 2005, ATMCA: Phase Referencing using more than one Calibrator (AIPS memo 111; Socorro, NM: NRAO)
- Ghez et al. (1993) Ghez, A. M., Neugebauer, G., & Matthews, K. 1993, AJ, 106, 2005
- Ghez et al. (1995) Ghez, A. M., Weinberger, A. J., Neugebauer, G., Matthews, K., & McCarthy, Jr., D. W. 1995, AJ, 110, 753
- Hartigan & Kenyon (2003) Hartigan, P. & Kenyon, S. J. 2003, ApJ, 583, 334
- Hartkopf et al. (1989) Hartkopf, W. I., McAlister, H. A., Franz, O. G., 1989, AJ, 98, 1014
- Holfeltz et al. (1995) Holfeltz, S. T., Nelan, E. P., Taff, L. G., & Lattanzi, M. G. 1995, Hubble Space Telescope Fine Guidance Sensor Instrument Handbook, Version 5.0 (Baltimore, MD: STScI)
- Irwin & Bouvier (2009) Irwin, J. & Bouvier, J. 2009, in IAU Symp. 258, The Ages of Stars, ed. E. E. Mamajek, D. R. Soderblom, & R. F. G.Wyse (Cambridge: Cambridge Univ. Press), 363
- Kenyon et al. (1994) Kenyon, S. J., Dobrzycka, D., & Hartmann, L. 1994, AJ, 108, 1872
- Kharchenko (2001) Kharchenko, N. V. 2001, Kinematika i Fizika Nebesnykh Tel, 17, 409
- Kharchenko & Roeser (2009) Kharchenko, N. V. & Roeser, S. 2009, VizieR Online Data Catalog, 1280, 0
- Kraus & Hillenbrand (2007) Kraus, A. L., & Hillenbrand, L. A. 2007, AJ, 134, 2340
- Leinert et al. (1993) Leinert, C., Zinnecker, H., Weitzel, N., Christou, J., Ridgway, S. T., Jameson, R., Haas, M., & Lenzen, R. 1993, A&A, 278, 129
- Leppänen et al. (1995) Leppänen, K. J., Zensus, J. A., & Diamond, P. J. 1995, AJ, 110, 2479
- Lestrade et al. (1999) Lestrade, J.-F., Preston, R. A., Jones, D. L., Phillips, R. B., Rogers, A. E. E., Titus, M. A., Rioja, M. J., & Gabuzda, D. C. 1999, A&A, 344, 1014
- Lister et al. (2009) Lister, M. L., et al. 2009, AJ, 138, 1874
- Loinard et al. (2005) Loinard, L., Mioduszewski, A. J., Rodríguez, L. F., González, R. A., Rodríguez, M. I., & Torres, R. M. 2005, ApJ, 619, L179
- Loinard et al. (2008) Loinard, L., Torres, R. M., Mioduszewski, A. J., & Rodríguez, L. F. 2008, ApJ, 675, L29
- Luhman et al. (2003) Luhman, K. L., Stauffer, J. R., Muench, A. A., Rieke, G. H., Lada, E. A., Bouvier, J., & Lada, C. J. 2003, ApJ, 593, 1093
- Massi et al. (2008) Massi, M., et al. 2008, A&A, 480, 489
- Massi et al. (2006) Massi, M., Forbrich, J., Menten, K. M., Torricelli-Ciamponi, G., Neidhöfer, J., Leurini, S. & Bertoldi, F. 2006, A&A, 453, 959
- Mazeh et al. (2002) Mazeh, T., Prato, L., Simon, M., Goldberg, E., Norman, D., & Zucker, S. 2002, ApJ, 564, 1007
- McLean et al. (2000) McLean, I. S., Graham, J. R., Becklin, E. E., Figer, D. F., Larkin, J. E., Levenson, N. A., & Teplitz, H. I. 2000, Proc. SPIE, 4008, 1048
- McLean et al. (1998) McLean, I. S., et al. 1998, Proc. SPIE, 3354, 566
- Meibom et al. (2007) Meibom, S., Mathieu, R. D., & Stassun, K. G. 2007, ApJ, 665, 155
- Mioduszewski & Kogan (2009) Mioduszewski, A. J. & Kogan, L. 2009, Strategy for Removing Tropospheric and Clock Errors using DELZN Version 2.0 (AIPS memo 110; Socorro, NM: NRAO)
- Napier (1995) Napier, P. J. 1995, in ASP Conf. Ser. 82, Very Long Baseline Interferometry and the VLBA, ed. J. A. Zensus, P. J. Diamond, & P. J. Napier, (San Francisco, CA: ASP), 59
- Napier et al. (1994) Napier, P. J., Bagri, D. S., Clark, B. G., Rogers, A. E. E., Romney, J. D., Thompson, A. R., & Walker, R. C. 1994, IEEE Proceedings, 82, 658
- Nguyen et al. (2009) Nguyen, D. C., Jayawardhana, R., van Kerkwijk, M. H., Brandeker, A., Scholz, A. & Damjanov, I. 2009, ApJ, 695, 1648
- O’Donnell (1994) O’Donnell, J. E. 1994, ApJ, 422, 158
- O’Neal et al. (1990) O’Neal, D., Feigelson, E. D., Mathieu, R. D., & Myers, P. C. 1990, AJ, 100, 1610
- Phillips et al. (1991) Phillips, R. B., Lonsdale, C. J., & Feigelson, E. D. 1991, ApJ, 382, 261
- Prato (1998) Prato, L. A. 1998, PhD Thesis, State University of New York at Stony Brook
- Prato et al. (2003) Prato, L., Greene, T. P., & Simon, M. 2003, ApJ, 584, 853
- Prato et al. (2002) Prato, L., Simon, M., Mazeh, T., McLean, I. S., Norman, D., & Zucker, S. 2002, ApJ, 569, 863
- Rosero et al. (2011) Rosero, V., Prato, L., Wasserman, L. H., & Rodgers, B. 2011, AJ, 141, 13
- Rousselot et al. (2000) Rousselot, P., Lidman, C., Cuby, J.-G., Moreels, G., & Monnet, G. 2000, A&A, 354, 1134
- Schaefer et al. (2006) Schaefer, G. H., Simon, M., Beck, T. L., Nelan, E., & Prato, L. 2006, AJ, 132, 2618
- Schaefer et al. (2003) Schaefer, G. H., Simon, M., Nelan, E., & Holfeltz, S. T. 2003, AJ, 126, 1971
- Schaefer et al. (2008) Schaefer, G. H., Simon, M., Prato, L., & Barman, T. 2008, AJ, 135, 1659
- Schlieder et al. (2012) Schlieder, J. E., Lépine, S., Rice, E., Simon, M., Fielding, D., & Tomasino, R. 2012, AJ, 143, 114
- Shepherd (1997) Shepherd, M. C. 1997, in ASP Conf. Ser. 125, Astronomical Data Analysis Software and Systems VI, ed. G. Hunt & H. Payne, (San Francisco, CA: ASP), 77
- Siess et al. (2000) Siess, L., Dufour, E., & Forestini, M. 2000, A&A, 358, 593
- Simon et al. (1996) Simon, M., Holfeltz, S. T., & Taff, L. G. 1996, ApJ, 469, 890
- Simon & Prato (2004) Simon, M. & Prato, L. 2004, ApJ, 613, 69
- Simon et al. (1995) Simon, M., et al. 1995, ApJ, 443, 625
- Skinner (1993) Skinner, S. L. 1993, ApJ, 408, 660
- Stassun & Terndrup (2003) Stassun, K. G., & Terndrup, D. 2003, PASP, 115, 505
- Steffen et al. (2001) Steffen, A. T., et al. 2001, AJ, 122, 997
- Tognelli et al. (2011) Tognelli, E., Prada Moroni, P. G., & Degl’Innocenti, S. 2011, A&A, 533, 109
- Torres et al. (2012) Torres, R. M., Loinard, L., Mioduszewski, A. J., Boden, A. F., Franco-Hernández, R., Vlemmings, W. H. T., & Rodríguez, L. F. 2012, ApJ, 747, 18
- Torres et al. (2007) Torres, R. M., Loinard, L., Mioduszewski, A. J., & Rodríguez, L. F. 2007, ApJ, 671, 1813
- Torres et al. (2009) Torres, R. M., Loinard, L., Mioduszewski, A. J., & Rodríguez, L. F. 2009, ApJ, 698, 242
- van Moorsel et al. (1996) van Moorsel, G., Kemball, A., & Greisen, E. 1996, in ASP Conf. Ser. 101, Astronomical Data Analysis Software and Systems V, ed. G. H. Jacoby & J. Barnes, (San Francisco, CA: ASP), 37
- White & Ghez (2001) White, R. J., & Ghez, A. M. 2001, ApJ, 556, 265
- White et al. (1992) White, S. M., Pallavicini, R., & Kundu, M. R. 1992, A&A, 259, 149
- Wizinowich et al. (2000) Wizinowich, P. L., Acton, D. S., Lai, O., Gathright, J., Lupton, W., & Stomski, P. J. 2000, Proc. SPIE, 4007, 2
- Yelda et al. (2010) Yelda, S., Lu, J. R., Ghez, A. M., Clarkson, W., Anderson, J., Do, T., & Matthews, K. 2010, ApJ, 725, 331
| Date | Filter | AO Rate | Tint | No. | No. |
|---|---|---|---|---|---|
| (Hz) | (s) | Co-add | Im. | ||
| 2006 Dec 18 | Jcont | 492 | 1.00 | 10 | 10 |
| Hcont | 492 | 0.60 | 10 | 10 | |
| Kcont | 492 | 0.50 | 10 | 10 | |
| 2008 Jan 17 | Hcont | 438 | 0.40 | 10 | 20 |
| Kcont | 438 | 0.40 | 10 | 20 | |
| L′ | 438 | 0.05 | 10 | 10 | |
| 2008 Dec 17 | Hcont | 438 | 0.30 | 10 | 10 |
| Kcont | 438 | 0.30 | 10 | 10 | |
| 2009 Oct 25 | Hcont | 438 | 0.18 | 10 | 12 |
| Kcont | 438 | 0.18 | 10 | 12 | |
| 2011 Jan 24 | Hcont | 438 | 0.50 | 10 | 12 |
| Kcont | 438 | 0.50 | 10 | 12 | |
| 2011 Oct 12 | Hcont | 438 | 0.18 | 10 | 24 |
| Kcont | 438 | 0.18 | 10 | 6 | |
| Kcont | 438 | 0.30 | 10 | 12 |
| Year | (mas) | P.A.() | Ref |
|---|---|---|---|
| V807 Tau ABa | |||
| 1999.7558 | 282.91 2.10 | 324.31 0.43 | 1 |
| 2000.6565 | 286.86 1.80 | 323.56 0.36 | 1 |
| 2000.6786 | 284.88 2.70 | 323.60 0.54 | 1 |
| 2001.0006 | 287.00 1.80 | 322.83 0.36 | 1 |
| 2001.1721 | 286.23 0.91 | 322.12 0.18 | 1 |
| 2002.1829 | 285.57 0.61 | 320.34 0.12 | 1 |
| 2002.8293 | 282.71 0.34 | 318.90 0.07 | 1 |
| 2002.9750 | 281.40 1.50 | 319.25 0.31 | 1 |
| 2002.9852 | 281.82 1.10 | 319.60 0.22 | 1 |
| 2003.8539 | 271.57 1.01 | 317.33 0.21 | 1 |
| 2003.9766 | 273.21 1.00 | 316.96 0.21 | 1 |
| 2005.1644 | 268.90 1.00 | 312.69 0.22 | 1 |
| 2005.5989 | 260.51 0.70 | 310.92 0.15 | 1 |
| 2005.9317 | 259.77 0.31 | 309.30 0.07 | 1 |
| 2006.9633 | 248.55 0.47 | 305.51 0.11 | 2 |
| 2008.0447 | 234.61 0.28 | 301.43 0.07 | 2 |
| 2008.9621 | 221.22 0.25 | 298.08 0.07 | 2 |
| 2009.8167 | 208.08 0.45 | 295.23 0.12 | 2 |
| 2011.0644 | 190.50 0.39 | 292.97 0.12 | 2 |
| 2011.7797 | 183.43 0.77 | 292.59 0.24 | 2 |
| V807 Tau ABb | |||
| 1999.7558 | 305.00 4.40 | 321.29 0.83 | 1 |
| 2000.6565 | 284.59 4.10 | 316.81 0.83 | 1 |
| 2000.6786 | 285.22 4.60 | 317.56 0.92 | 1 |
| 2001.0006 | 282.86 4.20 | 315.60 0.85 | 1 |
| 2001.1721 | 279.36 3.60 | 314.66 0.74 | 1 |
| 2002.1829 | 259.74 0.93 | 313.81 0.20 | 1 |
| 2002.8293 | 249.13 0.51 | 312.57 0.12 | 1 |
| 2002.9750 | 247.05 2.20 | 312.80 0.51 | 1 |
| 2002.9852 | 248.86 2.40 | 313.14 0.55 | 1 |
| 2003.8539 | 227.53 2.40 | 312.98 0.60 | 1 |
| 2003.9766 | 228.83 2.40 | 313.58 0.60 | 1 |
| 2005.1644 | 220.81 1.26 | 311.63 0.33 | 1 |
| 2005.5989 | 214.79 1.30 | 311.32 0.35 | 1 |
| 2005.9317 | 215.27 0.46 | 310.55 0.12 | 1 |
| 2006.9633 | 209.75 0.65 | 309.69 0.18 | 2 |
| 2008.0447 | 207.72 0.37 | 308.48 0.10 | 2 |
| 2008.9621 | 208.03 0.31 | 306.87 0.08 | 2 |
| 2009.8167 | 209.40 0.72 | 304.15 0.20 | 2 |
| 2011.0644 | 210.75 0.81 | 298.07 0.22 | 2 |
| 2011.7797 | 208.02 1.13 | 293.02 0.31 | 2 |
| V807 Tau BaBb | |||
| 1999.7558 | 26.97 4.88 | 287.78 10.37 | 1 |
| 2000.6565 | 33.72 4.48 | 226.32 7.61 | 1 |
| 2000.6786 | 30.01 5.33 | 231.24 10.18 | 1 |
| 2001.0006 | 36.16 4.57 | 222.65 7.24 | 1 |
| 2001.1721 | 37.42 3.71 | 217.83 5.68 | 1 |
| 2002.1829 | 40.38 1.36 | 187.39 1.93 | 1 |
| 2002.8293 | 44.55 0.34 | 176.91 0.44 | 1 |
| 2002.9750 | 45.40 2.66 | 176.98 3.36 | 1 |
| 2002.9852 | 44.46 2.64 | 178.63 3.40 | 1 |
| 2003.8539 | 47.90 2.60 | 158.42 3.11 | 1 |
| 2003.9766 | 46.78 2.60 | 153.75 3.18 | 1 |
| 2004.9814 | 47.80 1.72 | 138.71 2.06 | 1 |
| 2005.1644 | 48.28 1.46 | 137.54 1.73 | 1 |
| 2005.5989 | 45.76 1.48 | 129.03 1.85 | 1 |
| 2005.9317 | 44.80 0.47 | 123.28 0.61 | 1 |
| 2006.9633 | 42.22 0.49 | 104.29 0.67 | 2 |
| 2008.0447 | 38.22 0.36 | 79.57 0.54 | 2 |
| 2008.9621 | 35.42 0.41 | 54.28 0.67 | 2 |
| 2009.8167 | 32.47 0.41 | 27.38 0.73 | 2 |
| 2011.0644 | 26.99 0.51 | 336.96 1.08 | 2 |
| 2011.7797 | 24.64 0.52 | 296.16 1.22 | 2 |
Note. — References: (1) Schaefer et al. 2006; (2) This paper.
| Date | Filter | Ba/A | Bb/A | Bb/Ba |
|---|---|---|---|---|
| 2002/03/08 | H | 0.388 0.017 | 0.279 0.008 | 0.720 0.043 |
| 2002/03/08 | K′ | 0.399 0.011 | 0.276 0.008 | 0.692 0.026 |
| 2002/10/30 | H | 0.381 0.016 | 0.266 0.010 | 0.698 0.010 |
| 2002/10/30 | K′ | 0.322 0.010 | 0.233 0.008 | 0.723 0.008 |
| 2004/12/24 | H | 0.710 0.048 | 0.556 0.031 | 0.784 0.045 |
| 2004/12/24 | K′ | 0.606 0.053 | 0.452 0.024 | 0.748 0.043 |
| 2005/03/01 | Hcont | 0.393 0.009 | 0.271 0.008 | 0.689 0.032 |
| 2005/03/01 | Kcont | 0.308 0.012 | 0.224 0.013 | 0.731 0.074 |
| 2005/12/06 | H | 0.388 0.003 | 0.284 0.003 | 0.731 0.008 |
| 2005/12/06 | K′ | 0.326 0.008 | 0.240 0.007 | 0.736 0.004 |
| 2006/12/18 | Jcont | 0.367 0.010 | 0.277 0.009 | 0.757 0.037 |
| 2006/12/18 | Hcont | 0.363 0.007 | 0.256 0.007 | 0.706 0.027 |
| 2006/12/18 | Kcont | 0.295 0.005 | 0.223 0.003 | 0.758 0.019 |
| 2008/01/17 | Hcont | 0.371 0.006 | 0.252 0.004 | 0.678 0.007 |
| 2008/01/17 | Kcont | 0.291 0.003 | 0.212 0.003 | 0.729 0.008 |
| 2008/01/17 | L′ | 0.194 0.027 | 0.109 0.024 | 0.593 0.230 |
| 2008/12/17 | Hcont | 0.360 0.005 | 0.243 0.004 | 0.675 0.009 |
| 2008/12/17 | Kcont | 0.282 0.002 | 0.199 0.002 | 0.707 0.012 |
| 2009/10/25 | Hcont | 0.396 0.004 | 0.282 0.003 | 0.711 0.009 |
| 2009/10/25 | Kcont | 0.307 0.009 | 0.230 0.008 | 0.749 0.048 |
| 2011/01/24 | Hcont | 0.401 0.006 | 0.265 0.006 | 0.660 0.023 |
| 2011/01/24 | Kcont | 0.342 0.007 | 0.219 0.008 | 0.642 0.037 |
| 2011/10/12 | Hcont | 0.387 0.004 | 0.273 0.004 | 0.705 0.011 |
| 2011/10/12 | Kcont | 0.312 0.020 | 0.204 0.022 | 0.660 0.111 |
| Weighted Mean | V | 0.1336 0.0035 | 0.0635 0.0026 | 0.4688 0.0221 |
| Weighted Mean | J | 0.3666 0.0105 | 0.2773 0.0092 | 0.7572 0.0373 |
| Weighted Mean | H | 0.3849 0.0016 | 0.2713 0.0014 | 0.6995 0.0034 |
| Weighted Mean | K | 0.2956 0.0016 | 0.2146 0.0013 | 0.7313 0.0028 |
| Weigthed Mean | L | 0.194 0.027 | 0.109 0.024 | 0.593 0.230 |
| Component | V | J | H | K | L | ref |
|---|---|---|---|---|---|---|
| V807 Tau | 11.185 0.114 | 8.146 0.023 | 7.357 0.026 | 6.960 0.016 | … | 1,2 |
| V807 Tau A | 11.56 0.02 | … | … | 7.36 0.05 | 6.54 0.14 | 3 |
| V807 Tau B | 13.35 0.04 | … | … | 8.21 0.10 | 7.94 0.14 | 3 |
| V807 Tau A | 11.380 0.114 | 8.686 0.025 | 7.905 0.026 | 7.408 0.016 | … | 4 |
| V807 Tau A | 11.400 0.390 | … | … | … | … | 5 |
| V807 Tau Ba | 13.566 0.117 | 9.775 0.034 | 8.941 0.026 | 8.731 0.017 | … | 4 |
| V807 Tau Ba | 13.767 0.043 | … | … | 8.806 0.100 | 8.445 0.220 | 6 |
| V807 Tau Ba | 13.572 0.390 | … | … | … | … | 5 |
| V807 Tau Bb | 14.373 0.122 | 10.078 0.039 | 9.321 0.026 | 9.078 0.017 | … | 4 |
| V807 Tau Bb | 14.590 0.054 | … | … | 9.146 0.100 | 9.013 0.334 | 6 |
| V807 Tau Bb | 14.368 0.392 | … | … | … | … | 5 |
Note. — References: (1) Kharchenko et al. 2009 (-band); (2) Cutri et al. 2003 (2MASS , , ); (3) White & Ghez 2001 (, ); (4) Flux ratio (A:Ba:Bb) combined with Johnson V All-sky compiled Catalog (Kharchenko 2009) and 2MASS J, H, K; (5) Calibrated FGS; (6) Flux ratio (Ba:Bb) combined with White and Ghez (2001).
| UT Date | Phase | Sep (mas) | Spectra |
|---|---|---|---|
| 2001 Jan 8 | 0.15 | 33 | A, Ba, Bb |
| 2002 Jul 16 | 0.27 | 43 | blended, non-AO |
| 2002 Dec 14 | 0.31 | 45 | blended, non-AO |
| 2003 Dec 13 | 0.39 | 47 | A, Ba, Bb |
| 2006 Dec 14 | 0.63 | 42 | A, Ba+Bb |
| 2009 Dec 6 | 0.88 | 32 | Ba+Bb |
| 2010 Dec 12 | 0.96 | 28 | A, Ba+Bb |
| V807 Tau A | V807 Tau Ba | V807 Tau Bb | ||||||
|---|---|---|---|---|---|---|---|---|
| UT Date | JD - 2,400,000 | SpT | SpT | SpT | ||||
| (km s-1) | (km s-1) | (km s-1) | km s-1 | |||||
| 2001 Jan 8 | 51917.8472 | K7 | 15 | M2 | M2 | |||
| 2002 Jul 16 | 52472.1403 | K7 | 15 | |||||
| 2002 Dec 14 | 52622.8764 | K7 | 15 | |||||
| 2003 Dec 13 | 52986.8697 | K7 | 15 | M2 | M2.5 | |||
| 2006 Dec 14 | 54083.9033 | K7 | 15 | |||||
| 2010 Dec 12 | 55542.8255 | K7 | 15 | |||||
| Average | 15 | |||||||
| Date | Comp | RA | DEC | Major | Minor | PA | |
|---|---|---|---|---|---|---|---|
| (hh:mm:ss) | (dd:mm:ss) | (mJy) | (mas) | (mas) | (∘) | ||
| 2007 Mar 10 | Ba | 04 33 06.6247856 | 24 09 54.989774 | 0.52 0.10 | 2.27 0.29 | 1.18 0.15 | 8.3 7.4 |
| 2008 Mar 19 | Ba | 04 33 06.6255328 | 24 09 54.953108 | 0.59 0.13 | 2.11 0.34 | 1.88 0.30 | 48 58 |
| 2008 Mar 19 | Bb | 04 33 06.6281980 | 24 09 54.962855 | 1.07 0.09 | 1.90 0.09 | 1.08 0.05 | 178.5 3.3 |
| 2008 Jun 04 | 0.22 | ||||||
| 2008 Aug 28 | Ba | 04 33 06.6270069 | 24 09 54.939863 | 8.60 0.27 | 1.86 0.03 | 1.00 0.02 | 164.2 1.1 |
| 2008 Dec 10 | 0.27 | ||||||
| 2009 Mar 06 | 0.26 |
| Parameter | Value |
|---|---|
| (yrs) | 12.312 0.058 |
| 1999.154 0.070 | |
| 0.2922 0.0033 | |
| (mas) | 38.59 0.16 |
| (∘) | 151.59 0.89 |
| (∘) | 1.8 1.6 |
| (∘) | 50.6 1.3 |
| 15.49 | |
| 0.443 | |
| 1.040 0.016 | |
| 0.843 0.050 | |
| 0.564 0.018 | |
| 0.476 0.017 |
Note. — The uncertainty in the masses represent the errors computed from the orbit fit; the systematic uncertainty in the distance is reflected by the additional scaling factor of . The uncertainty in the average distance to the Taurus star forming region ( 10 pc; Kenyon et al., 1994) could shift the masses by as much as 0.24 M⊙.
| Star | SpT | ( | ||||
|---|---|---|---|---|---|---|
| (K) | (mag) | (mas) | ( erg/cm2/s) | (L⊙) | ||
| V807 Tau A | K7 | 4060 | 0.03 0.42 | 0.14 0.03 | 1.72 0.32 | 1.05 0.20 |
| V807 Tau Ba | M2 | 3560 | 0.61 0.50 | 0.12 0.01 | 0.732 0.094 | 0.447 0.058 |
| V807 Tau Bb | M2M2.5 | 3560 | 1.18 0.47 | 0.11 0.01 | 0.483 0.063 | 0.356 0.038 |
Note. — The uncertainty in the distance ( 10 pc) contributes an additional systematic uncertainty of 0.16, 0.066, and 0.053 L⊙ to the luminosities of A, Ba, and Bb, respectively.