Scalable design of an IMS cross-flow micro-generator/ion detector
Abstract
Ion-mobility spectrometry (IMS) is an analytical technique used to separate and identify ionized gas molecules based on their mobility in a carrier buffer gas. Such methods come in a large variety of versions that currently allow ion identification at and above the millimeter scale. Here, we present a design for a cross-flow-IMS method able to generate and detect ions at the sub-millimeter scale. We propose a novel ion focusing strategy and tested it in a prototype device using Nitrogen as a sample gas, and also with simulations using four different sample gases. By introducing an original lobular ion generation localized to a few ten of microns and substantially simplifying the design, our device is able to keep constant laminar flow conditions for high flow rates. In this way, it avoids the turbulences in the gas flow, which would occur in other ion-focusing cross-flow methods limiting their performance at the sub-millimeter scale. Scalability of the proposed design can contribute to improve resolving power and resolution of currently available cross-flow methods.
pacs:
41.75.-i, 42.82.Cr, 52.80.Hc, 85.40.-eIMS design, gases detectors, cross-flow, micro-devices
1 Introduction
Ion-mobility spectrometry (IMS) is a well established analytical technique used to separate and identify ionized molecules in the gas phase of a volatile compound. This technique is based on the molecules’ mobility in a carrier buffer gas. The ions acquire a drift velocity through their mobility due to interactions with an electric field of magnitude . To the lowest order, drift velocity is
| (1) |
with the ion mobility, which allows us to identify the compound. A dependence of with thermal fluctuation, electrical charge, gas density and collision cross-section, can be obtained from the balance between mobility and diffusion forces during an elastic collision of the ionized molecule against a neutral molecule[1, 2]
Traditional devices for time-of-flight IMS[3] come in a wide range of sizes (often tailored for a specific application) and are capable of operating under a broad range of conditions[4] above the millimeters scale[5]. These devices use a ion impulse field that is parallel to the flow of the carrier gas[3]. In contrast, aspiration condenser IMS also known as cross-flow methods [6, 7] use an impulse field that is transverse to the flow of the carrier gas. A transverse impulse field allows splitting of a stream of ions within the flow of the carrier buffer gas, according to the respective mobility of ions[8]. Two main movement vectors are obtained: one in the flow’s direction and the other perpendicular to it. Devices that apply this method are remarkably compact and relatively easy to manufacture using micro-system technology.
There are many methods of cross flow combined with pattern recognition and also mass-spectrometry for ion identification[2, 9, 10]. One problem with these method is the low resolving-power due to overlapping of ions on detectors caused by diffusion and space charge effects. Such effects can be reduced by increasing the flow rate as long as laminar flow conditions remain the same. A swept-field aspiration condenser IMS uses a variable electric drift field to move all ion species across a single detector electrode[11]. A variable deflection voltage applied to a single detector electrode can replace a detector made by an array of electrodes. An ion mobility distribution is obtained by applying the discrete inverse Tammet transformation to data. However, reconstruction of the ion mobility distribution is difficult when the signal to measure is comparable to the noise and, therefore, identification possibilities of the actual signal are reduced.
A radioactive ionization source is commonly used to produce ions. However, in this way, ions completely cover the entrance to the detection zone difficulting their identification. To increase identification capabilities, some ion-focusing methods proposed[12, 13] the use of funnels to guide ions before the splitting caused by the transverse impulse field. Basically, ion focusing creates a concentrated starting point for ions to start to travel forming a well-defined trajectory for each compound and allowing to improve ion identification. Ions with different mobility will have different trajectories[12]. It has been utterly expensive and complex to apply this kind of solution so far, because of the inconveniences existing at the sub-millimeter scale. In the ion-focusing aspiration condenser IMS, funnels or intricate channels are implemented to narrow down the flow inside the system[12, 13], thus generating potential turbulences which do not allow the ions to continue their travel. This results in a loss of identification efficiency[14] when both high flow rates and a laminar condition are necessary.
Here, we present novel concepts for a different approach to produce ion focusing without any physical object acting as a funnel.
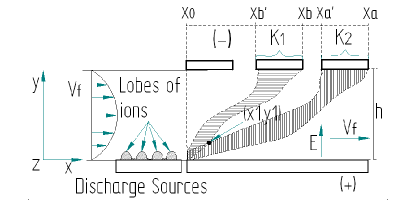
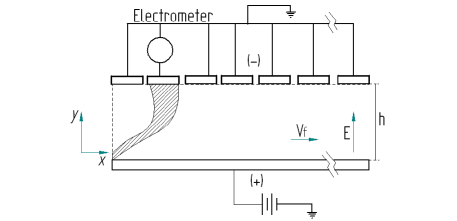
As illustrated in Fig.1, ions with mobility and , where starting at the same initial location near to generated lobes of ions and defined by a stream of ions with lower position and higher position travel towards the detection area forming two stream. One stream reaches the detection area that starts in with length for ions with mobility. The other stream reaches and area that starts in with length for ions with mobility. None of the ion streams will overlap on detectors, and the required separability will be verified as long as the trajectory of ions with larger mobility (and moving on the lowest side of the ion stream) and the trajectory of ions with smaller mobility (moving on the higher side of the ion stream) will meet at a point with , being the channel height.
The present work is organized as follows. Section 2 presents basic equations describing the proposed model. Section 3 describes the integrated prototype that we designed containing the two main parts for ion-generation and ion-detector. Section 4 summarizes results for witness of corona discharge regime of the proposed ion-generation. Section 5 describe how to deal with the transport of micro-generated ions from their origin to detection. Section 6 presents analysis of the experimental prototype setup to generate localized ions or lobes of ions. This section also presents a numerical simulation about the resolving power and resolution to show the advantages of our proposed device. Finally, Section 7 includes our main conclusions.
2 Theory
The hypothesis based on a localized ion generation and laminar flow means that the access of generated ion to the detection zone is very small, with height . For a constant carrier flow in the detection zone, two orthogonal components exist in ion movements: the constant flow velocity and the drift velocity Eq.(1). Therefore, considering that an ion from uses the same time to arrive to the detector in for each direction of movements, we obtain:
| (2) |
where the drift field can be estimated by , assuming border effects are negligible and electric voltage , applied on the detectors, generates a uniform field in the detection zone. Having defined a desired meeting point for those trajectories in the plane in Fig. 1 and assuming uniform velocities as in Eq.(2), we can estimate
| (3) |
Being voltage and flow velocity the same for both molecules we propose that separability will be guaranteed provided that . Therefore, in the case we find an upper bound for the ion-focusing size
| (4) |
needed to separate two ionized molecules according to their mobility and the channel height. Our main hypothesis centers on ion-focusing being possible via the geometric design of the ion-generator. Eq.(4) provides an upper bound for the scaling of this focalization with the detection size of the device allowing identification of the species. This requirement to scale the system prompted us to use micro-system technology. The originality of the present research lays in the solution reached.
3 Description of the proposed micro-device
The device was designed considering both the position and direction of mobility vectors of ions, from the generation and transportation of ion up to their detection. This design was possible by arranging the respective directions of electric discharges, fluid transportation, and the electric fields used for detection, orthogonally to each other. In this way, we minimized influences among the ion movements in these directions. By employing a virtual model of the micro-device using the CoventorWare software [15] we constructed the design shown in Fig. 2. This software allows us to simulate the construction of the model; from the optic layers to the manufacturing process[18]. With lift off, the design proceeds; a positive photo-resin is deposited on a glass substrate and protected with a plastic cover, containing the image of the target structure. The resin is modified by UV light in unprotected places, and unmodified part of the resin can be removed with the cover as well. The remaining construct is completely covered with a layer of copper using an anionic deposition process [17]. Finally, the resin layer is removed with Acetone, leaving the geometry of the copper layer on the substrate. This manufacturing process has been used because of its flexibility and sturdiness. Also, one goal of this work is obtaining a minimum size compact ion-generation/ion-detector, with low cost and simple manufacture.
The proposed micro-device has two main zones (see Fig. 2); the ionization and the detection zone. In the ionization zone, lobes of ions are generated by employing an electric discharge of corona type (see Section 4 for details). Charged particles of the sample are transported via a carrier gas to the detection zone. When entering the first zone, both the carrier gas and the sample move along the two guide through the device towards the ionization zone. The guides determine the separation distance between two substrates, only the inferior substrate is shown in Fig.2. The ionization zone consisting of six sources is mounted on the surface of this inferior substrate. Each source has seven pairs of flat, metallic electrodes, the two electrodes; placed in front of each other at 40m.
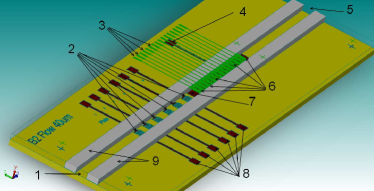
The anode has six triangular tips, at a distance of 300m from one another, and one flat cathode. The distance between two sources is 1500m and the last source is 540m away from the detection zone. These can be individually connected across the connection electrodes, Fig. 2 (2) and (8).
In the detection zone, the detectors are immersed in an electrostatic field that deflects and separates ions according to their mobility. This zone has a flat electrode with a single connection mounted on the inferior substrate. Individually connected and flat sectioned electrodes are mounted on the superior substrate. Each electrode is 900m long and at a distance separated 100m from the next electrode, as shown by (6) and (3) respectively in Fig.2. The total length of the channel is m but the maximum active zone is less than half of this length. Channel width is m and height is m. With these dimensions and an air stream of around m we estimate a flow in laminar regime due to 1000.
4 Ion micro-generation
The ion generation problem is solved using a localized production of a self-limited discharge. Electric discharges due to dielectric rupture can be produced via enough energy accumulation between two electrodes on which an electrostatic difference voltage is applied [20]. For our propose, the state before the beginning of luminescence, also known as the corona discharge, is just enough to ionize the sample. Therefore it is possible to develop the electric field and the electric voltage before the electric discharge by solving the Laplace equation in a volume defined by a closed surface. In a separate work[21], we study, if the empirical Peek’s law [22] that establishes the necessary electric voltage in the anode to witness a corona discharge can be applied at micro-scale. In summary, in these analysis, the electric field was calculated inside the ionization volume defined in Section 3 by solving the Laplace equations [29] for the configuration displayed in Fig. 3 e).
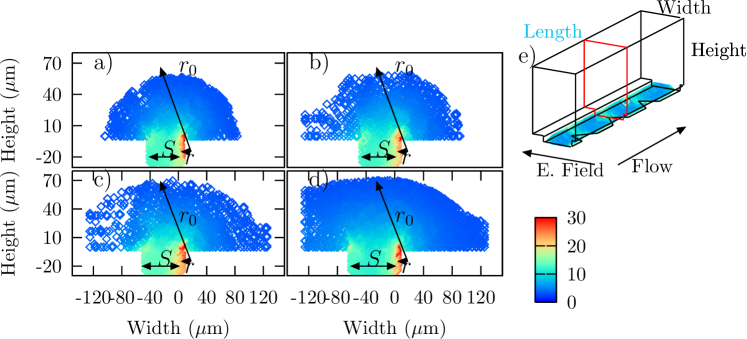
The left panel shows the magnitude of the electric field on a section of the ion generator volume that contain the tip of the central triangular anode. The voltage applied corresponds to critical values experimentally determined for Nitrogen gas, and V and and m, respectively, with constant curvature radius of the anode tip m. We found that it is possible to approximately establish a same average distance from the origin of the curvature radius to the surface defining a volume where 3 V/m. As Peek’s law is verified at the micrometer scale[21], this same average distance should be approximately equal to an effective radius , measuring the curvature radius in micrometers. This prediction becomes true with a 10% sampling error in every case.
5 Localized ions and cross-flow
The proposed alternative solutions for ion focusing using a corona discharge ion micro-generation are described in Sections 2, 3, and 4. Considering that Eq.(1) and cross-flow design concepts can only be applied in a non-turbulent regime, we analyzed how the fluid should travel along the channel. We propose a channel with a rectangular section that remains constant along both zones of the device, which means that there are no detours, expansions, or contractions along the entire flow. Considering this, first we verify the laminar flow condition by using the Reynold number that we estimate for non-circular sections as
| (5) |
in terms of the cinematic viscosity and the hydraulic radius corresponding to the ratio between the fluid normal section area and its perimeter, and as the channel width. The flow rate is implicit in the above equation, because it is estimated as the average velocity of flow multiplied by the section of the channel: .
For the objective of our proposed design, we made a significant size reduction for and . Therefore, we need to be low enough so that ensure laminar condition of the fluid regime. However, can not be too low, because the number of ions would be too small to be analyzed. Also, longitudinal dimensions of the channel have to be small enough so that the lifespan of generated ions is longer than time they take to arrive to the detection zone. All this together allows us to establish a higher ion velocity and a range for the dimensions of the device. Dimensions can be optimized to obtain a device efficiently functioning at the smallest possible scale [16].
The flow is generated by the pressure difference between the device entrance and exit, and , respectively. Velocity is modified by friction between the fluid and the walls due to glides of imaginary layers of fluids. Assuming the fluid is irrotational and incompressible and fits the device static conditions of the wall, we analyze its dependence on vertical direction, obtaining by force equilibrium
| (6) |
where is the channel length and is the height variation for the channel that goes from to as defined in Section 1.
In order to investigate the role of velocities profiles in a sub millimeter scale, we consider numeric simulation for the trajectory in a plane of ideals ions with the same mobility as Nitrogen when driven in direction acquiring a of Eq.(6) due to dyne / m2, m and dyne s/m2 and driven in direction acquiring given by Eq.(1) for m2/Vs due to a voltage difference of and between flat detector electrodes (anode and cathode) separated m. In Fig.4 trajectories are shown for two initial positions (0,0) and (0,50m) which represent limit cases due to localizing of ions as showed in Fig.1,

they are calculated for parabolic profile resulting a narrow laminar stream. We also show the trajectory for uniform profile and initial position (0,0). The trajectory with initial position (0,50m) is not shown, because being for the uniform profile it belongs to a parallel line separated 50m from the first one, defining a straight laminar stream.
Standard cross-flow method operates at a scale of ten of millimeters [11], where the change in the velocity profile due to viscosity effects is negligible. However, at a sub-millimeter scale viscosity effects must be taken into account. By neglecting the velocity depends on , errors in position detections as high as the channel height could be made, as shown in Fig.4. Note that, when duplicating the applied voltage, ions are detected at a distance that is half as long as the corresponding one for the voltage applied originally. This is due to inverse proportionality Eq.(2) between horizontal position of detection and voltage applied to the detector, that is here approximately verified when considering viscosity.
6 Results
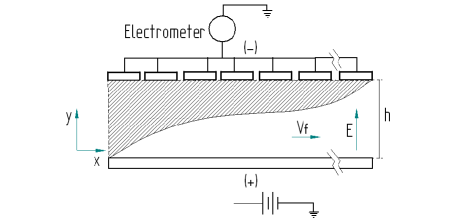
First, Nitrogen gas flows through the channel of the device, controlled by a regulator. Then, a pulse generator is connected to a DC source producing every s a pulse that lasts 50s. We analyzed the ion charges by serially connecting a LV 8 Keithley 6514 electrometer to the arrangement of detection cathodes, as illustrated in the upper panel of Fig.5. The accumulated charge is measured at 20s intervals.
The average is calculated over ten measures for each individual and all electrode. Data dispersion according to the average is lower than 3 %. Fig. 6 shows the charge normalized with
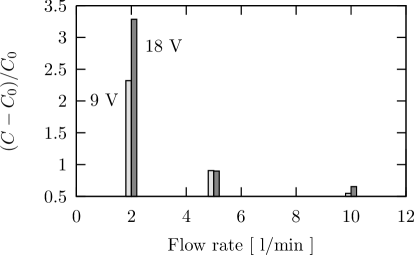
depending on the flow in the device and cases in which detection voltage is fixed at and . The reference charge results from the same experiment, but using Nitrogen streaming in opposite direction to ensures absence of ions. is needed because the electrometer is sensitive enough to capture spurious signals during the experiment, such as signals produced by generation of ions. Parameters established in these experiments are taken from the theoretical example analyzed in Section 5. Thus, the highest charge possible is obtained for a flow rate of 2. When increasing the flow rate to 5, the charge diminishes to more than half of the previous charge. Note that also the difference of with higher signal for is consistent with our theoretical model, since concentrating detection towards half of the length of the detection zone increases the probability to detect ions. In the context of an optimal design that considers the lifespan of ions, a better signal is obtained using rather than because ions at are detected in half of the time than ions at . With flow rates of 5 and 10 we expect a transition towards the turbulent regime. Because of the loss of laminar flow condition, as predicted in Section 5, no significant signal differences are expected for these flows at 9 or 18.
To verify if the generation of localized lobes of ion is enough to separate and identify ions, the electrometer has been connected in such a way to separately measure the signal of the charge at each detector (see lower panel in Fig.5). We normalized the signal with for a 2 flow rate and four different detection voltages, 9, 18, 28 and 46, respectively (see Fig.7).
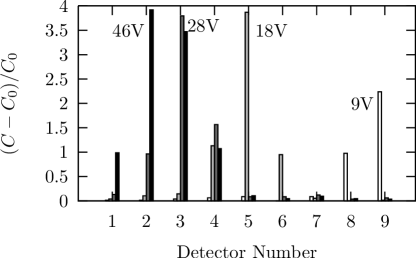
is obtained for each detection, by a neutral gas streaming in the opposite direction.
When comparing results in Fig.7 with results from the numeric simulation for detection voltages of 9 and 18 (Fig.4), and additionally considering the dimensions of detectors in the micro-device (see Section 3), we observe that the highest signal values are measured in those detectors placed at positions and distances predicted by simulation. According to Eq.(2), there is an inverse relationship between detection positions and applied voltages. This means that by increasing the applied voltage two-, three-, and five-fold (from 9V to 18, 28, and 46V, respectively) the highest signal is measured by the detector positioned at half, one third, and one fifth of the total distance, respectively, as predicted by simulations.
This prediction is highly accurate in an ideal case of uniform profile. In the most realistic case, a small correction is necessary, because collection distance predictions are higher than inferred by Eq.(2) (see Section 5, discussion in the last paragraph). A correct focalization by local ion micro-generation during our experiments was crucial to experimentally verify the model.
The proposed experimental configuration allows us to determine an ionization volume with a diameter corresponding to as little as 10 of the channel height (see analysis in Section 4). Higher ion localizing is possible by repeating analysis of Section 4 and shrinking the curvature radius of the ion generator.
With respect to separation based on ion mobility, we could state that the performed experiments involving four voltages and one compound could ideally be translated into an experiment involving one voltage and four compounds. This is possible because channel height is constant, and is approximated to in Eq.(1), which means that drift velocity depends only on the product of mobilities and the applied electric voltages. Therefore, to translate results from Fig.7 into the problem of separation by mobility, means to consider changes in which the compounds’ mobilities would duplicate, triplicate, and quintupling. However, expected changes in mobility among different compounds are usually small. For example, there is a difference of 24 between the mobility of Toluene (m2/Vs) and that of Nitrogen, but for many other compounds such differences are actually much smaller.
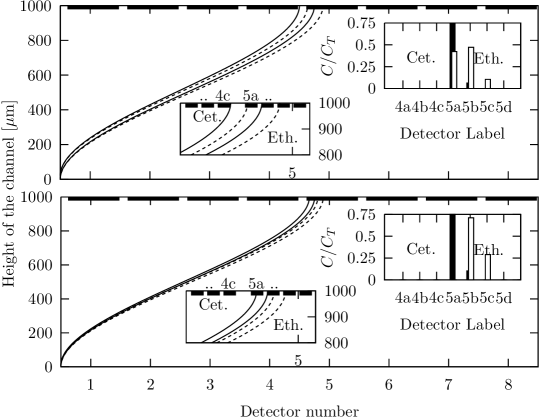
Fig.8 shows numeric simulation of the ion trajectory using a voltage of 18 and a carrier flow rate of 2.
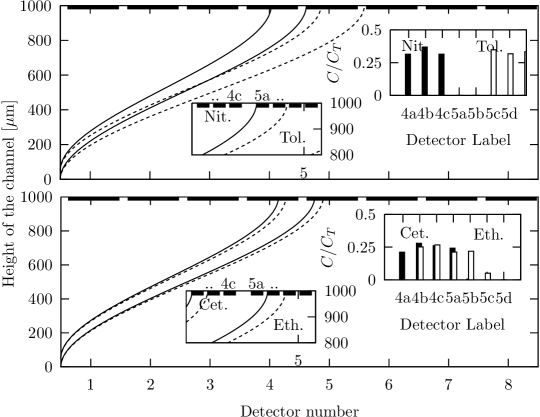
Our design was able to separate signals corresponding to Nitrogen and Toluene because these were not overlapping as it is shown in the insets of upper panel Fig. 8. The insets show details of positions where ions impact and normalized charge respect to the total charge that reach detectors. Detector are segmented and it is represented in Fig. 8 with alphanumeric labels on each subdivision. According to our analysis in Section 5 and employing Eq.(2), we can estimate that, for 18, an increase of mobility of 24 would be equivalent to an average displacement of an ion current from the middle part of the fifth detector to the left by 870m. Because this distance is slightly bigger than the diameter of any ion stream reaching that position, ion streams both before and after displacement should not overlap, thus detecting two distinct signals. This result is consistent with our prediction about scaling between the ion current diameter at the entrance of the detection zone and the channel height (see Section 2). In our design, 0.1, and we verify Eq.(4) for Toluene and Nitrogen. In contrast, our design was not able to separate the overlapping signals of Acetone and Ethanol, as shown at the lower panel of Fig.8, because the respective mobilities are only slightly different from one another (3.4 difference). Thus, in according to Eq.(4), to separate Acetone from Ethanol, should be less than 0.034, that is not verified with the actual size of the designed device.
The main advantage of this proposed device is its scalability that ultimately depends on the required application. Scalability can be tested by applying Eq.(4) for Ethanol and Acetone which predicts that for channel height m an upper bound m is required for the initial diameter of the ion stream. It is possible to separate signals of Acetone and Ethanol by reducing the size of our proposed device by an order of magnitude, since localization would then be smaller than the predicted upper bound (see Fig.8).
The ideal trajectories of ion streams corresponding to Acetone and Ethanol in scaled conditions with detection voltage 180 V, and localization of ion generation smaller than 30m, in order that , are shown in Fig.9. The other parameters match those of the experimental device.
With the proposed device the charge signal are not transformed to average time of ion detection as it was done with other ion-focusing method[13, 14], although the implicit ion-focusing proposed in this work could also be adapted to be applied a Tammet trasformation[11]. A similar physical interpretation of resolving power might be followed by defining as the ratio of average trajectory position to the trajectory dispersion. Note that with this definition does not consider the finite size of detector. Furthermore, we are idealizing the fact that enough charge would be detected in such cases[12]. Accordingly, the resolution to separate two signals is defined as the ratio of the difference between the two average trajectory position to the larger of trajectory dispersion of both. and for our device to separate signals of Acetone and Ethanol was obtained from as it is shown in the inset of Figs. 8 and 9 by simulations of ion trajectories using a parabolic profile of velocity drift with random initial height of ions starting up to focalization length. In Fig.10 we show for 500, 1000, 1500m and some comparative cases of , the and as function of .

We can see that is comparable with another ion focusing method[14] for m and . However, to be able to separate Acetone and Ethanol from a mixture of the two compounds both a higher resolving power and an increased focusing are required. Note in the inset of Fig.10 that for m and m, and compounds can not be totally separated as it is shown in upper panel of Fig.9, while for m and m, and compounds are well separated as it is shown in the lower panel of of Fig.9. Larger imposes a challenge for flow laminar condition. The device that we designed would be able to meet these requirements, because it does not need any physical object that could change fluids dynamics, as in currently available cross-flow methods.
7 Conclusions
In this work we address the problem to identify ion species at the sub-millimeter scale based on their mobility and a standard cross-flow method. To solve this problem, we propose a novel manufacturing method using micro-system technology. We analyze the corona discharge and verify Peek’s law in the micro-scale. With this, we dimensioned the geometry for the proposed ion generator allowing it to localize the ion generation and, therefore, implicitly focus ions to the entrance of the detection zone, in a smaller size than the drift height. At the same time, we analyzed the flow of the system to design transportation of ions from their generation point to their detection point. By introducing orthogonal movements we made numerical simulations to analyze viscosity effects and state experimental configuration to guarantee the laminar flow condition. We found a simplified design for the construction of the micro-system, which avoids expansions or contractions. In this way, turbulence and stopped-flow zones are minimized in an adequate flow range, allowing us to optimize the functioning of the device. We performed experiments on a prototype of the proposed design to verify our hypothesis on localized ion generation as a solution for ion species identification at sub-millimeter scale. Variation of the average trajectory of the ion stream with the variation of drift velocity can be analyzed with a parabolic velocity profile. We showed that for a case in which variations of drift velocity are 25 the charge signals displayed a negligible overlapping of 1mm on the detection zone. For smaller differences in other volatile compounds we would need to adjust the parameters used here (as these depend on the application of the device), but not the architecture of the design. We have proposed an upper bound for the size of the ion lobes in terms of the total drift height and the ratio of ion mobilities to effectively separate ion specie. Finally, we highlight how our design is elegantly simplified compared to more complex solutions in other methods [13, 14]. We obtained a compact micro-model that has two advantages: it does not use radioactive sources to generate ions, but an electrical source not exceeding 1kV, and it would reach a higher resolving power than currently available methods.
Acknowledgments
This study was partially supported by ANPCyT-FONCyT (grants PICT-PRH-135-2008, PICTO-UNNE-190-2007, PAE 22594/2004 nodo NEA:23016, and PAE-PAV 22592/2004 nodo CAC:23831). We thank Jessica Lasorsa and Brigitte Marazzi for useful comments.
References
References
- [1] H.E. Revercomb and E.A. Mason. Theory of plasma chromatography/gaseous electrophoresis- a review. Anal. Chem. 1975, 47:970.
- [2] Ortiz GP, Rinaldi C, Boggio N, Vorobioff J, Ortiz J, Gómez S, et al. Development of an IMS Type Device for Volatile Organic Compounds Detection: Simulation and Comparison of the Ion Distributions. Physics.Ins-De [internet]. 2009 Mar 29 [2012 Jan 10];0902.1206v2. Available from http://arxiv.org/abs/0902.1206.
- [3] Eiceman GA and Karpas Z. Ion Mobility Spectrometry. 2nd. Boca Raton:CRC Press; 2005, 350.
- [4] Roscioli K, Davis E, Siems W, Mariano A, Su W, et al. Modular Ion Mobility Spectrometer for explosives Detection Using Corona Ionization, Anal. Chem. 2011 Aug 1; 83(15):5965-71.
- [5] Sabo M and Matejek S, 2011 Ion Mobility Spectrometry for Monitoring High-Purity Oxygen, Anal Chem, 2011; 83 (6), 1985-1989.
- [6] H. F. Tammet, The Aspiration Method For Determination Of The Determination Of Atmospheric-Ion Spectra, Scientific Notes of Tartu State University, 1967 2(195):1-9.
- [7] Vinopal R, Jadamec J, de Fur P, Demars A, Jakubielski S, Green C, et. al. Fingerprinting bacterial strains using ion mobility spectrometry. Elsevier. Anal. Chim. Acta. 2002; 21745:1-13.
- [8] Boggio N, Alonso P, Ortiz J, Rinaldi C, Lamagna A, Boselli A. Desarrollo de un espectrómetro por movilidad iónica para la detección de compuestos orgánicos (explosivos, drogas y contaminantes). ANALES AFA ISSN 1850-1158. 2008;20(208):208-210.
- [9] K. Tuovinen, M. Kolehmainen, and H. Paakkanen. Determination and identification of pesticides from liquid matrices using ion mobility spectrometry. Anal. Chim. Acta 2001. 429:257.
- [10] M. Utriainen, E. Kärpänoja, and H. Paakkanen. Combining miniaturized ion mobility spectrometer and metal oxide gas sensor for the fast detection of toxicchemical vapors. Sens. Actuators B 2003, 93:17.
- [11] Solis A and Sacristan E. Designing the measurement cell of a swept-field differential aspiration condenser,Rev. Mex. Fís. 2006 Mar 22;52(4):322-328.
- [12] Mang Zhang, Anthony S. Wexlerk. Cross-flow ion mobility spectrometry: Theory and initial prototype testing, Int. J. Mass Spectrom. 2006, 258(1-3):13-20.
- [13] Zimmermann S, Abel N, Baether W, Barth S, 2007 An ion-focusing aspiration condenser as ion mobility spectrometer, 2007. ScienceDirect, Sensors and Actuators B, 125; 428-434.
- [14] Barth S, Zimmermann S, Modeling Ion Motion in a Miniaturized Ion Mobility Spectrometer. In: COMSOL Conference. Proceedings of the COMSOL Conference; 2008; Hannover.
- [15] Rosasa G, Murphya R, Morenob W. Smart Antenna using MTM-MEMS.Wireless and Microwave Technology Conference (WAMICON). In IEEE 11th Annual; 2010; Melbourne, FL. IEEE Explorer, 2010 (ISBN: 978-1-4244-6688-7) 12-13 April 2010.
- [16] Ortiz J, Lamagna A, Boselli A.Design of a CF-IMS (Cross Flow Ion Mobility Spectrometry) with MEMS technology,Procedings of the 13th International Meeting on Chemical Sensors, 2010 July 11-14; Perth Western, ISBN: 978-1-74052-208-3, pag.332.
- [17] MEMS and Nanotechnology Exchange (MNX) [internet]. Reston, Virginia. [update 1999, cited 2011] Available from: www.memsnet.org/mems/processes/deposition.html.
- [18] Senturia S. Microsystem Design.1ed. New York: Kluwer Academic Publishers; 2000, 716.
- [19] Escuela Superior de Ingenieria [internet]. Sevilla. [update 2005, cited 2011] Available from: http://iecon02.us.es/ASIGN/SEA/.
- [20] M. Goldman, A. Goldman and E.S. Sigmon. The corona discharge, its properties and specific uses , Pure & Appl Chem. 1985; 57(9):1353-1362 .
- [21] J.J.Ortiz and G.P.Ortiz Design of a ion microgenerator by corona discharge, Unpublished
- [22] Peek F. Dielectric Phenomena in High Voltage Engineering. 1er. New York:McGraw-Hill Book Company, Ink; 1920, 281 p.
- [23] Krantz S. Handbook of Complex Variables. 1er. Boston:Birkhauser; 1999, 290.
- [24] COVENTOR [internet]. North Carolina. [update 2000, cited 2010]. Available from: http://www.coventor.com/solutions/resonators/.
- [25] Borg X. Full analysis & design solutions for EHD Thrusters at saturated corona current conditions, The General Science Journal, 2004 Jan 1. Available from: http://blazelabs.com/pdflib.asp.
- [26] Ortiz J, Nigri C, Rodrigez D, Ortiz G, Perillo P, Lasorsa C, et al. Verification of Paschen curve and Peek’s Law in Micro Glow-discharge. Proceding of the II Congreso de Microelectrónica y Aplicaciones (uEA), 2011 Sep 6-9. La Plata, Argentina. ISBN 978-950-34-0749-3, pag. 235-237.
- [27] Friedrich Paschen. Ueber die zum Funkenubergang in Luft, Wasserstoff und Kohlensaure bei verschiedenen Drucken erforderliche Potential differenz Annalen der Physik, 1889 273(5):69–75,48-56.
- [28] Raizer Y. Gas Discharge Physics. 1ed Springer. Springer; 1991 Sep 19, 449.
- [29] The numerical calculation was done through Laplace’s equation extended to the entire volume. The algorithm used is called P-FFT (precorrected fast Fourier transform) [23] impose conditions of symmetry on the top and sides of the volume. At the bottom edge conditions are voltage to the electrodes, positive on nails and zero for the plane, while the bottom surface charge surface boundary conditions on which find electrodes is zero [24].