Improving the Production Baseline at RHIC and the LHC
Abstract
We assess the theoretical uncertainties on the inclusive production cross section in the Color Evaporation Model (CEM) using values for the charm quark mass, renormalization and factorization scales obtained from a fit to the charm production data. We use our new results to provide improved baseline comparison calculations at RHIC and the LHC. We also study cold matter effects on production at leading relative to next-to-leading order in the CEM within this approach.
keywords:
quarkonium , cold nuclear matterBecause the charm quark mass is finite, the total charm production cross section can be calculated in perturbative QCD. However, there are large uncertainties due to the choice of quark mass, factorization scale and renormalization scale [1]. Typical lower limits of the factorization and renormalization scales are half the chosen charm quark mass [1, 2]. In this case, the factorization scale is below the minimum scale of the parton densities. In addition, for renormalization scales below 1 GeV, the strong coupling constant becomes large and the perturbative expansion is unlikely to converge. Thus we seek a set of physically defensible mass and scale parameters that reduce the cross section uncertainty. Because the cross sections are calculated with the same set of mass and scale parameters as open charm production in the Color Evaporation Model [4], we also place limits on the cross section calculated in the CEM for the first time. See Ref. [3] for full details.
The charm quark mass we employ in our calculations is the Particle Data Group (PDG) value based on lattice determinations of the charm quark mass in the scheme at : GeV [5]. We fit the factorization and renormalization scale parameters to a subset of the fixed target total charm production data with GeV. The data were evaluated and adjusted to the values we employ in our fits using the most up-to-date branching ratios for the measured decay channels in Ref. [6]. We also include data from both PHENIX [7] and STAR [8, 9] at GeV. We neglect unknown next-order uncertainties which could be large for charm where the mass is relatively small and corrections could be significant.
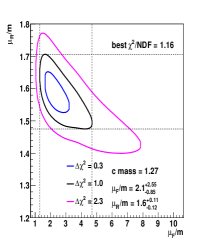
The best fit, including the STAR data presented at Quark Matter 2011 [8], yields the parameter values GeV, and 00footnotetext: Using the final STAR data point [9] in the fitting changes the upper and lower limits on by 8% and 4% respectively, while the limits on change by less than 1%.. We show the /dof fit contours on the left-hand side of Fig. 1 for , 1 and 2.3. The one standard deviation uncertainty in the fitted value of () was taken as the maximum extent of the contour along the () axis. The one standard deviation uncertainty in the total cross section is the range of cross sections resulting from all combinations of and contained within the contour. The contour is to guide the eye. Note the narrow range in relative to the much broader range. The uncertainty on is larger and very asymmetric. There is a greater uncertainty on the upper limit than the lower limit because there is a much greater change in at lower factorization scales than when , the minimum scale of the parton densities.
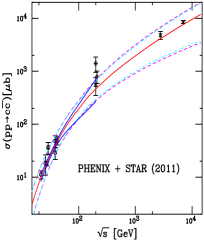
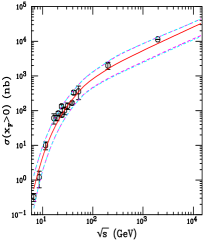
The center left panel of Fig. 1 shows the energy dependence of the total charm cross section for the fits with the corresponding uncertainty based on results using the one standard deviation uncertainties on the quark mass and scale parameters. If the central, upper and lower limits of are denoted as , , and respectively, then the seven sets corresponding to the scale uncertainty are = {, , , , , , }. The upper and lower limits on the PDG value of the charm quark mass are 1.36 and 1.18 GeV. The uncertainty band can be obtained for the best fit sets by adding the uncertainties from the mass and scale variations in quadrature. The envelope containing the resulting curves,
| (1) | |||||
| (2) |
defines the uncertainty. The uncertainty bands are shown for two cases: the fiducial region delineated above, similar to Ref. [2], and including the most extreme cases and . The difference between the outer magenta curves, which include these extremes, and the cyan curves, which do not, is very small. Therefore, it is reasonable to neglect the extremes. We also show the result for a one standard deviation uncertainty in the total cross section obtained from the contour in the blue lines. We have also added the 2.76 and 7 TeV total cross sections obtained by the ALICE collaboration in collisions [10], not included in our fits. The calculations are in rather good agreement with the data.
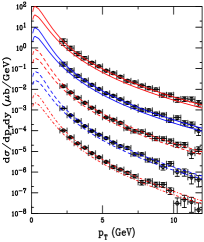
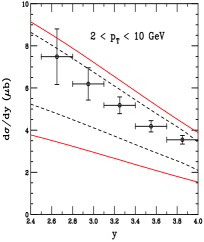
We use the FONLL approach [2] to calculate the heavy flavor semileptonic decay kinematic distributions to compare to single lepton spectra which include decays as well as decays. The and bands are calculated with the same fiducial set of parameters as in Ref. [2]. The band is calculated for our best fit parameter set. The center right and right panels of Fig. 1 compares our calculations with the ALICE single muon data in the forward rapidity region, [11]. The data are given for GeV and separated into five rapidity bins, each 0.3 units wide, as shown in the center right panel of Fig. 1. The calculations agree well with the measurements over the entire range. On the right-hand side of Fig. 1 we present our results in the dashed curves as a function of rapidity, integrated over the same range as the data, GeV. We also show the rapidity distribution obtained using the FONLL charm parameter set with a central charm quark mass of GeV in red. The -integrated ALICE data agree well with both calculations. The results with the fitted charm parameter set narrow the uncertainty band without sacrificing consistency with the measured data.
We now turn to a treatment of quarkonium production within this same framework. In the CEM, the quarkonium production cross section is some fraction, , of all pairs below the threshold where is the lowest mass heavy-flavor hadron. We fit to the forward (integrated over ) cross section data on only , Be, Li, C, and Si targets. In this way, we avoid uncertainties due to ignoring any cold nuclear matter effects which are on the order of a few percent in light targets. We also restricted ourselves to the forward cross sections only.
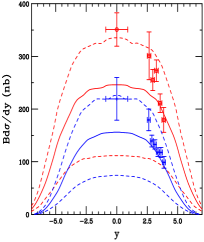
We use the same values of the central charm quark mass and scale parameters as we found for open charm to obtain the normalization for ). We determine only for the central parameter set and scale all the other calculations by the same value of to obtain the extent of the uncertainty band. The result is shown on the left-hand side of Fig. 2.
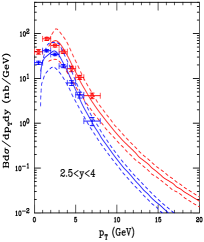
The ALICE 2.76 and 7 TeV inclusive rapidity and forward distributions () are shown in the center left and center right plots of Fig. 2. The rapidity distribution at TeV is flat over several units of rapidity. The calculated rapidity distribution at 2.76 TeV is not as broad and the agreement with the data is rather good although the midrapidity point remains high relative to the central value of the calculation. The agreement of the calculated distributions with the forward rapidity data is quite good with the exception of the lowest points where the calculated distributions turn over more quickly than the data.
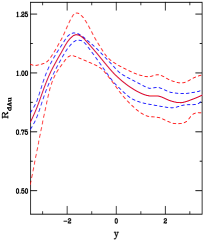
Finally, in the right-hand panel of Fig. 2, we show the ratio for 200 GeV d+Au collisions at RHIC to NLO in the total cross section with EPS09 NLO shadowing. The red band shows the variation with respect to the 31 EPS09 sets while the blue band indicates the mass and scale variation around the central set. We note that, with the best fit set, the scale uncertainty is now less than the uncertainty due to shadowing.
We have narrowed the uncertainty band on the open heavy flavor cross section and, in so doing, have also provided a realistic uncertainty band on production in the Color Evaporation Model. The central result, GeV, and , is quite compatible with previous calculations using a ‘by-eye’ fit to the data with GeV, [4, 14].
While the fits have been made by comparing the calculated NLO charm production cross section to available data at fixed-target energies and at RHIC, they are in good agreement with the extracted total charm cross sections at the LHC. The same parameter set also provides good agreement with the distributions of single leptons from semileptonic heavy flavor decays at RHIC and the LHC. The limit on the width of the uncertainty band is now set by the uncertainty due to bottom quark production and decay.
We have used the same fit parameters in the calculation of production in the color evaporation model and have thus provided the first uncertainty band on production in this approach. The energy dependence of the total cross section that results is a good match to the data up to collider energies. The distributions are also in good agreement with the data from RHIC and the LHC. In future work, we will use our new parameter set to place limits on the contribution of meson decays to production and will also study cold nuclear matter effects on production in more detail at next-to-leading order.
Acknowledgments
We thank M. Cheng, L. Linden Levy, P. Petreczky, R. Soltz and P. Vranas for discussions. The work of R. V. and R. E. N. was performed under the auspices of the U.S. Department of Energy by Lawrence Livermore National Laboratory under Contract DE-AC52-07NA27344 and was also supported in part by the JET Collaboration. The work of A. D. F. was supported by the National Science Foundation grant PHY-07-54674.
References
- [1] R. Vogt, Eur. Phys. J. ST 155, 213 (2008) [arXiv:0709.2531 [hep-ph]].
- [2] M. Cacciari, P. Nason and R. Vogt, Phys. Rev. Lett. 95, 122001 (2005).
- [3] R. E. Nelson, R. Vogt and A. D. Frawley, in preparation.
- [4] R. Gavai, D. Kharzeev, H. Satz, G. A. Schuler, K. Sridhar and R. Vogt, Int. J. Mod. Phys. A 10, 3043 (1995).
- [5] C. McNeile, C. T. H. Davies, E. Follana, K. Hornbostel and G. P. Lepage, Phys. Rev. D 82, 034512 (2010).
- [6] C. Lourenço and H. K. Wöhri, Phys. Rept. 433, 127 (2006) [hep-ph/0609101].
- [7] A. Adare et al. [PHENIX Collaboration], Phys. Rev. Lett. 97, 252002 (2006).
- [8] Y. Zhang et al. [STAR Collaboration], J. Phys. G 38, 124142 (2011).
- [9] L. Adamczyk et al. [STAR Collaboration], arXiv:1204.4244 [nucl-ex].
- [10] B. Abelev et al. [ALICE Collaboration], arXiv:1205.4007 [hep-ex].
- [11] B. Abelev et al. [ALICE Collaboration], arXiv:1201.3791 [hep-ex].
- [12] K. Aamodt et al. [ALICE Collaboration], Phys. Lett. B 704, 011 (2011).
- [13] B. Abelev et al. [ALICE Collaboration], arXiv:1203.3641 [hep-ex].
- [14] P. L. McGaughey, E. Quack, P. V. Ruuskanen, R. Vogt and X.-N. Wang, Int. J. Mod. Phys. A 10, 2999 (1995).