Reconstruction of the electron-phonon interaction function in Ta, 2H-NbSe2 and MgB2 from spectra of point-contacts
Abstract
Using Ta, 2H-NbSe2 and MgB2 as an example it is shown that it is possible to reconstruct qualitatively a function of the electron-phonon interaction from point-contact spectra in a superconducting state. The limits and the restrictions of this method are also shown. The results obtained are compared with available literature data.
pacs:
71.38.-k, 73.40.Jn, 74.25.Kc, 74.45.+c, 74.50.+r.I Introduction
A traditional point-contact (PC) spectroscopy of the electron-phonon interaction (EPI) Kulik assumes that both electrodes forming a -contact are in a normal state at low temperatures. However, it is quite difficult to transform many actual superconductors to a normal state. Spectra of and -point-contacts in some cases contain an additional structure in the region of phonon energies, and a form of such spectra is quite complicated and on occasion is far from traditional. A transformation into a normal state of electrodes forming a point-contact often leads to disappearance of such a structure. It can be explained by the fact that the spectrum in a normal state and the additional nonlinearity arising at a transition to a superconducting state are determined by scattering processes in geometrically different regions of a point-contact.
In a normal state the contribution to a spectrum is backscattering processes at which an electron returns to the same half space from which it flew out Kulik . A main contribution to a spectrum is formed by processes of scattering of electrons in a volume with a diameter of the order of a point-contact. Indeed, for a contact in the model of an aperture with a diameter a probability of the return in the case of the scattering is maximal in a center of the contact and is 0.5. Since in an isotropic case a direction of the electron flight after scattering is equally possible, on a large distance from the contact plane the probability of the return does not exceed a ratio of the contact area to the surface area of a sphere with a center at the scattering point and the radius , and is (d/4R)2. Thus, on the distance this probability is times lower than in the contact center, and for it is times lower. A maximal concentration of nonequilibrium phonons is achieved in the region of maximal density of the current and decreases fast with its spreading. So in the first approximation at large distances from a narrowing the point-contact can be considered as a point source of phonons, and their density decreases . However, the largest part of phonons is still generated in edges in the amount of the order of the energy relaxation length of nonequilibrium electrons, which depends on their energy. The inelastic mean free path of electrons can be estimated by the formula ,
here is the Eliashberg thermodynamic function. Note that if a metal has a few groups of electrons, then in the estimation it is necessary to use the Fermi velocity for the group which determines its transport characteristics. By the way, this note is also valid for the expressions given in Sec. II for an estimation of the potential barrier appearing at an interface of two metals due to a mismatch of their Fermi parameters. Obviously, that the scattering of nonequilibrium electrons by phonons in edges does not affect the PC spectrum in a normal state. An inelastic superconducting addition in the spectrum is determined by processes of scattering of electrons, undergoing the Andreev reflection, by nonequilibrium phonons, and any scattering process is effective. Since the probability of reabsorption of nonequilibrium phonons by electrons experiencing the Andreev reflection depends on the concentration of phonons, from the above estimation it is clear that the contribution to the superconducting inelastic spectrum decays more slowly with increasing the distance from the aperture than the contribution to the normal spectrum. Besides, not taking into account phonons created in edges would be too rough approximation, since the Andreev reflection takes place in a volume of the order of the coherence length, which is, in the cases under discussion, considerably larger than the diameter of the point-contact, and is comparable to the inelastic relaxation length at the Debye energies. Estimations for the concentration of nonequilibrium phonons depending on an applied voltage are reported in Ref.Gloos, for a Nb point-contact. It seems that a relative integral contribution of the peripheral regions of a contact in the inelastic superconducting addition in the spectrum for superconductors with a sufficiently strong EPI can be comparable with the contribution of the central regions. Therefore, if the contribution to the spectrum of the point-contact central regions is ”turned off” somehow, the remained nonlinearity will almost entirely be determined by the superconducting addition to the spectrum of peripheral regions. Taking into account that the impurities and defects disturbing the crystal structure of the material under investigation are usually concentrated near the surface, and considering that in the process of forming point-contacts additional distortions of the lattice are introduced, significantly lower quality of the material near the contact center can be expected. This leads to a blurring of the normal spectrum and a decrease in its intensity, and to the complete suppression of it for a very strong distortion of the lattice. At the same time edges of the contact can remain quite clean, and the superconducting addition to the spectrum will reflect properties of the bulk material. We note in passing that the observed high level of the background for some PC spectra in a normal state, which cannot be described within the framework of the existing theory of reabsorption of nonequilibrium phonons Kulik1 , possibly is also related to the presence of a strongly distorted layer with a thickness smaller than the diameter of the contact. The aim of this work is reconstruction of the PC function of the EPI from the superconducting addition to the spectrum using clean point-contacts of Ta as an example. Then, using algorithms obtained for Ta, the functions of the EPI for 2H-NbSe2 and MgB2 are restored, spectra of which in a normal state are absent or blurred very much.
II Main theoretical conceptions
The authors of Ref.Khlus, have extended a theory of the PC spectroscopy to contacts. In this case it has been assumed that contacts satisfy the following conditions:
| (1) |
| (2) |
These conditions mean that characteristic dimensions of the contact are smaller than the momentum mean free path and the coherence length , the energy mean free path up to energies , ( for ). The characteristics (IVC) in the zero approximation in is given by the expression,
| (3) |
where is the resistance in the state for a quadratic dispersion law; is the aperture area. In the case of a real value of for an excess current the result coincides with that obtained in Ref.Zaitsev, :
| (4) |
Taking into account an effect of the EPI on a form of the IVC at high gives nonlinear in contributions to the current,
in this case, coincides with a negative addition in the current obtained for a normal contact Kulik ,
| (5) |
Here is the volume of generation of phonons,
| (6) |
The superconducting component of the inelastic current,
| (7) |
For
| (8) |
The function in Eqs.(5) and (7) is a PC function of the EPI which is similar to that in point-contacts in a normal state, is a superconducting PC function of the EPI different from by a form-factor. In this case, in contrast to a normal form-factor causing the contribution to the current due to electron-phonon collisions with changing the z-component of electrons velocity, in the case of the superconducting form-factor entering into a contribution to the current is made by electron-phonon collisions related to processes of the type of the Andreev reflection in the contact region, i.e. the transformation of quasielectron excitations into quasihole ones. A relative value of the phonon contribution to the excess current at is of the order of , i.e. it is small if the condition (2) is fulfilled. For the first derivative of the excess current it is obtained the relation
| (9) |
Since as shown in Ref. Khlus, at , , , then in the region of small displacements on the contact a main contribution is made by processes without changing the z-component of the velocity, of the type of the Andreev reflection. In Ref. Khlus1, point-contacts have been considered. For the second derivative of the IVC it was obtained the following expression
| (10) |
where is the function of the EPI for normal and superconducting metals forming a heterocontact, is the blurring factor,
| (11) |
Thus, at a resolution is determined by . For the first derivative of the excess current, the expression similar to the contact was obtained,
| (12) |
As it was mentioned above the expression for the excess current of the pure contact, similar to (4), was obtained in Ref.Khlus, . In that work as well as in Ref.Artemenko, , a form of the IVC for and contacts in pure and dirty limits was found. In a dirty limit the excess current is lower and at arbitrary temperature for the contact is described by the expression,Artemenko
| (13) |
where is the momentum mean free path, is the contact diameter. In the intermediate case, for an arbitrary relation between and an evaluated relation, correct to first order in , was obtained in Ref.Zaitsev1, for the contact,
| (14) |
Here is the contact resistance in a normal state with taking into account the impurity scattering, - is the resistance of an extremely pure contact. An absolute value of the excess current for contacts appears to be twice smaller. In Refs. Khlus, ; Zaitsev, ; Khlus1, , upon calculating the excess current, it has been assumed that the Fermi velocities and momenta coincide at both edges of the point-contact. An effect of a barrier within the plane of narrowing, appearing for different and , has been taken into account in Ref.Zaitsev1, . For the excess current of a pure heterocontact at arbitrary temperature it was obtained the expression,
| (15) |
| (16) |
Here is the reflection coefficient, is the diffusion coefficient (calculation of and other coefficients for heterocontacts is considered in detail in Ref. Bobrov, ). For . With decreasing the diffusion coefficient the form of the IVC and the dependence of the differential conductivity on approach dependences typical for tunneling contacts. The reflection from an interface between metals leads to that at low temperatures becomes to be non-monotonic. At ,
| (17) |
Thus the transparency can be estimated from experimental data. For the contact for an arbitrary transparency of the interface in the region of high voltages
| (18) |
where is determined by Eq. (16). As it was already mentioned above, the second derivative of the IVC for the point-contact is given by the convolution Eq. (10). Taking into account the relation between the derivative of the IVC and the PC function of the EPI one can write down
| (19) |
As a model we will use a function of the EPI for tantalum, restored from a spectrum of a heterocontact in a normal state. Note that on writing the formula (19) we neglected the fact that , corresponding to the superconducting edge, is a superposition of gN() and GS() (see Eq.(9)). As it was mentioned above, GS() is different from gN() by a form-factor, and most pronounced differences are expected in the region of small displacements. In what follows, since we obtained the spectrum of the EPI in a superconducting state for the same contact, a comparison of theory and experiment will be performed, and it will be considered how much this approximation is acceptable. The results calculated by Eq.(19) are shown in Fig.1.
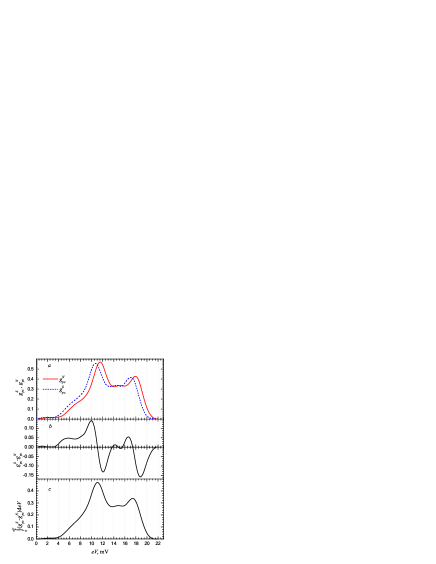
In comparison with the initial curve , in the superconducting curve there is a shift of maxima of the EPI towards lower energies by a value of the gap . (Note that in the contact for a transition into a superconducting state the position of maxima of the EPI does not change.) Besides, its amplitude is slightly smaller than that of the initial curve due to an additional broadening on a blurring factor (Eq. (11)). As it was already noted, in a superconducting state the spectrum of the EPI should show up in the first derivative of the excess current. Indeed, if from the superconducting curve the initial normal curve is subtracted, then we obtain the curve (see Fig.1(b)). As it follows from Eq. (12), the function of the EPI can be restored from the first derivative of the excess current,
| (20) |
This function is given by the curve shown in Fig.1(c). Note that from Eq.(9) it follows that the point-contact function of EPI in the first derivative of the excess current is a superposition of and . Thus, a position of phonon maxima in is intermediate between and , that is seen in Fig.1. Besides the inelastic component of the superconducting addition in the spectrum, considered above, and taking only place in contacts with the noticeable excess current, for the point-contacts containing superconductors with a strong EPI an elastic addition to the spectrum is also possible Beloborod'ko ; Omel'yanchuk . This addition is due to an energy dependence of the superconducting order parameter () and takes place for both point-contacts with direct conductivity (Eq.(10) in Ref.Beloborod'ko, ) and tunneling point-contacts (Eq.(11) in Ref.Beloborod'ko, ). In Ref.Omel'yanchuk, it is noted that for ballistic contacts nonlinearity of the IVC of the elastic origin can be comparable to inelastic point-contact contributions. Obviously that for point-contacts with a large tunneling parameter it is exactly an elastic contribution will be prevalent. For both tunneling and point-contacts with direct conductivity the elastic addition to the spectrum does not contain the function of the EPI g() in explicit form. However, it can be reconstructed by inverting the Eliashberg equations (similar to the tunneling spectroscopy of Rowell-McMillan Rowell ). For point-contacts with the direct conductivity or small value of it seems that the relation between elastic and inelastic contributions is determined by strength of the EPI. It is also necessary to take into account that for different superconductors as the EPI increases the energy mean-free path decreases leading to an increase in the concentration of nonequilibrium phonons in the peripheral regions adjacent to the contact (see, for instance, Ref.Gloos, ). So for them one can expect an increase in a relative part of nonlinearity, related to the inelastic superconducting scattering, in comparison with superconductors with a weak coupling. First experiments on measurements of point-contact spectra of Sn and In, satisfying the conditions (1) and (2) a superconducting state and their comparison with the spectra in a normal state have been performed in Refs.Yanson, ; Kamarchuk, ; Kamarchuk1, ; Kamarchuk2, . The authors have found excellent agreement between the Khlus theory Khlus1 and experimental results. At the same time experiments in Pb (Ref.Khotkevitch, ) have revealed a significant contribution of elastic processes. By the way, in Fig.2 in Ref.Khotkevitch, one can see a form of the elastic contribution to the spectrum, calculated by the abovementioned formula for the second derivative of the IVC of the Pb point-contact, in comparison with experimental data. In the Sec.III we will restore a function of the EPI from the first derivative of the excess current assuming that the elastic addition can be neglected. The point-contact spectra of Ta, 2H-NbSe2 and MgB2 are used as objects of investigations. We estimate a contact diameter by the Veksler interpolation formula,
| (21) |
For the sake of convenience we list parameters of the objects under investigation:
NbSe2 (Refs.Whitney, ; Takita, ): – TC=7.2K; l2.210cm2; (0)=7.8nm; (0)=2.6nm. Values of the superconducting gaps within the two-band approximation (see, for instance, Eqs.(2) and (3) in Ref.Bobrov1, ) estimated by us for the contacts given below with the resistance of 1100 and 750 respectively: =1.1mV, =2.46mV, k=0.62, =1.61mV; =1.07mV, =2.48mV, k=0.7, =1.49mV; =0, =0.
MgB2 (Ref.Prikhma, ): – TC=39K; lab2.410cm2; (0)=12nm, (0)=3.6nm, =1.82.4meV, =6.87.4meV.
III Experimental Data
III.1 Point contacts Ta-Cu
Fig.2 shows the PC spectra of the contacts Ta-Cu in normal and superconducting states.
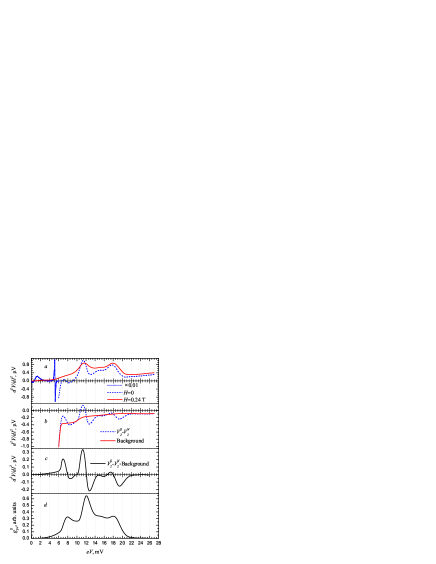
The resistivity of tantalum is =12.610cm (Ref.Startsev, ) the ratio of resistances /18, which gives an elastic mean free path 84 nm in the electrode at the helium temperature. In this case the diameter of the point-contact with the resistance of 70 is, according to Eq. (21), 3.8 nm. Note that in the estimation of the diameter the heterostructure was not taken into account. However, considering that transport parameters of copper (l5.310cm2 (Ref.Gniwek, )) are close to those of tantalum, this correction can be neglected. A significantly smaller background level in the superconducting spectrum is to be noted. An identical decrease of background has been noted for the first time in Ref.Yanson, . In Ref.Khotkevitch1, it has been assumed that this effect can be related to decreasing the current of quasiparticles upon combining some electrons responsible for the excess current into Cooper pairs during the Andreev reflection, since the EPI in the contact is connected with a quasiparticle component of the total current. It is necessary to note here that the shown spectrum satisfies the conditions (1) and (2) and is similar to most intensive spectra described in Ref.Bobrov, . Nevertheless, upon a transition to a superconducting state noticeable distinctions from predictions of the theory are observed. Here we will not discuss an appearance of nonequilibrium characteristics in spectra, which have been considered in detail in Refs.Bobrov2, ; Yanson1, , and restrict our attention to the EPI. First of all we note that the greatest distinctions are observed in the range of small energies. A soft mode in the vicinity of 78 mV starts to show up as a peak. Instead of broadening, the peak close to 1112 mV becomes sharper abruptly, but the distinctions in the vicinity of 18 mV are already not so pronounced. The sharpening of the peaks can be caused by a high concentration of nonequilibrium phonons with small group velocities which leave the contact region slowly. Their velocities correspond to the frequencies at which the density of states is maximal. The probability of reabsorption of phonons by electrons exhibiting the Andreev reflection increases with the phonons concentration. It is just a selection of phonons according to determines the effect of stabilization of peaks positions and their sharpening upon a transition into a superconducting state Yanson2 . In an state phonons participate in inelastic backscattering processes in a broader area of the phase space, and the position of maxima in the spectrum can change depending on orientation of the contact axis with respect to the crystallographic axes. In addition, the greatest distinction of the curves in Figs. Fig.1 and Fig.2 exactly in the region of small displacements can be due to the fact that an effect of the superconducting form-factor entering to was not taken into account in calculating the convolution in Fig.1 (curve ), see Eq. (7). As it was mentioned in Introduction it is just in the region of small displacements on the contact an effect of the superconducting form-factor manifests itself most pronouncedly, and the main contribution to the current is made by processes of scattering without changing the -component of the velocity, of the type of the Andreev reflection. The absence of the sharpening of phonon peaks in the PC spectra of In and Sn upon a transition to a superconducting state Yanson ; Kamarchuk ; Kamarchuk1 ; Kamarchuk2 is an indirect indication of a small contribution of the region close to the contact in the inelastic superconducting spectrum. For these superconductors the energy relaxation length at energies of phonon peaks is higher than that in Ta, and in spite of a small group velocity of such phonons their concentration in edges in the vicinity of contractions is insignificant to affect noticeably a form of the spectrum. At the same time in the region of intensive generation of phonons the selection on the basis of the phonon group velocity is not so efficient due to a small size of the current concentration region. The presence in the spectrum of the gap and nonequilibrium features as well as changing the form of the spectrum and the reduced background makes it not possible to restore the function of the EPI from the curve via simple integration. So, to compensate the influence of all neglected factors before integrating it is necessary to subtract the background as it is done for restoring the function of the EPI from a spectrum of a normal state. Since at energies above the Debye ones the function of the EPI turns to zero, the curve after subtracting the background should become to be zero at these energies. The second necessary condition is an absence of a background on the curve obtained as a result of integration. To fulfill this condition the areas under the curve after background subtraction should be the same above and below an abscissa axis. Note that above mentioned requirements are satisfied for different forms of a background curve. However, the variations do not lead to significant changes of the form and positions of phonon characteristics of a restored function of the EPI pc. So for a rough estimate of the EPI function, it is enough to plot a background curve freehand. Because the gap and nonequilibrium features do not allow to reconstruct correctly a trend of the curve in the range from 0 to 6 mV, this part was approximated by a parabola segment. In order to prevent from additional misrepresentations the background curve was smoothed out by segments of polynomial curves. We note in passing that the restored function of the EPI is close enough in form to the EPI function of a superconducting state, which could be obtained from the –spectrum in Fig.2 (a) by subtracting a traditional background.
III.2 Point-contacts 2H-NbSe2-Cu
The investigation of the EPI spectra of 2H-NbSe2 in a superconducting state is presented in Ref.Bobrov3, . We emphasize here that this compound is very difficult for experiments due to a strong dependence of the point-contact spectra on the quality of initial samples of single crystals. For example, one of the first single crystals investigated by us had a resistance ratio /30. Point-contacts based on these single crystals were characterized by a very low noise level up to the resistance of 1 k. At the same time the point-contacts based on single crystals with /100 and having the resistance higher than 1020, in most cases had a very high level of noise that did not allow to use them for studying the EPI. A possible reason for this is incommensurate charge density waves (CDWs) that exist in this compound. In the former case the single crystals are not perfect enough, and there are effective pinning centers, preventing their movement. In the later case there are not many of such centers, and the motion of the CDWs in the vicinity of the contact in the current state generates such noise. Note a principal difference between the point-contact EPI spectra in 2H-NbSe2 Fig.3 and Ta Fig.2.
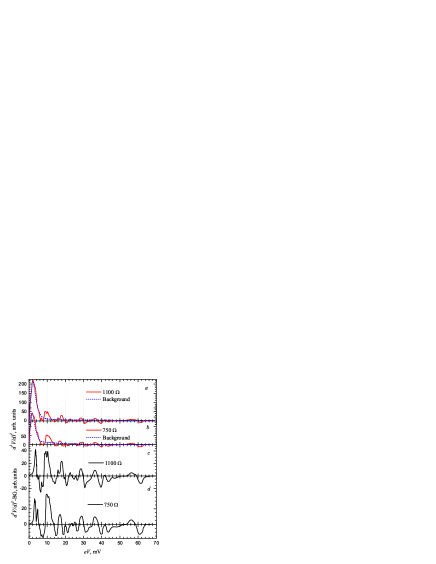
In a normal state there is no structure in the region of phonon energies in the spectra of 2H-NbSe2 (see Fig.1 in Ref.Bobrov3, ). At the same time in a superconducting state the spectra have many features. It is noteworthy that by the standards of the traditional PC spectroscopy contacts are very high-ohmic. The reasons for selecting such contacts are a high resistivity of the compound, greater by about 2 orders of magnitude than in conventional metals (210cm; 10cm (Ref.Edwards, )), and, apparently, a small energy mean free path of electrons at energies close to the Debye due to the strong EPI. The reason for the phonon features to appear only in a superconducting state is apparently associated with a technology of manufacturing the PCs. The sample of 2H-NbSe2 was a single-crystalline plate with the dimensions of 15200.1 mm. The electrodes with the dimensions 35 mm were cut out by a blade and glued with silver paste to a wire holder. Thus, the contact pads of the electrodes were machined, and a crystal structure of 2H-NbSe2 on a site of the cut was largely broken. Consequently, the point-contact is very inhomogeneous; there are clean edges and a dirty core with a strongly distorted lattice with a short mean free path of electrons. In a normal state, an intensity of the phonon spectrum is proportional to the ratio li/d and very small. The spectrum itself is formed by a material in a volume of the order of a diffusion mean free path and, because of the crystal structure distortion, contains only a background component. An estimate of diameters of the contacts by Eq.(21) gives 23.4 nm for the first and 2.34.3 nm for the second contacts respectively. An elastic mean free path for these estimates was about 33 and 1.1 nm, corresponding in the former case to the resistivity of unperturbed material in the vicinity of TC and to in 2H-NbSe2 at room temperature in the latter case. In the other words, it was assumed that in the contact region 1. Taking into account the lack of spectra in a normal state, we can assume that the mean free path near the narrowing is even smaller, and diameters of the contacts are larger. Upon a transition to a superconducting state at the IVC of the point-contact there appears the excess current which is formed by processes of the Andreev reflection at distances of the order of the coherence length. This length is larger than the diameter of the contact, and the greatest contribution to the excess current is given by those of the edges where the crystal lattice is the most perfect, because the defects make worse superconducting parameters. Under this assumption there is only dirty area of the superconducting electrode, and the second normal electrode remains clean in this case. This fact provides a unique opportunity to obtain spectra that reflect a fine structure of the EPI of an undistorted crystal lattice. As noted above, the superconducting PC function of the EPI is proportional to a function of the first derivative of the excess current. Restoring the function of the EPI from a superconducting spectrum in the absence of any features on the second derivative in a normal state assumes only subtraction of a monotonic background curve. In this case, in the vicinity of the gap region (34 mV) the background curves were plotted so that initial parts of the difference curves (Fig.3, curves c, d) were parabolic. The point-contact functions of the EPI restored from the spectra c and d (Fig.3) via integration are shown in Fig.4.
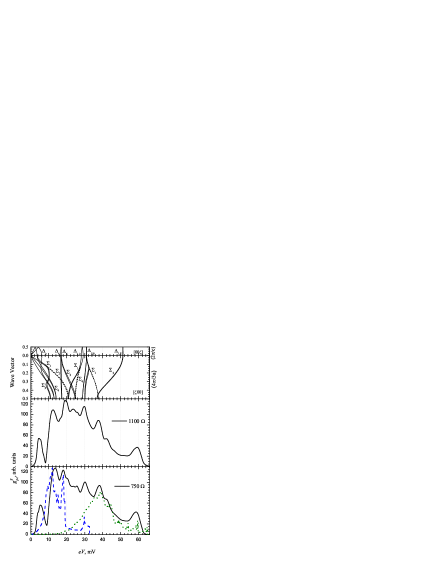
Note that the available literature data on the Debye energy of a phonon spectrum vary greatly among themselves. The only known calculated function of the phonon density of states, Galetich ; Gospodarev according to the authors, is based on elastic moduli and the maximum frequency of the quasiparticle mode and is defined up to the energy of 32 meV. In this interval, it agrees well with our data. One of the co-authors, Galetich ; Gospodarev S.B. Feodos’ev, suggested to associate the features observed at higher energies with two-phonon processes, the calculated function of which is shown in the same figure. The convolution presented coincides perfectly in a form with the data obtained by us, however so high intensity of two-phonon processes is unclear to us. On the other hand, for much higher frequencies the peaks observed on our curves are in good agreement with flat parts of the calculated dispersion curves, where /q=0 in the Feldman theoretical model for a dynamic matrix Feldman (in the figure the first model is presented), as well as with the calculations in Ref.Motizuki, . The exception is the most high-energy peak at 60 mV. Possible causes of this peak are discussed in Ref.Bobrov3, . A position of the phonon features in our spectra correlates well with the data of experimental works on the inelastic neutron scattering and the Raman spectra. Unfortunately, the experimental neutron data for this compound is generally limited to the study of low-energy phonon branches. The small variations observed in the position of the phonon features at 12 mV are apparently related both to an accuracy of the theoretical model and an influence of the superconducting energy gap in our data. Note that recently the point-contact functions of the EPI have been obtained for the 2H-TaSe2-compound belonging to the same crystallographic group Kamarchuk3 . It is interesting that a boundary of the phonon spectrum in this compound is greater than 70 mV.
III.3 Point-contacts MgB2-Ag
For the analysis, the superconducting PC spectra of MgB2 (Fig.5), reported in Refs.Yanson3, ; Yanson4, ; Yanson5, , were used.
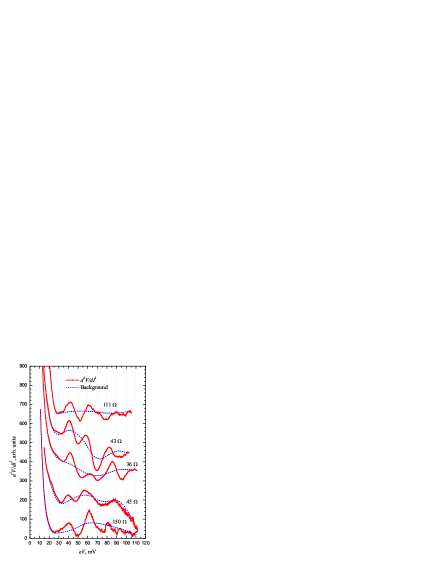
The spectra were obtained by touching a massive silver electrode to the film of MgB2 and represent an intermediate case between Ta and 2H-NbSe2 for the appearance of features in a normal state. For the point-contacts similar to those shown in Fig.5, in the normal state the weakly pronounced highly blurred features are observed in the region of the phonon energies with a high-level background Naidyuk . The residual resistivity of the film was 610cm, that corresponds to the elastic mean free path of 4 nm. The diameters of the given contacts are estimated to be 4.4, 3.9, 3.8, 2.2, and 1.9 nm (36, 43, 45, 110, 150 ) respectively. Thus, the estimates are very close to the estimated diameter of 2H-NbSe2, and the values of the elastic mean free path in the contact region in the MgB2 is found to be several times larger. Such estimates are quite reasonable, considering that we almost do not make additional lattice distortions. When a background is subtracted form the curves in a superconducting state, we were guided by the conditions specified in SubSec.A and highlighted by bold. Fig.5 shows the second derivatives of the IVC and the background curves, and Fig.6 demonstrates the difference curves.
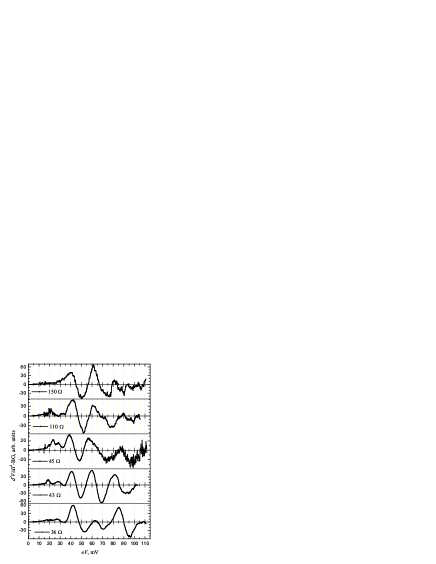
As can be seen, the background curves are not monotonic as in the case of 2H-NbSe2, and contain one or two blurred maxima. Note that presented in Ref.Naidyuk, point-contact spectra of the EPI in a normal state as a whole are similar to the curves represented by the background curves and contain the blurred maximum at around 60 mV. The point-contact spectra of MgB2 in a superconducting state were interpreted in Ref.Yanson5, from the point of view of an energy dependence of the superconducting order parameter (). The EPI function reconstructed from the difference curves are shown in Fig.7.
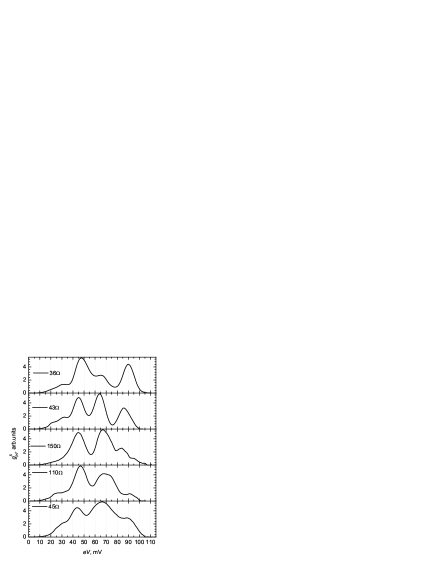
Fig.8 demonstrates the PC function of the EPI averaged over five contacts, , related to it the calculated gcalc(eV) (Refs.Pen, ; Golubov, ; Schneider, ) and obtained from the tunneling data gexp(eV) (Refs.Schneider, and Geerk, ) functions of the EPI as well as the functions of the phonon density of states Fexp(eV) and Fcalc(eV).Osborn
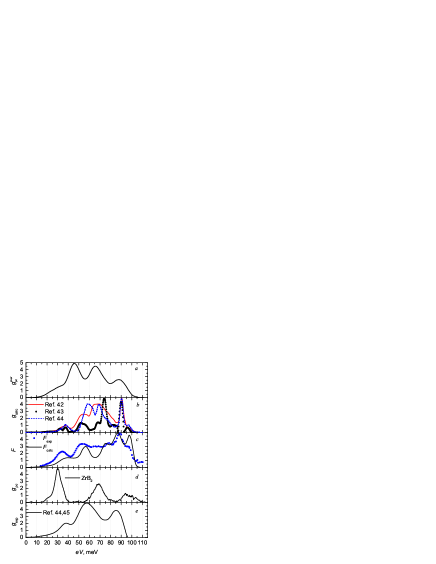
Unfortunately, it is impossible to compare in detail this function with the functions reconstructed from the PC spectra in a normal state Naidyuk due to a rather diffuse structure of the latter. So we compare with the point-contact function gPC(eV) for ZrB2 (Ref.Naidyuk1, ) belonging to the same crystallographic group. As can be seen, the functions are very similar in shape and position of the phonon features which for the averaged spectrum are at the energies by 45 mV smaller than for ZrB2, with the exception of the first peak shifted to the higher energies by 16 mV. This is understandable, since this mode is associated with vibrations of the Zr ions, the atomic mass of which is 3.75 times greater than that of the Mg ions. The calculated functions of the EPI gcalc(eV) (Refs.Pen, ; Golubov, ; Schneider, are notably different in form. However, their comparison with the average PC function demonstrates a close value in the energy of individual branches of the spectrum. As for the tunneling function of the EPI gexp(eV),Schneider ; Geerk it can be assumed that the maximum at 58 mV corresponds to the peaks at 46 and 66 mV of our averaged functions. These peaks for the tunneling contact could not be resolved due to insufficient quality of the superconducting film. This assumption can also be supported by softening the high-energy peaks from 90 to 85 mV. A comparison of the function of the phonon density of states, both calculated Fcalc(eV) and obtained from the neutron data Fexp(eV),Osborn with our demonstrates a good correlation in a position of phonon peaks. In general, it can be concluded that the method used can accurately restore a form of the EPI function from superconducting point-contact spectra.
IV Discussion of the results
As experiments demonstrate the method is effective for metals both with a large coherence length and with rather short one. For clarity, the characteristic parameters of the point-contacts considered in this paper are given in the summary table.
| Ta | 70 | 5.910-12 | 18 | 0.710-6 | 3.8 | 84 | 92 | 0.71 |
| NbSe2 | 7501000 | 2.210-11 | 30 | 6.710-6 | 22.3 | 33 | 7.7 | 1.12.5 |
| 1 | 210-4 | 3.44.3 | 1.1 | |||||
| MgB2 | 36150 | 2.410-12 | 2.2 | 610-6 | 2.24.4 | 4 | 12 | 27 |
Based on the above material, we can conclude that an interpretation of superconducting spectra is most straightforward in two limiting cases:
-
1.
for ballistic point-contacts in which the relative contribution to the spectrum of a superconducting component, as follows from the Khlus theory,Khlus1 is small and retains the overall spectrum shape, sufficiently close to a normal state;
-
2.
for point-contacts with a very dirty core and clean edges.
Theoretically, a decrease of the elastic mean free path in the contact region should lead only to a decrease in the intensity of the spectrum and should not affect its shape. But in reality, such a decrease of the mean free path is caused by either impurities or defects and distortions of a crystal lattice. In any case, this is a violation of short-range order, accompanied by a blurring the spectrum. In the limiting case for amorphization of a contact region the spectrum may be absent completely, but the contact will not go into a heating regime. If edges at the same time remain clean, after subtracting a background the spectrum is easily obtained from the first derivative of the excess current. Note that to realize the situation of dirty narrowing and clean edges is quite difficult. Most often, edges also appear to be with the short-range order breaking. A theory for the diffusion limit is presented in Ref.Demin, . The solution is obtained only for a long channel model (bridge), provided that the bridge and the adjacent edge areas contain large amounts of impurities. In the diffusion limit, as in pure point-contacts, there are processes at which electrons injected into a superconductor in the process of the Andreev reflection interact with nonequilibrium phonons, giving rise to a ”back current.” In addition, the contribution to the conductivity is made by processes such as relaxation of charge imbalance and the virtual processes that are sensitive to the frequency dependence of the EPI function. In Ref.Demin, it is emphasized that these additional channels are observed only for the geometry of a dirty bridge with a massive superconductor. Obviously, in most cases, this geometry has little to do with a real experimental situation. Departing from the bridge geometry and considering the actual spatial dependence of all quantities in the problem for a transition from a narrowing to massive edges complicates significantly the problem and still has not found a solution. Nevertheless, it is obvious that a decrease of the elastic mean free path in the vicinity of a narrowing reduces much faster a normal component of the spectrum than superconducting. Therefore, upon a transition from normal to superconducting state an intensity of the spectra of the EPI increases in such point-contacts. An example of such a transformation of spectra can be observed in Refs.Yanson6, ; Yanson7, . An intermediate regime, close to diffusion one, is very difficult to interpret. In this regime, both contributions are similar in intensity, and the normal spectrum has a small blur. A superposition of contributions of similar intensity greatly distorts a shape of the resulting spectrum, and separation of its superconducting part without carrying the contact to a normal state is a highly non-trivial task Yanson8 . A complicating factor is a possibility of appearing on the derivatives of the CVC the nonspectral features of the thermal and nonequilibrium origin, related to the destruction of superconductivity in the contact region due to the spatial inhomogeneity of a superconductor. To exclude from the consideration such features there should be some statistics of the spectra, since these features are not sufficiently reproducible. In addition, in contrast to the spectral, their position on an energy axis, are generally more dependent on temperature. A position of the spectral features of the excess current on an energy axis depends on the gap value and, hence, the temperature. However, taking into account that the gap starts to decrease significantly only at T2/3TC, in some temperature range this position can be considered practically constant. In addition to the above-noted difficulty of separating the normal and superconducting contributions to the spectrum and excluding the nonspectral features, the empirical method of subtracting the superconducting background is rather arbitrary yet. The problem of obtaining quantitative information from the spectrum, especially in the case of irregular distribution of impurities, is not solved. While in the simplest cases for materials with a large coherence length, the purity of the contact can be judged by a value of the excess current, in the compounds with small the excess current is influenced by other mechanisms in addition to the Andreev reflection. Therefore, in complicated cases of the greatest practical interest, such as high-temperature superconductors, this information will only be of a provisional character. Note that in the case of a short coherence length and a relatively low critical current density in the current state, in the vicinity of the point-contact there can be phase-slip surfaces preventing the observation of phonon features Yanson9 . Thus, though the PC superconducting spectroscopy is not as universal as a traditional, in some cases it is more efficient. First of all, these are compounds which are difficult to take to a normal state, as well as compounds in which in a normal state the spectra of the EPI are generally of poor quality or absent at all, as, for example, in NbSe2.
V Brief summary
-
1.
Using a Ta point-contact as an example it was shown that it is possible in principle to reconstruct the point-conact function of the EPI from the first derivative of the excess current. It was found that the restored PC function of the EPI differs in form from the EPI function of a normal state, and the largest differences are observed at low energies. An explanation of the observed differences was proposed.
-
2.
From the PC spectra in a superconducting state, for the first time the function of the EPI was reconstructed in 2H-NbSe2. A position of phonon peaks in the EPI function agrees well with the flat parts of calculated dispersion curves.
-
3.
The PC functions of the EPI in MgB2, restored from superconducting spectra for the first time, show good reproducibility. A comparison with related functions of the density of phonon states, F(x), tunneling and calculated functions of the EPI shows a small shift of main phonon peaks to lower energies in full agreement with theoretical predictions.
In conclusion, we wish to thank Yu. G. Naidyuk for numerous tips, comments and additions made during discussion of the paper. Our thanks are also to S. B. Feodos’ev for a discussion of the phonon spectrum of 2H-NbSe2.
References
- (1) I.O. Kulik, A.N. Omel’yanchuk, and R.I. Shekhter, Fiz. Nizk. Temp. 3, 1543 (1977) [Sov. J. Low Temp. Phys. 3, 740 (1977)].
- (2) K. Gloos, J. Huupponen, and E. Tuuli, Phonon-Drag Induced Suppression of the Andreev Hole Current in Superconducting Niobium Contacts, http:// arxiv.org/abs/1109.3770v1.
- (3) I.O. Kulik, Fiz. Nizk. Temp. 11, 937 (1985) [Sov. J. Low Temp. Phys. 11, 516 (1985)].
- (4) V.A. Khlus and A.N. Omel’yanchuk, Fiz. Nizk. Temp. 9, 373 (1983) [Sov. J. Low Temp. Phys. 9 189 (1983)].
- (5) A.V. Zaitsev, Zh. Eksp. Teor. Fiz. 78, 221 (1980). [Sov. Phys. JETP, 51, 111, (1980)].
- (6) V.A. Khlus, Fiz. Nizk. Temp. 9, 985 (1983) [Sov. J. Low Temp. Phys. 9, 510 (1983)].
- (7) S.N. Artemenko, A.F. Volkov, and A.V. Zaitsev, Zh. Eksp. Teor. Fiz. 76, 1833 (1979) [Sov. Phys. JETP, 49, 924, (1979)].
- (8) A.V. Zaitsev, Zh. Eksp. Teor. Fiz. 86, 1742 (1984). [Sov. Phys. JETP, 59, 1015, (1984)].
- (9) N.L. Bobrov, I.K. Yanson, L.F. Rybal’chenko, and V.V. Fisun, Fiz. Nizk. Temp. 13, 561 (1987) [Sov. J. Low Temp. Phys. 13, 344 (1987)].
- (10) S.I. Beloborod’ko and A.N. Omel’yanchuk, Fiz. Nizk. Temp. 14, 322 (1988) [Sov. J. Low Temp. Phys. 14, 178 (1988)].
- (11) A.N. Omel’yanchuk, S.I. Beloborod’ko, and I.O. Kulik, Fiz. Nizk. Temp. 14, 1142 (1988) [Sov. J. Low Temp. Phys. 14, 630 (1988)].
- (12) J.M. Rowell and W.L. McMillan, Phys. Rev. Lett., 14, 108 (1985).
- (13) I.K. Yanson, G.V. Kamarchuk, and A.V. Khotkevitch, Fiz. Nizk. Temp. 10, 423 (1984) [Sov. J. Low Temp. Phys. 10, 220 (1984)].
- (14) G.V. Kamarchuk, A.V. Khotkevitch, and I.K. Yanson, Fiz. Nizk. Temp. 12, 95 (1986) [Sov. J. Low Temp. Phys. 12, 55 (1986)].
- (15) G.V. Kamarchuk, A.V. Khotkevitch, and I.K. Yanson, Fiz. Tverd. Tela 28, 455 (1986). [Sov. Phys. Solid State, 28, 254, (1986)].
- (16) G.V. Kamarchuk and A.V. Khotkevitch, Fiz. Nizk. Temp. 13, 1275 (1987) [Sov. J. Low Temp. Phys. 13, 717 (1987)].
- (17) A.V. Khotkevitch, V.V. Khotkevitch, I.K. Yanson, and G.V. Kamarchuk, Fiz. Nizk. Temp., 16, 1199 (1990) [Sov. J. Low Temp. Phys.16, 693 (1990)].
- (18) E.L. Wolf, Principles of Electronic Tunneling Spectroscopy (Oxford University Press, 1985) [E.L. Wolf, Principy elektronnoy tunnel’noi spektroskopii (Principles of Electronic Tunneling Spectroscopy) (Naukova Dumka, Kiev, 1990)].
- (19) V.V. Ryazanov, V.V. Schmidt, and L.A. Ermolaeva, J. Low Temp. Phys. 45, 507 (1981).
- (20) C.P. Poole, H.A. Farach, and R.J. Creswick, Superconductivity (Academic, San Diego, 1995).
- (21) D.A. Whitney, R.M. Fleming, and R.V. Coleman, Phys. Rev. B 15, 3405 (1977).
- (22) K. Takita and K. Masuda, J. Low Temp. Phys. 58, 127 (1985).
- (23) N.L. Bobrov, V.N. Chernobay, Yu.G. Naidyuk, L.V. Tyutrina, I.K. Yanson, D.G. Naugle, and K.D.D. Rathnayaka, Fiz. Nizk. Temp. 36, 1228 (2010) [Low Temp. Phys. 36, 990 (2010)].
- (24) T.A. Prikhma, ”Properties of MgB2 bulk,” e-print arXiv:0912.4906.
- (25) V.I. Startsev, Lokal’nye osobennosti poverhnostey Fermi i elektronnye transportnye yavleniya v perehodnyh metallah (Local singularities of Fermi surfaces and electron transport phenomena in transition metals), Avtoref. (Author’s abstract) diss.: doktor. fiz.-mat. nauk, Sverdlovsk (1983).
- (26) J.J. Gniwek, J.C. Moulder, and R.H. Kropscot, Proceedings of X International Conference on Low Temperature Physics, Moscow, VINITI, (1967), Vol. 3, p.336.
- (27) A.V. Khotkevitch, ”Spektroskopiya elektron-fononnogo vzaimodeystviya v normal’nyh i sverhprovodyaschih metallicheskih mikrokontaktah (Spectroscopy of electron-phonon interaction in normal and superconducting metallic contacts),” Avtoref (Author’s abstract) diss.: Doktor Fiz.- Mat. Nauk, Khar’kov, 1990.
- (28) N.L. Bobrov, I.K. Yanson, L.F. Rybal’chenko, and V.V. Fisun, Fiz. Nizk. Temp. 13, 1121 (1987) [Sov. J. Low Temp. Phys. 13, 635 (1987)].
- (29) I.K. Yanson, L.F. Rybal’chenko, N.L. Bobrov, and V.V. Fisun, Fiz. Nizk. Temp. 12, 449 (1986) [Sov. J. Low Temp. Phys. 12, 313 (1986)].
- (30) I.K. Yanson, V.V. Fisun, N.L. Bobrov, and L.F. Rybal’chenko, Pis’ma v Zh. Eksp. Teor. Fiz. 45, 405 (1987). [JETP Letters, 45, 543, (1987)].
- (31) N.L. Bobrov, L.F. Rybal’chenko, M.A. Obolenskii, and V.V. Fisun, Fiz. Nizk. Temp. 11, 897 (1987) [Sov. J. Low Temp. Phys. 11, 510 (1987)].
- (32) J. Edwards and R.F. Frindt, J. Phys. Chem. Solids 32, 2217 (1971).
- (33) I.K. Galetich, I.A. Gospodarev, V.I. Grishaev, A.V. Eremenko, K.V. Kravchenko, V.A. Sirenko, and S.B. Feodosyev, Superlattices Microstruct. 45, 564 (2009).
- (34) I.A. Gospodarev, V.V. Eremenko, K.V. Kravchenko, V.A. Sirenko, E.S. Syrkin, S.B. Feodos’ev, Fiz. Nizk. Temp. 3636, 436 (2010) [Low Temp. Phys. 36, 344 (2010)].
- (35) J.L. Feldman, Phys. Rev. B 25, 7132 (1982).
- (36) K. Motizuki, K. Kimura, E. Ando, and N. Suzuki, J. Phys. Soc. Jpn. 53, 1078 (1984).
- (37) G.V. Kamarchuk, A.V. Khotkevitch, A. V. Savitskii, P. Molinie., A. Leblanc, and E. Faulques, Fiz. Nizk. Temp. 35, 687 (2009) [Low Temp. Phys. 35, 539 (2009)].
- (38) I.K. Yanson, V.V. Fisun, N.L. Bobrov, Yu.G. Naidyuk, W.N. Kang, E.-M. Choi, H.-J. Kim, and S.-I. Lee, Phys. Rev. B 67, 024517 (2003).
- (39) I.K. Yanson, Yu.G. Naidyuk, O.E. Kvitnitskaya, V.V. Fisun, N.L. Bobrov, P.N. Chubov, V.V. Ryabovol, G. Behr, W.N. Kang, E.-M. Choi, H.-J. Kim, S.-I. Lee, T. Aizawa, S. Otani, and S.-L. Drechsler, Mod. Phys. Lett. B 17, 657 (2003).
- (40) I.K. Yanson, S.I. Beloborod’ko, Yu.G. Naidyuk, O.V. Dolgov, and A.A. Golubov, Phys. Rev. B 69, 100501 (2004).
- (41) Yu.G. Naidyuk, I.K. Yanson, O.E. Kvitnitskaya, S. Lee, and S. Tajima, Phys. Rev. Lett. 90, 197001 (2003).
- (42) O. De la Pen.a-Seaman, R. de Coss, R. Heid, and K.-P. Bohnen, Phys. Rev. B 82, 224508 (2010).
- (43) A.A. Golubov, J. Kortus, O.V. Dolgov, O. Jepsen, Y. Kong, O.K. Andersen, B.J. Gibson, K. Ahn, and R.K. Kremer, J. Phys.: Condens. Matter 14, 1353 (2002).
- (44) R. Schneider, A.G. Zaitsev, O. De la Pen.a-Seaman, R. de Coss, R. Heid, K.-P. Bohnen, and J. Geerk, Phys. Rev. B 81, 054519 (2010).
- (45) J. Geerk, R. Schneider, G. Linker, A.G. Zaitsev, R. Heid, K.-P. Bohnen, and H.v. Lohneysen, Phys. Rev. Lett. 94, 227005 (2005).
- (46) R. Osborn, E.A. Goremychkin, A.I. Kolesnikov, and D.G. Hinks, Phys. Rev. Lett. 87, 017005 (2001).
- (47) Yu.G. Naidyuk, O.E. Kvitnitskaya, I.K. Yanson, S.-L. Drechsler, G. Behr, and S. Otani, Phys. Rev. B 66, 140301 (2002).
- (48) A.V. Demin and V.A. Khlus, Fiz. Tverd. Tela 32, 3494 (1990). [Sov.Phys.Sol. St., 32, 2026, (1990)].
- (49) I.K. Yanson, N.L. Bobrov, L.F. Rybal’chenko, and V.V. Fisun, Fiz. Nizk. Temp. 9, 1125 (1983) [Sov. J. Low Temp. Phys. 9, 596 (1983)].
- (50) I.K. Yanson, N.L. Bobrov, L.F. Rybal’chenko, and V.V. Fisun, Solid State Commun. 50, 515 (1984).
- (51) I.K. Yanson, N.L. Bobrov, L.F. Rybal’chenko, and V.V. Fisun, Fiz. Tverd. Tela 27, 945 (1985). [Sov.Phys.Sol.St., 27, 1076, (1985)].
- (52) I.K. Yanson, L.F. Rybal’chenko, V.V. Fisun, N.L. Bobrov, M.A. Obolenskii, M.V. Kosmyna, and V.P. Seminozhenko, Fiz. Nizk. Temp. 14, 1121 (1988) [Sov. J. Low Temp. Phys. 14, 639 (1988)].