Theoretical model of structure-dependent conductance crossover in disordered carbon
Abstract
We analyze the effects of bond-aspect ratio on the transport properties of amorphous carbon quasi- structures where structural disorder varies in a very non-linear manner with the effective bandgap. Using a tight-binding approach the calculated electron transmission showed a high probability over a wide region around the Fermi-level for -rich carbon and also distinct peaks close to the band edges for -rich carbon structures. This model shows a sharp rise of the structure resistance with the increase of followed by saturation in the wide bandgap regime for carbon superlattice-like structures and suggests the tuneable characteristic time of carbon-based devices.
Introduction: Amorphous carbon () thin films have long been considered as very important materials for understanding the fundamentals of electronic structure beeman ; robert ; bred ; tersoff ; galli ; godet and mechanical properties kugler ; dasgupta ; mckenzie . Depending on the preparation method, a very diverse nature of microstructure can be formed ranging from diamond-like to graphite-like carbon. Significant efforts have been made to explain the optical properties of films based on the estimated band gap and degree of disorder kelires ; frauen ; tamor ; stumm ; ferrari ; franch ; davis ; cherkashinin ; carey . There are also numerous interesting results showing a structure-dependent conductivity crossover in films alibart ; shimakawa ; helmbold ; sbprb . However, a rigorous theoretical model of electrical transport of films related to the carbon microstructure is yet to be developed that can explain the experimentally observed highly non-linear variation of the conductivity with bond concentration tamor ; davis . In carbon the electronic properties can be strongly influenced by bond disorder which depends on the bond aspect ratio and on the cluster size. Although there is no well defined structure for films they have been described in many studies as a mixture of and hybridized bonds kelires ; frauen ; tamor ; stumm ; ferrari ; franch ; davis . A number of spectroscopic techniques, for example Raman, optical absorption and photoelectron spectroscopy, have confirmed this assertion robert ; dasgupta ; franch ; ferrari . It was found that the size of the clusters greatly influenced the band-gap robert . The optical absorption edge was described by a Gaussian plot based on the normal distribution of cluster size mikulski . Films with low concentrations have also been described as quasi- polymer chains (e.g. trans-polyacetylene) bred ; franch ; cherkashinin ; carey ; guin2 ; mikulski . The effect of filamentary channels on electronic transport has been observed in low-dimensional films and related devices sbnmat . However, no significant theoretical studies have yet been undertaken to investigate the tunneling properties unlike in molecular structures onipko . Based on previous studies we believe that films can be described effectively as a distribution of periodical alternation of the hopping energy and constant energy term. Starting from previous experimental claims for the variation of disorder with the energy gap tamor ; ferrari ; franch , we establish the trend of localization length in a wide range of carbon films based on the calculated transmission coefficients and local density of states (LDOS). In this Letter we propose a Gaussian disorder analogous to previous studies tamor ; ferrari ; franch but in a different manner which is directly connected to the microstructure of films. Since the nature of topological disorder has not been clearly understood from previous works we briefly discuss this effect on electron transmission at the end of this Letter.
Proposed Structure: We develop a quasi -dimensional superstructure, which can be represented by a network of narrow nano-ribbons with a length of for the zigzag and for the armchair directions (Fig. 1). This structure is a quasi-one-dimensional representation of disordered , for similar examples see bred ; Efstathiadis ; Stephan which include some of the essential features specifically clusters and bond angle distortions.There are 4 segments of the structure with widths ranging from to sites depending on the phase percentage. The superstructure is a mix of saturated and conjugated () areas, corresponding to and bonds. The percentage of carbon structures determining the average cluster size robert can be promoted, for example by nitrogen doping. The effects of the lateral dimensions can be taken into account by considering quantization of the wave vector in this direction and modifying the hopping terms in the longitudinal direction.
Methodology: We use a tight-binding Hamiltonian describing electrons confined in ribbons as
| (1) |
where is an on-site energy, which can represent an atomic energy as well as an external potential. and are operators of creation and annihilation of electrons. is a hopping term between site and , which takes into account nearest-neighbor hopping that can be different from site to site reflecting the structural change. We seek the solution of the Schrödinger equation
| (2) |
on the tight-binding lattice with the known eigenvalue , where the unit cell length is fixed to 1. and are the hopping term and on-site energy, respectively, corresponding to the left lead, which can be interpreted as the Fermi energy (), and is an incoming wavevector. The boundary conditions imply that there is only an outgoing plane wave at the right lead, while at the other sites in the tight-binging lattice there are incident and reflected plane waves. Starting from a unique outgoing wave on the right lead , we backpropagate this solution to obtain and using Eq. (2). We get the incoming wave amplitude and define , (outgoing wavevector, ). We calculate the transmission coefficient as a function of incident electron energy, where the transmission coefficient is the ratio of the outgoing to incoming probability current (since vectors may be different for incoming and outgoing waves). Thus, the problem is different from that of finding the eigenvalues as the transmission coefficient is evaluated as a function of energy. The resonance energies determined from transmission maxima correspond to eigen-energies of the system.
The Carbon model: In this model a Hamiltonian with alternating values of the resonance integral produces conduction and valence bands as well as a band gap onipko . For the saturated region we introduce the resonance integral alternation by the hopping terms and . In the presence of the conjugated compound the effective gap decreases because of the electron resonance at energies lying inside the phase band gap. The hopping term corresponding to the phase experiences distortion due to the structural disorder, which reflects the difference in the bond length via the deformation potential. Topological disorder corresponding to the difference in the cluster size affects the resonance conditions via the boundary conditions for quasi-bound states franch . The disorder of the phase is neglected due to its minimal effect on the resonant electron transmission within the gap robert . The broadening effects are mostly due to disorder in the well. As a matter of fact the resonant states have a larger amplitude inside the wells in this range of energies. The leads on the right and left sides are taken as ordered narrow graphite-type strips. The incoming electron energies are given with respect to the electron () on-site energy . Therefore, the position of the valence and conduction phase is not symmetric due to the different on-site energies for and electrons and has a shift corresponding to the difference in these energies, as shown in Fig. 1. The hopping between and hybridized -atoms is extremely significant due to the non-planar geometry of the structure kugler . We use the following tight-binding parameters: on-site energy , transfer integral: , transfer integral , transfer integrals and onipko ; hjort . Fig. 1 shows the levels of hopping terms along with on-site energies for atoms in () and () structures.
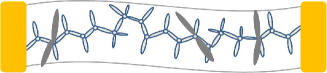
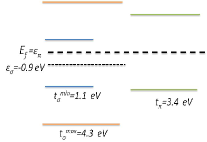
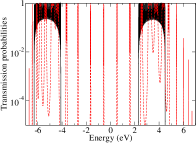
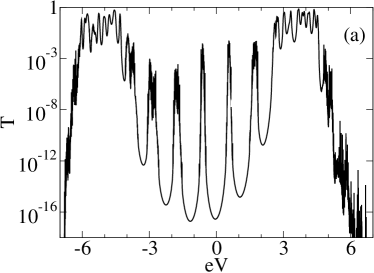
Fig. 1 shows of a pure saturated structure and an ordered structure with of bonding concentration where the zero level corresponds to on-site energy. The numerically calculated band gap and band widths of the saturated structure are and , respectively. For the mixed structure, there are several narrow peaks within the band gap corresponding to quasi-bound states of the “wells”. The peaks are very sharp with a high peak-to-valley ratio. In the case of a symmetric structure, always reaches 1 onipko . When the concentration of structure is high, the peaks are close to the . On the other side of the concentration limit (low phase), the peaks are close to the band edges of structure. Fig. 2(a) shows the first resonance peak position (from the zero energy level) as a function of phase percentage, which has an inverse square dependence on the percentage. Such a dependence reflects a linear increase of the average cluster size and a quadratic decrease of the energy associated with the resonance.
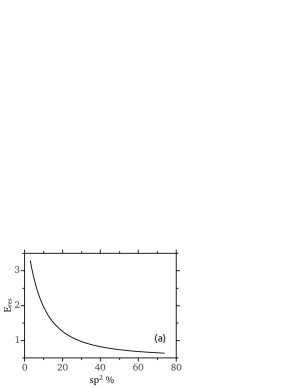
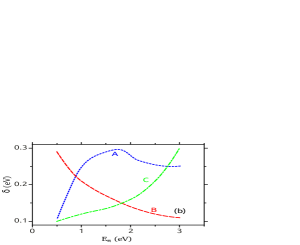
Effect of Disorder: There is a significant effect of structural disorder on the transport properties of the carbon system. Disorder is an inherent micro-structural property of films. It has been suggested that the density of the bonding and anti-bonding states could be represented with a Gaussian distribution franch ; dasgupta ; mikulski . In particular the Urbach energy was described as a function of the width of the DOS peak at although the link between disorder and the broadening parameter was not clear. The disorder parameter , which takes account of bond length (angle) distortions, was calculated previously franch . Micro-structural disorder is broadly separated into structural and topological disorder although the later only applies for a large clusters. In this Letter a typical hopping disorder parameter for a Gaussian distribution of the hopping term is shown in Fig. 2(b) for 3 cases, A, B and C as a function of , which covers the major possible behaviors of disorder in carbon structures. Models B and C are suggestions for the behavior of the disorder parameter based on the assumption that the disorder parameter can either increase or decrease with the corresponding to either rich or rich structures. The values of the disorder parameter for model A can be extracted from a number of experiments (e.g., Raman -peak linewidth) tamor ; franch ; ferrari and we believe it is the result of two competing processes (B and C). On this basis, we have determined the behavior of the disorder parameter as a function of . We therefore focus on model A as it corresponds to the physical nature of systems. A number of percentages were chosen to cover a wide range. The corresponding values (and hence corresponding values for ) were determined based on the relationship between and . We found that the values of were very close to the values of . Here is the peak-to-peak energy spacing of bonding and antibonding DOS above and below the franch . For case A, the disorder reaches its maximum at about , followed by a slight decrease. This is an attribute of the structural relaxation, which occurs (also for case B) when clusters become relatively large robert ; bred . For case C the disorder increases sharply with corresponding to the rise of phase content. In our further calculations we associate with the energy of the first (from zero) resonance peak, . The proposed non-linear graph (case A) showed a significantly different trend of and localization length compared with the two other cases where a continuous decrease (B) or increase (C) of with is considered.

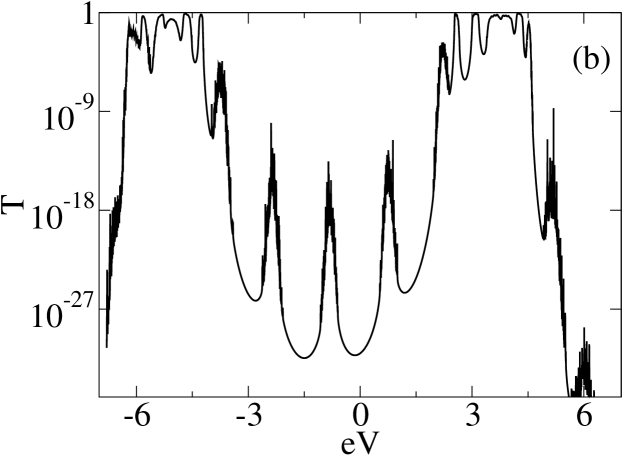
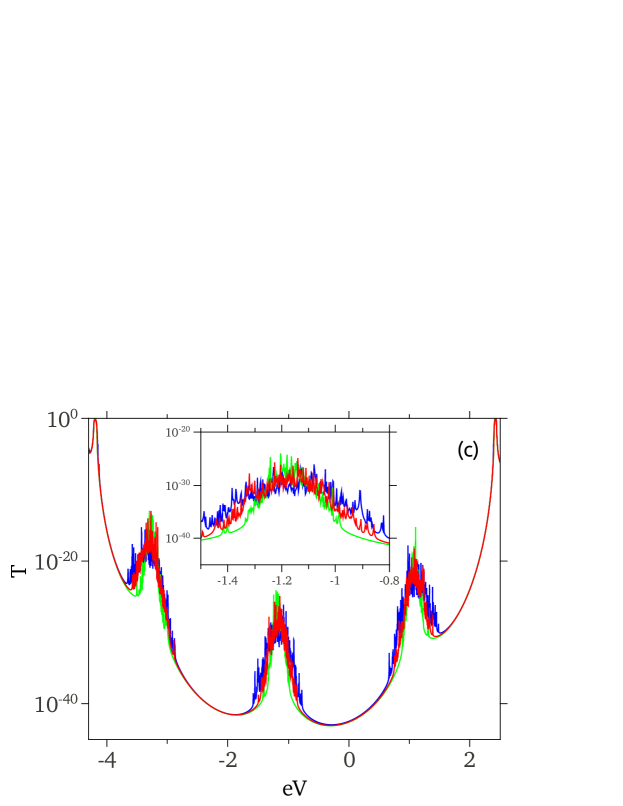
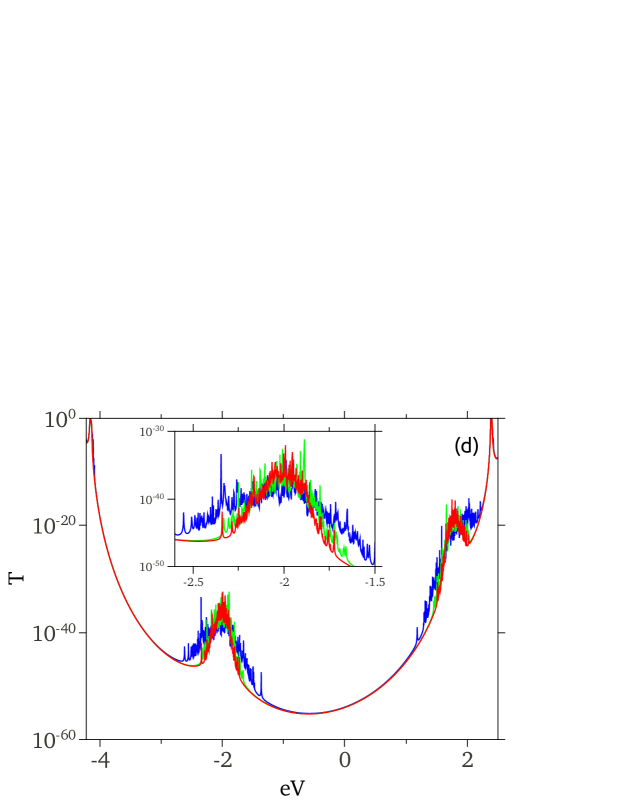
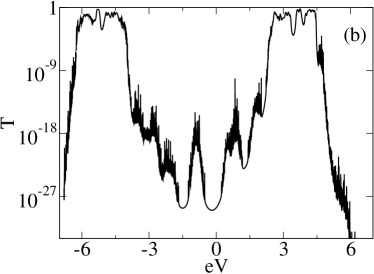
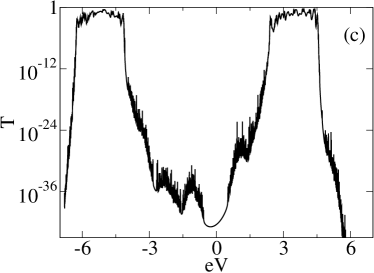
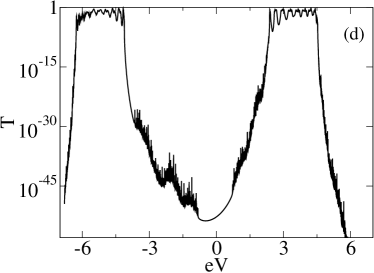
In Fig. (3) (a) we show for bond concentration, which corresponds to and Gaussian disorder , averaging the values over a set of 500 runs. Other cases are shown in Fig. 3 (b) , , , (c) , , and (d) , , . With the decrease of bond concentration and increase of disorder in model A, we observe an increase in the value (the effective band gap), broadening of the peak width and a decrease in peak-to-valley ratio. With further decrease of bond concentration, the resonance peaks move closer to the band gap and finally disappear. Models A and C show significant broadening of the resonant peaks compared to case B for low since disorder is large (see Fig. 3(c) and (d), insets) although it is very similar for all cases for high . At large percentages the transmission through the structure is high therefore structural effects only slightly influence the transmission coefficient. When the percentage is low, the transmission is also low hence even slight structural changes have a large effect on .
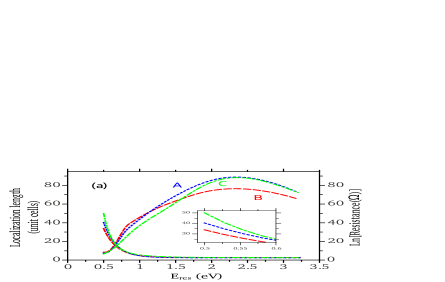
The disorder induces localization of the wave function within the structure and the localization length is expressed as , where is the length between leads used in the Landauer formula for calculating the resistance guin2 . At small energies is longer for case A and C than for case B because the structure is more transparent at resonant energies for lower disorder (Fig.4(a), lower curves). The localization length decreases sharply for all 3 cases till reaches the value of about with a further saturation showing an exponential behavior. The resistance behaves oppositely to the localization length (Fig.4(a), upper curves). At small energies the resistance is smallest for case C and largest for case B following the distortion parameter dependence. The structural resistance increases till followed by a slight decrease at higher energies in the natural logarithm scale. This value is related to the mobility edge- as the disorder parameter increases, the transmission maxima shift away from towards the mobility edge. The lifetime of resonant states therefore decreases (the full width at half maximum (FWHM) decreases). At large energies it is greater for case A and C (almost coincide) because of the larger distortion values. From this analysis it is revealed that the tunnel conductance can be improved in -rich carbon for model C and also in -rich carbon for model B. Whereas for models A the conductance can vary as intermediately between model B and C. Although the tunnel resistance increases initially in the low energy region it can be controlled for a wide band gap carbon structure. In practice the size of the clusters can be controlled to some extent through processes such as annealing or irradiation hence the band gap can be controlled to some extent. Nitrogen doping (discussed below) is also a possibility. These results explain the initial increase of resistance of tetrahedral () films incorporated with a small amount of nitrogen followed by a decrease for high nitrogen (or ) concentration davis .
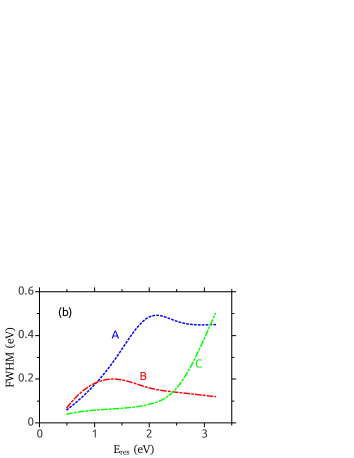
A comparative study of the FWHM for cases A, B and C showed a significant difference not only in their absolute values but also in the their trends as a function of energy. For case A, the FWHM increases from low energy followed by a saturation at energies above 2.5 . For case B, the FWHM decreases beyond 1.5 (due to decrease of disorder). For case C, the FWHM increases continuously above 2.5 . The other factors which effect the FWHM are the incoming energy and the width of the “barrier”. A higher energy and smaller width increase the peak width due to the higher transparency of the structure for an incoming wave. The value of the FWHM, characterizing an average quasi-bound state lifetime at a particular energy, approaches saturation in the high limit. The width of the resonant peaks is proportional to the characteristic time of resonant states therefore as the disorder increases, the FWHM of resonant peaks and consequently the characteristic time of resonant states also increases. At the same time the amplitude of transmission maxima decreases rapidly. The conductance crossover occurs as with further decrease of the bond concentration the resonant peaks shift towards the mobility edge and the characteristic time therefore decreases with the resistance decreasing accordingly. The FWHM of the resonant peaks saturate at very low bond concentration but the resistance does not saturate as the amplitude of the resonance peaks increases as the peaks approach the mobility edge. These results clearly establish the specific effect of the non-linear model A, which shows the tuneable speed of carbon devices from the slow to fast regime as the increase in these structures.
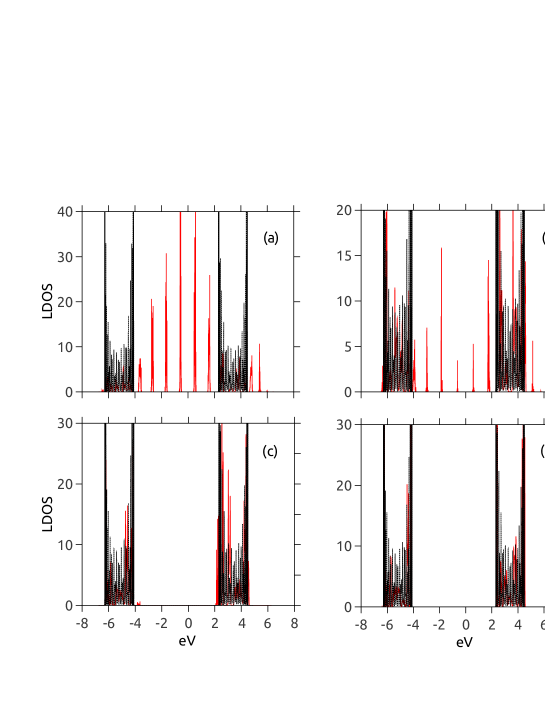
The structural change for case A is also reflected in the LDOS accompanied by the peak position change and broadening. Fig. (5) shows the LDOS at the central cite for structures with different bond concentrations. At a high concentration (Fig. 5 (a)) there are several high LDOS peaks inside . As the concentration decreases, LDOS peaks decrease being comparable in amplitude to LDOS corresponding to the bands (Fig. 5 (b)). Finally, when the bond concentration is less than the LDOS peaks inside become negligible compared to LDOS outside (Fig. 5 (c) and (d)). Also, the LDOS peaks move from the zero energy position with the conjugated phase decrease, effectively opening the gap. The broad features of LDOS suggest the possibility for hopping transport in these structures, which is commonly observed in diamond-like carbon films robert ; helmbold ; sbprb . On the other hand, the high LDOS filling the -gap region explains the metallic conduction in graphitic carbon films. Hence the observed conductance crossover in films with the increase of (or ) can be explained by the change of the characteristic time of the resonant states sbnmat .
 |
 |
 |
 |
Besides the structural disorder we attempt to find the role of topological disorder on the transport properties of the structure. We know that topological disorder is more prominent in two-dimensional structures e.g. large clusters however, the effects can also be simulated in quasi-one dimensional (small clusters) structures. In the topologically disordered case for carbon superlattices or heterostructures, non-uniform cluster sizes were distributed throughout the system in contrast to the non-topologically disordered case where all clusters have the same size. Thus, it corresponds to so-called Anderson vertical disorder. The disorder parameter was determined using model A. As it can be seen from the Fig. 6, the topological disorder results in the decrease of the peak height and increase of the peak width and has a greater effect on the peaks located further from the Fermi level. The effect is more significant for structures with lower concentration, so the relative change in the quasibound energy levels is high. In addition to that, new minor peaks appear in when the difference in energy levels induced by topological disorder is larger than the hopping structural disorder parameter. Topological disorder modifies the resonant tunneling conditions, changing the resonant energy conditions of consecutive wells resulting in a mismatch of the resonant levels. The amplitude of transmission peaks at resonant energies therefore decreases and the resonant peaks spread out with energy as resonance no longer occurs at a sharply defined energy. A resonance peak splits in subpeaks corresponding to the cluster number (4 in this work), where topological characteristic energy splitting is proportional to , where and are the average cluster size and its characteristic variation. When is larger than the characteristic structural disorder variation determined via deformation potential as , where is the deformation potential and is the bond length variation, the subpeaks are distinguishable. With increasing structural disorder the subpeaks start to spread out and finally overlap when becomes smaller than with the elimination of the distinct subpeaks features due to the fact that the number of clusters is much smaller than the number of sites. The resonant peaks can therefore be tuned by disorder of both types which can be controlled to some extent experimentally through annealing or irradiation of the films sb-nexafs . Based on the bond length distribution included in the model, different ring structures e.g. five fold and seven fold symmetry, additional so-called topological disorder can be included subject to further study.
Conclusion: In this Letter, the importance of the non-linear disorder vs. energy model (case A), an intermediate to uniform increase and decrease of disorder, is established. The theoretical analysis of this experimentally supported model discovers the possibility for a relative increase of the tunnel conductance in -rich carbon due to the appearance of resonant transmission peaks close to the bands. Nitrogen doping, for example, could be used to vary the micro-structure of films as nitrogen incorporation increases the ratio davis ; sb-nexafs . The nitrogen concentration also influences the disorder chimowa . Nitrogen doping is therefore not the same as conventional doping however it can still be exploited to modify the conductivity of films davis . In this regard the result of the present study can be extended for doped carbon structures. A detailed study of nitrogen incorporation in structures has recently been carried out based on a model related to this work katkov . The lifetime of electrons can be nearly constant over a large range of in carbon structures having a wide bandgap energy. Since the intensity and position of the resonant peaks can be tuned by the to ratio and associated disorder under this model, we can effectively predict the nano-electronic device properties in a wide range of undoped and doped carbon structures. This model can also explain the origin of observed resonant features in multi-layered carbon systems sbnmat .
The work was supported by the URC(WITs) and the NRF(SA) under the Nanotechnology Flagship Project. We would like to thank R. McIntosh for discussion.
References
- (1) D. Beeman, J. Silverman, R. Lynds, and M. R. Anderson, Phys. Rev. B 30, 870 (1984).
- (2) J. Robertson and E. P. O’Reilly, Phys. Rev. B 35, 2946 (1986).
- (3) J. L. Bredas and G. B. Street, J. Phys. C, 18, 651 (1985).
- (4) J. Tersoff, Phys. Rev. Lett. 61, 2879 (1988).
- (5) G. Galli, R. M. Martin, R. Car, and M. Parrinello., Science 250, 1547 (1990).
- (6) C. Godet, Diamond Relat. Mater. 12, 159 (2003).
- (7) S. Kugler and I. Laszlo, Phys. Rev. B 39, 3882(1989).
- (8) D. Dasgupta, F. Demichelis, C. F. Pirri, and A. Tagliaferro, Phys. Rev. B 43, 2131 (1991).
- (9) D. R. McKenzie, D. Muller, and B. A. Pailthorpe, Phys. Rev. Lett. 67, 773 (1991).
- (10) P. C. Kelires, Phys. Rev. Lett. 68, 1854 (1992).
- (11) Th. Frauenheim, P. Blaudeck, U. Stephan, and G. Jungnickel, Phys. Rev. B 48, 4823 (1993).
- (12) M. Tamor and W. Vassel, J. Appl. Phys. 76, 3823 (1994).
- (13) P. Stumm, D. A. Drabold, and P. A. Fedders, J. Appl. Phys. 81, 1289 (1997).
- (14) A. C. Ferrari and J. Robertson, Phys. Rev. B 61, 14095 (1999).
- (15) G. Fanchini and A. Tagliaferro, Appl. Phys. Lett. 85, 730 (2004).
- (16) G. Cherkashnin, O. Ambacher, T. Sciffer, and G. Schmidt, Appl. Phys. Lett. B 88, 172114 (2006).
- (17) J. D. Carey and S. R. P. Silva, Phys. Rev. B 70, 235417 (2004).
- (18) J. Robertson, and C. A. Davis, Diamond. Relat. Mater. 4, 441 (1995).
- (19) F. Alibart, M. Lejeune, O. Durand Drouhin, K. Zellama, and M. Benlahsen, J. Appl. Phys. 108, 053504 (2010).
- (20) K. Shimakawa and K. Miyake, Phys. Rev. Lett. 61, 994 (1988).
- (21) A. Helmbold, P. Hammer, J. U. Thiele, K. Rohwer and D. Meissner, Philos. Mag., B, 72, 335 (1995).
- (22) S. Bhattacharyya, Phys. Rev. B 77, 233407 (2008).
- (23) P. Mikulski, J. Patyk, and F. Rozploch, J. Non-Cryst. Solids 176, 230 (1994).
- (24) I. Martin and Ya. M. Blanter, Phys. Rev. B 79, 235132 (2009).
- (25) S. Bhattacharyya, S. J. Henley, E. Mendoza, L. Gomez-Rojas, J. Allam and S. R. P. Silva, Nature Materials 5, 19 (2006).
- (26) A. Onipko, Phys. Rev. B 59, 9995 (1998).
- (27) H. Efstathiadis, Z. Akkerman, and F. W. Smith, J. Appl. Phys. 79, 2954 (1996).
- (28) U. Stephan, Th. Frauenheim, P. Blaudeck, and G. Jungnickel, Phys. Rev. B 50, 1489 (1994).
- (29) M. Hjort and S. Stafström, Europhys. Lett. 46, 382 (1999).
- (30) S. Bhattacharyya, M. Lubbe, P. R. Bressler, D. R. T. Zahn, and F. Richter, Diamond. Relat. Mater. 11, 8 (2000).
- (31) G. Chimowa, D. Churochkin, and S. Bhattacharyya, Europhys. Lett. in press (2012).
- (32) M. V. Katkov and S. Bhattacharyya, J. Appl. Phys. 111, 123711 (2012).