A new scaling relation for H ii regions in spiral galaxies:
unveiling the true nature of the mass-metallicity relation⋆
Abstract
We demonstrate the existence of a local relation between galaxy surface mass density, gas metallicity, and star-formation rate density using spatially-resolved optical spectroscopy of \hhregions in the local Universe. One of the projections of this distribution, –the local mass-metallicity relation– extends over three orders of magnitude in galaxy mass density and a factor of eight in gas metallicity. We explain the new relation as the combined effect of the differential radial distributions of mass and metallicity in the discs of galaxies, and a selective star-formation efficiency. We use this local relation to reproduce –with remarkable agreement– the total mass-metallicity relation seen in galaxies, and conclude that the latter is a scale-up integrated effect of a local relation, supporting the inside-out growth and downsizing scenarios of galaxy evolution.
1 Introduction
The existence of a strong correlation between stellar mass and gas-phase metallicity in galaxies is a well known fact (Lequeux et al., 1979). These parameters are two of the most fundamental physical properties of galaxies, both directly related to the process of galaxy evolution. The mass-metallicity (-Z) relation is consistent with more massive galaxies being more metal-enriched. It was established observationally by Tremonti et al. (2004, hereafter T04), who found a tight correlation spanning over 3 orders of magnitude in mass and a factor of 10 in metallicity, using a large sample of star-forming galaxies up to z 0.1 from the Sloan Digital Sky Survey (SDSS). The -Z relation appears to be independent of large-scale environment (Mouhcine et al., 2007) and has been established at all accessible redshifts (e.g. Savaglio et al., 2005; Erb et al., 2006; Maiolino et al., 2008).
Considerable work has been devoted to understanding the physical mechanisms underlying the -Z relation. The proposed scenarios to explain its origin can be broadly categorized as: 1) the loss of enriched gas by outflows (T04; Kobayashi et al. 2007); 2) the accretion of pristine gas by inflows (Finlator & Davé, 2008); 3) variations of the initial mass function with mass (Köppen et al., 2007); 4) selective star formation efficiency or downsizing (Brooks et al., 2007; Ellison et al., 2008; Calura et al., 2009; Asari et al., 2009); or a combination of them. Recent studies also show evidence of a relation with star formation rate (SFR) inferring a fundamental -Z-SFR relation (hereafter FMR, Lara-López et al., 2010; Mannucci et al., 2010; Yates et al., 2012).
As yet, there has been no major effort to test the -Z relation using spatially resolved information. The most likely example might be ascribed to Edmunds & Pagel (1984) and Vila-Costas & Edmunds (1992) who noticed a correlation between surface mass density and gas metallicity in a number of galaxies. Nowadays, the imaging spectroscopy technique can potentially prove key to understanding many of the systematic effects that hamper the role of the distribution of mass and metals in galaxies. In this work, we use integral field spectroscopy (IFS) observations of a sample of nearby galaxies to demonstrate: i) the existence of a local -Z-star-formation relation; and ii) how the global -Z relation seen in galaxies can be reproduced by the presence of the local one. We present convincing evidence that the observed -Z relations represent a simple sequence in astration.
2 Data sample and analysis
The study was performed using IFS data of a sample of nearby disc galaxies, part belonging to the PINGS survey (Rosales-Ortega et al., 2010), and a sample of face-on spiral galaxies from Mármol-Queraltó et al. (2011) as part of the feasibility studies for the CALIFA survey (Sánchez et al., 2012). The observations were designed to obtain continuous coverage spectra of the whole surface of the galaxies. The final sample comprises 38 objects, with a redshift range between 0.001-0.025. Although this sample is by no means a statistical subset of the galaxies in the local Universe, it is a representative sample of face-on, mostly quiescent, spiral galaxies at the considered redshift range. They were observed with the PMAS spectrograph (Roth et al., 2005) in the PPAK mode (Verheijen et al., 2004; Kelz et al., 2006) on the 3.5m telescope in Calar Alto with similar setup, resolutions and integration times, covering their optical extension up to 2.4 effective radii within a wavelength range 3700-7000 Å. Data reduction was performed using r3d (Sánchez, 2006), obtaining as an output a datacube for each galaxy, with a final spatial sampling between 1-2 arcsec/pixel, which translates to a linear physical size between a few hundreds of parsecs to 1 kpc (depending on the size of the object). Details on the sample, observing strategy, setups, and data reduction can be found in Rosales-Ortega et al. (2010), and Mármol-Queraltó et al. (2011).
The \hhregions in these galaxies were detected, spatially segregated, and spectrally extracted using HIIexplorer (Sánchez et al., 2012b). We detected a total of 2573 \hhregions with good spectroscopic quality. This is by far the largest spatially-resolved, nearby spectroscopic \hhregion survey ever accomplished. Note that for the more distance galaxies the segregated \hhregions may comprise a few classical ones, i.e. \hhaggregations; which may not be useful to analyze additive/integrated properties as in individual \hhregions (e.g. H luminosity function), but are perfectly suited for the study of line ratios and chemical abundances. The emission lines were decoupled from the underlying stellar population using fit3d (Sánchez et al., 2007), following a robust and well-tested methodology (Rosales-Ortega et al., 2010; Sánchez et al., 2011). Extinction-corrected, flux intensities of the stronger emission lines were obtained and used to select only star-forming regions based on typical BPT diagnostic diagrams (Baldwin et al., 1981) using a combination of the Kewley et al. (2001) and Kauffmann et al. (2003) demarcation curves. Our final sample comprises 1896 high-quality, spatially-resolved \hhregions/aggregations of disc galaxies in the local Universe. Details on the procedure can be found in Sánchez et al. (2012b).
Gas-phase oxygen abundances were estimated using the O3N2 calibrator (Pettini & Pagel, 2004), based on the [O iii], H, [N ii], and H emission lines. We use this indicator because it is less dependent on dust attenuation and we could use the whole \hhregion sample (given the lack of [O ii] 3727 in some galaxies due to redshift). We used the prescriptions given by Bell & de Jong (2001) to convert colors into a -band mass-to-light ratio () to derive the (luminosity) surface mass density (, M⊙ pc-2) within the area encompassed by our IFS-segmented \hhregions. The and -band surface brightness within the considered areas were derived directly from the (emission-line free) IFS data. The estimated error in the derived is 0.25 dex, taking into account the error in the flux calibration of our IFS dataset (Rosales-Ortega et al., 2010; Mármol-Queraltó et al., 2011), and the expected uncertainty of the Bell & de Jong (2001) formulation. The relation between the mass surface density and radius was checked by normalizing the mass profile by the effective radius, finding a similar slope for all galaxies closer to unity, i.e. the mass profile follows an exponential law which is what is expected for disc galaxies (e.g. Bakos et al., 2008). Furthermore, we compared our radial mass profiles with the more sophisticated -band derived profiles of those common galaxies in our sample with the DiskMass Survey (Bershady et al. 2010; Martinsson 2011, PhDT) finding an agreement within 20%, strengthening the validity of our derived masses.
3 The local -Z relation
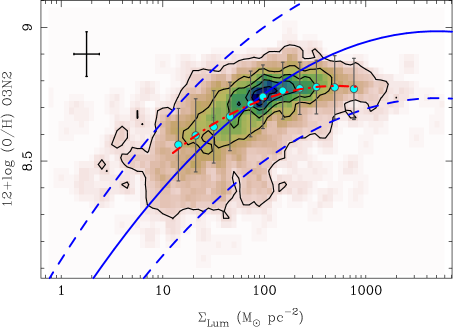
The left-panel of Fig. 1 shows the striking correlation between the local surface mass density and gas metallicity for our sample of nearby \hhregions, i.e. the local -Z relation, extending over 3 orders of magnitude in and a factor 8 in metallicity. As in the case of the global -Z relation (e.g. T04, ), the correlation is nearly linear for lower , flattening gradually at higher values. Also remarkable is the tightness of the correlation, the 1 scatter of the data about the median is 0.14 dex. The notable similarity with the global -Z relation can be visually recognised with the aid of the blue-lines which stand for the T04 fit (0.2 dex) to the global -Z relation, shifted arbitrarily both in mass (5 mag, to account for the difference in size between galaxies and \hhregions) and metallicity (0.15 dex, due to the well-known effect of metallicity scale) to coincide with the peak of the \hhregion -Z distribution, which clearly follows the T04 relationship. With this offset, the local -Z values stand within 90% of the 95% range of the T04 relation. A polynomial fit of the vs. metallicity relation yields:
| (1) | |||||
valid over the range . We obtain the same shape of the relation (and similar fit) if we adopt the R23 metallicity calibration of T04, but with a higher scatter (20%) due to the lowest number of \hhregions in our sample with the [O ii] 3727 line. Other typical calibrations were tested finding similar results (e.g. N2 Denicoló et al., 2002), i.e. the scale of the relation changes when using different indicators, but the overall, qualitative shape does not change.
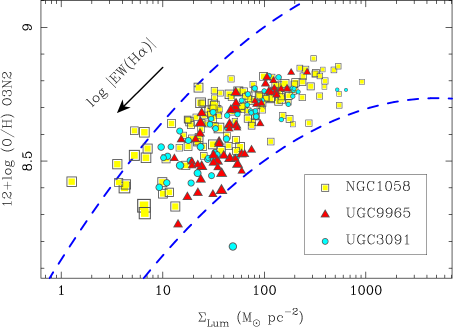
Note that the local -Z relation holds for individual galaxies with a large-enough dynamical range in and metallicity to cover the whole parameter space of the relation, i.e. it is indeed a local relationship. This is shown in the right-panel of Fig. 1, displaying the local -Z relation for the \hhregions of three galaxies in our sample at different redshifts. For the closest galaxy (NGC 1058, z0.0017), the relationship holds for 3 mag in , and even with the loss of spatial resolution at higher redshifts the relation persists over a large dynamic range.
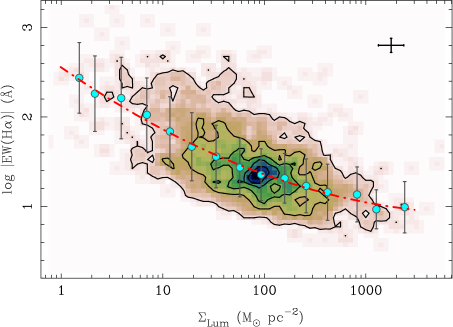
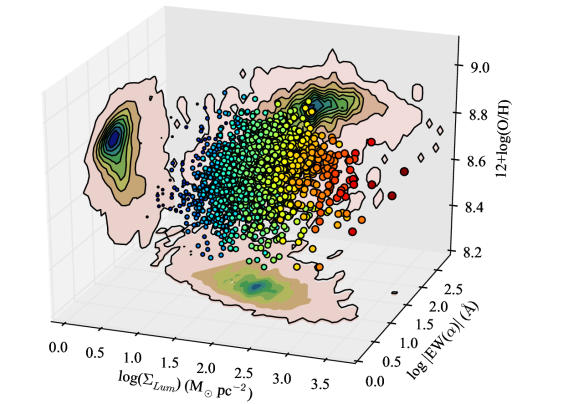
In addition, we find the existence of a more general relation between mass surface density, metallicity, and the equivalent width of H, defined as the emission-line luminosity normalized to the adjacent continuum flux, i.e. a measure of the SFR per unit luminosity (Kennicutt, 1998). This functional relation is evident in a 3D space with orthogonal coordinate axes defined by these parameters, consistent with EW(H) being inversely proportional to both and metallicity, as shown in Fig. 1. The projection of the local -Z-EW(H) relation on the planes defined in this 3D space correspond to the local -Z, -EW(H), and metallicity-EW(H) relations. Fig. 3 shows the projection of EW(H) as a strong and tight function of extending over more than 3 orders of magnitude. The projection on the EW(H) vs. metallicity plane shows an existent but weaker correlation.
4 The global -Z relation
In order to test whether the global -Z relation observed by T04 using SDSS data is a reflection (aperture effect) of the local \hhregion mass-density vs. metallicity relation, we perform the following exercise. We simulate a galaxy with typical and values drawn from flat distributions in magnitude (15 to 23) and colour (0.41). A redshift is assumed for the mock galaxy, drawn from a Gaussian distribution with mean 0.1 and , with a redshift cut in order to resemble the SDSS T04 distribution. The mass of the galaxy is derived using the integrated -band magnitudes, colours and the average ratio following Bell & de Jong (2001). The effective radius of the mock galaxy is estimated using the well-known luminosity-scale relation (e.g. Brooks et al., 2011) assuming a normal standard deviation of 0.3 dex (Shen et al., 2003). Once the mass and effective radius are known, the surface brightness at the center of the mock galaxy is derived assuming an exponential light distribution. Then, the metallicity is calculated at different radii up to an aperture equal to the SDSS fiber (3 arcsec) in 100 bins using Eq. 1, i.e. the metallicity that corresponds to the mass density surface at each bin. The metallicity assigned to the mock galaxy is the mean value determined within the aperture, assuming an error equal to the standard deviation of the derived distribution plus a systematic error of 0.1 dex, intrinsic to the derivation of the metallicity. We used the O3N2 metallicity conversion by Kewley & Ellison (2008, hereafter K08) to convert to the T04 base. The process is repeated over 10,000 times in order to obtain a reliable distribution in the mass and metallicity of the mock galaxies.
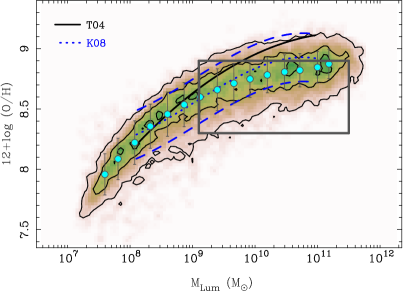
Fig. 4 shows the result of the simulation, i.e. the distribution of the mock galaxies in the -Z parameter space. We reproduce the overall shape of the global -Z relation assuming a local -Z relation and considering the aperture effect of the SDSS fiber, over 5 orders of magnitude in mass and 1.5 in metallicity. The correspondence can be clearly seen by comparing the distribution of points with the overlaid lines corresponding to the T04 fit (black) and the K08 0.2 dex relation (blue), for which the agreement is extremely good over a wide range of masses. The deviations of the T04 relation at the high-mass end are somewhat expected given that the choice of this metallicity calibrator has a significant effect on the -intercept of the -Z relation (K08). The result is remarkable considering that we are able to reproduce the global -Z relation over a huge dynamical range, using a local -Z relation derived from a galaxy sample with a restricted range in mass (9.2 11.2) and metallicity (8.3 12 +log(O/H) 8.9), indicated by the rectangle shown in Fig. 4.
5 On the origin of the local and global -Z relations
We interpret the local -Z-EW(H) relation as the consequence of a more subtle relation between the mass, metallicity and star formation history with galaxy radius. Galaxies are known to have radial gradients in their physical properties (e.g. Searle, 1971; McCall et al., 1985; Vila-Costas & Edmunds, 1992; Zaritsky et al., 1994; Bell & de Jong, 2000). The fact that gas metallicity increases with mass surface density is just reflecting the existence of radial metallicity gradients and radial surface mass density gradients in spirals. On the other hand, the EW(H) is a parameter that scales with the SFR per unit mass, i.e. the specific SFR (SSFR) and is a proxy of the stellar birthrate parameter -Scalo, which is the ratio of the present to past-average SFR (Kennicutt et al., 1994; Kennicutt, 1998). Multiphase chemical evolution models for spiral discs show that both the distributions of neutral and molecular gas show maxima that move from the center outward through the disc as the galaxy evolves. Accordingly, the maximum of the star formation activity, very high in the central regions at early times, also moves throughout the disc as the gas in the central region is very efficiently consumed. This leads to high present day abundances and low current SSFRs in the center and radial abundance gradients that flatten with time. The location on the disc of the maxima in the gas distributions at the present time, which reflects the degree of evolution, is related to the galaxy morphological type with early type galaxies showing the peak of the distributions outer than late type galaxies, which implies a higher degree of evolution and a flatter galaxy for early type galaxies (Molla et al., 1997; Mollá & Díaz, 2005).
The observed trend agrees qualitatively with this scenario: the inverse gradient of EW(H) vs. or metallicity would reflect an evolutionary sequence across the disc of the galaxies, i.e. lower (inner) values of EW(H) corresponding to lower SSFR, and vice versa. In this scenario, the inner regions of the galaxy form first and faster, increasing the gas metallicity of the surrounding interstellar medium. As the galaxy evolves and grows with time, the star-formation progresses radially, creating a radial metallicity gradients in the disc of spirals. Mass is progressively accumulated at the inner regions of the galaxy, rising the surface mass density and creating a bulge, with corresponding high metallicity values but low SSFR (low EW(H)), i.e. an “inside-out” galaxy disc growth. In such a case, the local -Z relation would reflect a more fundamental relation between mass, metallicity and star-formation efficiency as a function of radius, equivalent to a local downsizing effect.
Following this reasoning, the origin of the global -Z relation can be explained as the combined effect of the existence of the local -Z relation, and (as a second order effect) an aperture bias due to the different covering factors of the SDSS fiber, as suggested by the exercise performed in Sec. 4. On the other hand, although we cannot reproduce the FMR in our simulation given that there is no empirical way of determining a SFR of the mock galaxies, the existence of the FMR could also be interpreted as a scaled-up version of the local -Z-SSFR relation. Furthermore, under the proposed scenario, the flattening of the -Z relation at the high-mass end could be explained as the combined observational effect of: 1) an intrinsic saturation of the enriched gas due to the low SSFR in the inner regions of the galaxies; 2) a deviation from linearity of the abundance gradients in the center of spiral galaxies, i.e. a flattening (or drop) in the metallicity gradient at the innermost radii as suggested by recent works (e.g. Rosales-Ortega et al., 2011; Bresolin et al., 2012; Sánchez et al., 2012b) and predicted from chemical evolution models (Molla et al., 1997); and 3) the depletion of the oxygen emission lines in the optical due to high-efficiency of cooling in high-metallicity (12 + log(O/H) ), low-temperature ( K) \hhregions.
6 Conclusions
By using IFS of a sample of nearby galaxies we demonstrate the existence of a local relation between the surface mass density, gas-phase oxygen abundance and EW(H) in 2000 spatially-resolved \hhregions of the local Universe. The projection of this distribution in the metallicity vs. plane –the local -Z relation– shows a tight correlation expanding over a wide range in this parameter space. A similar behaviour is seen for the EW(H) vs. relation. In both projections, the value of EW(H) is inversely proportional to mass and metallicity. Notably, the local -Z relation has the same shape as the global -Z relation for galaxies observed by T04. We explain the new relation as the combination of: i) the well-known relationships between both the mass and metallicity with respect to the differential distributions of these parameters found in typical disc galaxies, i.e. the inside-out growth; and ii) the fact that more massive regions form stars faster (i.e. at higher SFRs), thus earlier in cosmological times, which can be considered a local downsizing effect, similar to the one observed in individual galaxies (e.g. Pérez-González et al., 2008).
We use the local -Z relation to reproduce the global -Z relation by means of a simple simulation which considers the aperture effects of the SDSS fiber at different redshifts. We conclude that, the -Z relation in galaxies is a scale-up integrated effect of a local -Z relation in the distribution of star-forming regions across the discs of galaxies, i.e. the relationship is not primary, but obtained from the sum of a number of local linear relations (and their deviations) with respect to the galaxy radius. Under these premises, the existence of the FMR in galaxies might be explained by the presence of an intrinsic local -Z-SSFR relation, which relates the distribution of mass, metallicity and SFR across the galaxy discs, driven mainly by the history of star formation, within an inside-out growth scenario.
References
- Asari et al. (2009) Asari, N. V., Stasińska, G., Fernandes, R. C., et al. 2009, MNRAS, 396, L71
- Bakos et al. (2008) Bakos, J., Trujillo, I., & Pohlen, M. 2008, ApJ, 683, L103
- Baldwin et al. (1981) Baldwin, J. A., Phillips, M. M., & Terlevich, R. 1981, PASP, 93, 5
- Bell & de Jong (2000) Bell, E. F., & de Jong, R. S. 2000, MNRAS, 312, 497
- Bell & de Jong (2001) ——. 2001, ApJ, 550, 212
- Bershady et al. (2010) Bershady, M. A., Verheijen, M. A. W., Swaters, R. A., et al. 2010, ApJ, 716, 198
- Bresolin et al. (2012) Bresolin, F., Kennicutt, R. C., & Ryan-Weber, E. 2012, ApJ, 750, 122
- Brooks et al. (2007) Brooks, A. M., Governato, F., Booth, C. M., et al. 2007, ApJ, 655, L17
- Brooks et al. (2011) Brooks, A. M., Solomon, A. R., Governato, F., et al. 2011, ApJ, 728, 51
- Calura et al. (2009) Calura, F., Pipino, A., Chiappini, C., et al. 2009, A&A, 504, 373
- Denicoló et al. (2002) Denicoló, G., Terlevich, R., & Terlevich, E. 2002, MNRAS, 330, 69
- Edmunds & Pagel (1984) Edmunds, M. G., & Pagel, B. E. J. 1984, MNRAS, 211, 507
- Ellison et al. (2008) Ellison, S. L., Patton, D. R., Simard, L., et al. 2008, ApJ, 672, L107
- Erb et al. (2006) Erb, D. K., Shapley, A. E., Pettini, M., et al. 2006, ApJ, 644, 813
- Finlator & Davé (2008) Finlator, K., & Davé, R. 2008, MNRAS, 385, 2181
- Kauffmann et al. (2003) Kauffmann, G., Heckman, T. M., Tremonti, C., et al. 2003, MNRAS, 346, 1055
- Kelz et al. (2006) Kelz, A., Verheijen, M. A. W., Roth, M. M., et al. 2006, PASP, 118, 129
- Kennicutt (1998) Kennicutt, R. C. 1998, ARA&A, 36, 189
- Kennicutt et al. (1994) Kennicutt, R. C., Tamblyn, P., & Congdon, C. E. 1994, ApJ, 435, 22
- Kewley et al. (2001) Kewley, L. J., Dopita, M. A., Sutherland, R. S., et al. 2001, ApJ, 556, 121
- Kewley & Ellison (2008) Kewley, L. J., & Ellison, S. L. 2008, ApJ, 681, 1183
- Kobayashi et al. (2007) Kobayashi, C., Springel, V., & White, S. D. M. 2007, MNRAS, 376, 1465
- Köppen et al. (2007) Köppen, J., Weidner, C., & Kroupa, P. 2007, MNRAS, 375, 673
- Lara-López et al. (2010) Lara-López, M. A., Cepa, J., Bongiovanni, A., et al. 2010, A&A, 521, L53
- Lequeux et al. (1979) Lequeux, J., Peimbert, M., Rayo, J. F., et al. 1979, A&A, 80, 155
- Maiolino et al. (2008) Maiolino, R., Nagao, T., Grazian, A., et al. 2008, A&A, 488, 463
- Mannucci et al. (2010) Mannucci, F., Cresci, G., Maiolino, R., et al. 2010, MNRAS, 408, 2115
- Mármol-Queraltó et al. (2011) Mármol-Queraltó, E., Sánchez, S. F., Marino, R. A., et al. 2011, A&A, 534, 8
- McCall et al. (1985) McCall, M. L., Rybski, P. M., & Shields, G. A. 1985, ApJS, 57, 1
- Mollá & Díaz (2005) Mollá, M., & Díaz, A. I. 2005, MNRAS, 358, 521
- Molla et al. (1997) Molla, M., Ferrini, F., & Diaz, A. I. 1997, Astrophysical Journal v.475, 475, 519
- Mouhcine et al. (2007) Mouhcine, M., Baldry, I. K., & Bamford, S. P. 2007, MNRAS, 382, 801
- Pérez-González et al. (2008) Pérez-González, P. G., Rieke, G. H., Villar, V., et al. 2008, ApJ, 675, 234
- Pettini & Pagel (2004) Pettini, M., & Pagel, B. E. J. 2004, MNRAS, 348, L59
- Rosales-Ortega et al. (2011) Rosales-Ortega, F. F., Díaz, A. I., Kennicutt, R. C., et al. 2011, MNRAS, 415, 2439
- Rosales-Ortega et al. (2010) Rosales-Ortega, F. F., Kennicutt, R. C., Sánchez, S. F., et al. 2010, MNRAS, 405, 735
- Roth et al. (2005) Roth, M. M., Kelz, A., Fechner, T., et al. 2005, PASP, 117, 620
- Sánchez (2006) Sánchez, S. F. 2006, AN, 327, 850
- Sánchez et al. (2007) Sánchez, S. F., Cardiel, N., Verheijen, M. A. W., et al. 2007, MNRAS, 376, 125
- Sánchez et al. (2012) Sánchez, S. F., Kennicutt, R. C., de Paz, A. G., et al. 2012, A&A, 538, 8
- Sánchez et al. (2012b) Sánchez, S. F., Rosales-Ortega, F. F., Marino, R. A., et al. 2012, A&A, submitted
- Sánchez et al. (2011) Sánchez, S. F., Rosales-Ortega, F. F., Kennicutt, R. C., et al. 2011, MNRAS, 410, 313
- Savaglio et al. (2005) Savaglio, S., Glazebrook, K., Borgne, D. L., et al. 2005, ApJ, 635, 260
- Searle (1971) Searle, L. 1971, ApJ, 168, 327
- Shen et al. (2003) Shen, S., Mo, H. J., White, S. D. M., et al. 2003, MNRAS, 343, 978
- Tremonti et al. (2004) Tremonti, C. A., Heckman, T. M., Kauffmann, G., et al. 2004, ApJ, 613, 898
- Verheijen et al. (2004) Verheijen, M. A. W., Bershady, M. A., Andersen, D. R., et al. 2004, AN, 325, 151
- Vila-Costas & Edmunds (1992) Vila-Costas, M. B., & Edmunds, M. G. 1992, MNRAS, 259, 121
- Yates et al. (2012) Yates, R. M., Kauffmann, G., & Guo, Q. 2012, MNRAS, 422, 215
- Zaritsky et al. (1994) Zaritsky, D., Kennicutt, R. C., & Huchra, J. P. 1994, ApJ, 420, 87