The Chandra HRC View of the Sub-arcsecond Structures in the Nuclear Region of NGC 1068
Abstract
We have obtained a high spatial resolution X-ray image of the nucleus of NGC 1068 using the High Resolution Camera (HRC-I) on board the Chandra X-ray Observatory, which provides an unprecedented view of the innermost 1 arcsec radius region of this galaxy. The HRC image resolves the narrow line region into X-ray emission clumps matching bright emission-line clouds in the HST [OIII] 5007 images and allows comparison with sub-arcsec scale radio jet for the first time. Two distinct X-ray knots are revealed at 1.3-1.4 arcsec northeast and southwest of the nucleus. Based on the combined X-ray, [OIII], and radio continuum morphology, we identify the locations of intense radio jet–cloud interaction. The [OIII] to soft X-ray ratios show that some of these clouds are strongly affected by shock heating, whereas in other locations the jet simply thrusts through with no signs of strong interaction. This is further strengthened by the presence of a keV collisionally ionized component in the ACIS spectrum of a shock heated cloud HST-G. We estimate that the kinematic luminosity of the jet-driven shocks is erg s-1, a negligible fraction () of the estimated total jet power.
1 Introduction
NGC 1068 is the brightest prototype Seyfert 2 active galactic nucleus (AGN), and also one of the closest, with a distance of only 14.4 Mpc ( pc; Bland-Hawthorn et al., 1997). This makes NGC 1068 an optimal target to investigate the morphology and kinematics of the different components in the AGN central regions: the infrared-emitting molecular gas, the X-ray obscuring torus, and the ionized gas (e.g., Exposito et al., 2011; Krips et al., 2011; Storchi-Bergmann et al., 2012).
Several detailed studies have been performed at multi-wavelength with the highest spatial resolution instruments available, probing the nuclear region down to scales of the order of, or smaller than 10 pc (e.g., Evans et al., 1991; Capetti et al., 1997; Gallimore et al., 2004; Groves et al., 2004). The picture emerging from these studies is that of a complex circum-nuclear environment (Raban et al., 2009). Previous X-ray studies identified a compact photoionized component, unresolved on scales of 100 pc, emitting the soft X-ray spectrum studied through dispersive grating spectroscopy (Kinkhabwala et al., 2002; Ogle et al., 2003; Evans et al., 2010), and an ionization cone on kpc scales, observed in HST [OIII] images, broadly coincident with an extended X-ray emission region imaged with Chandra ACIS (Young et al., 2001; Ogle et al., 2003).
Besides reporting a general good correspondence between the [OIII] distribution and the X-ray morphology, Young et al. (2001) found that the ACIS-S spectra of several diffuse emission regions could not be fitted with thermal plasma models. Brinkman et al. (2002) and Ogle et al. (2003) demonstrated that the X-ray emission of the centermost region (unresolved with ACIS) and that of a cloud NE of the nucleus is dominated by photoionization. This would also explain the general agreement between X-ray and [OIII] morphology.
While these conclusions are strong, we may be still missing a part of the story. In particular, the radial velocities of the emission lines suggest forces at work within 6″ of the nucleus, accelerating outflows in the central 2″ and then gradual deceleration (Crenshaw & Kraemer, 2000). These motions suggest clouds accelerated by nuclear winds, then decelerating because of interaction with the ambient ISM; these velocities may also reflect the interaction of the radio jets with the ISM (Axon et al., 1998; Ogle et al., 2003). The inner few hundred parsec region is where jet-ISM interactions are expected to be most intensive, but this region has not been investigated in great detail in X-rays. Previous deep Chandra ACIS observations, while providing illuminating X-ray findings, suffered significant photon pileup in the ( pc) nuclear region. Even the extended emission is affected by pileup in the ACIS exposure with a 3.2 s frame time (Young et al., 2001).
In this paper, we report on the X-ray morphology mapped with a resolution of , pc, in the nuclear region obtained from the deconvolved HRC imaging of NGC 1068, which is free from pileup effect. Taking advantage of archival ACIS image with subpixel resolution, we are able to identify X-ray structures with features seen in other wavebands and locations of intense jet-cloud interaction. Detailed imaging and spectral analysis of X-ray emission from the nucleus to galaxy scale will be presented in a forthcoming paper, utilizing all available Chandra ACIS and HRC data.
2 Observations and Data Reduction
NGC 1068 was observed on October 2, 2010, with the Chandra HRC-I (Murray et al., 2000) for 40.18 ks (ObsID 12705, PI: Fabbiano). The nominal pointing was (, ) with 82.9 degree roll angle. The HRC data were reprocessed111http://cxc.harvard.edu/ciao/threads/createL2/ with the Chandra Interactive Analysis of Observations software package (CIAO; version 4.2) tool hrc_process_events222http://cxc.harvard.edu/ciao4.2/ahelp/hrc_process_events.html using Chandra Calibration Database (CALDB) version 4.3.1. The net exposure time was 39.7 ks after screening for brief periods of elevated background. Since there is a known artifact333http://cxc.harvard.edu/ciao4.4/caveats/psf_artifact.html in the Chandra/HRC point spread function (PSF), we have used the CIAO tool make_psf_asymmetry_region to identify its location as precaution. The artifact is in the SE quadrant (position angle [P.A.]87o to 137o), not related to any of the morphological features in NGC 1068 that we resolve and discuss in later sections. The archival ACIS S3 observation (ObsID 370, previously presented in Young et al., 2001) shown in this work was taken on February 22, 2002 with 0.1 s frame time and a total exposure of 1.43 ks. We reprocessed the ACIS data to generate new level 2 file that has the latest calibration and the subpixel resolution algorithm (“EDSER”, Li et al., 2003) applied. To evaluate the accuracy of astrometry, we compared the positions of X-ray point sources to the coordinates from the the Naval Observatory Merged Astrometric Dataset (NOMAD; Zacharias et al., 2004) and derived absolute astrometric accuracy of (1).
3 Imaging and Spectral Analysis
Following our Chandra HRC study of the Seyfert 1 galaxy NGC 4151 (Wang et al., 2009a), we performed image restoration using the expectation through Markov Chain Monte Carlo (EMC2) algorithm (Esch et al., 2004; Karovska et al., 2005). The effectiveness of this method was demonstrated with a number of astronomical imaging studies (Karovska et al., 2005, 2007; Wang et al., 2009a). The Chandra PSF was simulated with the Chandra Ray Tracer (ChaRT444http://cxc.harvard.edu/chart/) using a monochromatic energy at 1 keV (recommended for HRC data; see ChaRT thread noted above). The rays were then projected onto the HRC detector with CIAO tool psf_project_ray adopting a Gaussian blurring to generate the PSF image.
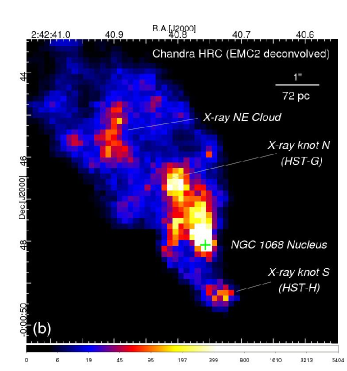
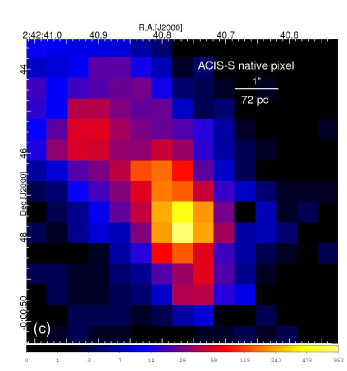
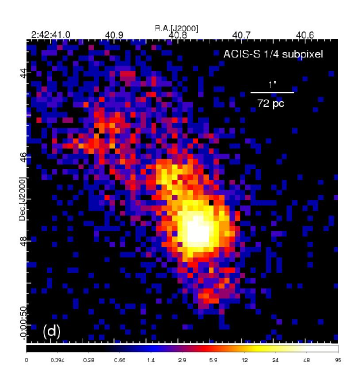
The EMC2 restored (500 iterations) HRC image of the NGC 1068 nuclear region (the central ) is presented in Figure 1, which also shows the raw HRC-I image, and the ACIS-S images at native pixel resolution and at subpixel resolution.
3.1 X-ray Morphology of the Narrow-Line Region
Although all four Chandra images show similar northeast–southwest elongation, finer features are seen in the subpixel rebinned ACIS image, which were not discernible in the raw ACIS image due to undersampling with the native pixels (c.f. Figure 2 in Young et al., 2001). These higher resolution features are also evident in the raw HRC image and more strikingly in the PSF-deconvolved HRC image.
The most probable location of the nucleus is generally accepted to be the VLBI radio source “S1” (Gallimore et al., 1996a; Kishimoto, 1999). We registered our X-ray image so that the X-ray peak emission is coincident with UV peak in (Capetti et al., 1997), and 0.1″ north of S1 (the active nucleus), consistent with an indirect view of the nucleus in the X-rays (obscured by a column density exceeding cm-2, Matt et al., 2000).
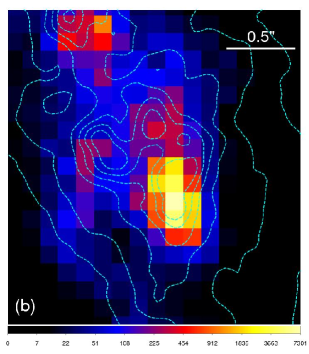
The X-ray emission in the northeast (NE) direction, where the optical extended narrow line region is, shows a cylindrical morphology with regions of apparent X-ray enhancement (“clumps”) and deficit (“bubbles”). The previously identified X-ray emitting “NE cloud” (3″ NE of the nucleus; Young et al., 2001; Ogle et al., 2003) is clearly resolved. Here we focus on the inner 200 pc (3″) scale region that has been poorly studied in the X-rays before and now becomes accessible with the HRC deconvolved image (Figure 1b). The subpixel resolution ACIS image of 0.1 s frame time was not used for deconvolution, because the appropriate model for the energy dependent, subpixel resolution PSF is not yet available and there is still low level (5%) pileup in the nucleus ( counts s-1).
The X-ray emission in the nuclear region is resolved into distinct components in the HRC image, namely a bright nucleus with elongation to the north, and two blobs 0.7 from the nucleus at P.A.6o and P.A.54o, respectively. A bright knot of X-ray emission is uncovered at 1.4″ to the NE of the nucleus at P.A.25o (labelled as “X-ray knot N” in Figure 1b, and throughout the paper referred as “HST-G” following HST features in the optical and avoid inventing new nomenclature, see next section). A similar but fainter feature is located at 1.3″ SW of the nucleus (X-ray knot S, or “HST-H”). These two knots are also clearly present in the ACIS subpixel image (Figure 1d), which shares a great similarity of morphology with the HRC images.
3.2 Comparison with High Resolution [OIII] Image and Radio Maps
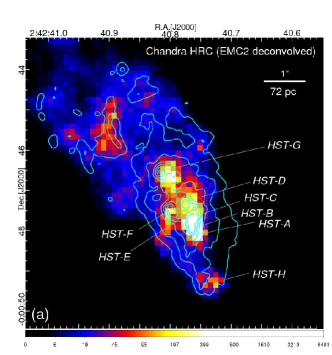
We further compare the rich structures in [OIII]5007 emission line and radio images to the X-ray emission. Figures 2a and 2b show the HRC image overlaid with contours of the [OIII] emission from the HST WFPC2/F502N image presented in Capetti et al. (1997) and the innermost zoom covers 150 pc region (2 arcsec across). The labelled features following the HST clouds naming convention in Evans et al. (1991). Previous ACIS study already showed a general spatial correlation between the two wavebands (Young et al., 2001), the HRC image firmly demonstrates that there is remarkable morphological agreement between the X-ray clumps and the [OIII]5007 emission, even at the smallest spatial scales.
A similar comparison with the VLA A-array 6 cm map (Wilson & Ulvestad, 1983; Gallimore et al., 1996a) is shown in Figure 2c. We find that the X-ray “NE cloud” (Ogle et al., 2003) does not correspond to any enhancement in the radio lobe, although it is slightly offset (1″ to the SW) from a bright radio filament. The newly identified X-ray knot (HST-G) is 0.2″ from the peak of a radio knot, where the collimated radio outflow becomes more diffuse and lobe-like.
The zoom (Figure 2d) shows fine details of the spatial relations with the MERLIN 6 cm features (components NE, C, S1, and S2 in Gallimore et al., 1996a). The X-ray elongation northward of the nucleus follows the linear radio emission between S1 and C, then become faint and spatially anti-correlated with the radio emission after the jet shows significant “bending” at component C (Gallimore et al., 1996a).
3.3 X-ray Spectral Modeling of HST Cloud G
The 0.1 s frame time ACIS image with subpixel resolution clearly resolves HST-G and HST-H (Figure 1d), which are free of pileup. Because of the short exposure (1.4 ks), only the brighter HST-G have enough counts () to attempt spectral fit using photoionization models. The X-ray spectrum was extracted using CIAO tool specextract from a -radius circle centered on the X-ray knot, which was grouped to have a minimum of 15 counts per bin to allow usage of statistics. Spectral modeling was performed following Wang et al. (2011b) with the XSPEC package (version 12.7.1) and photoionization model grids generated by Cloudy (Ferland, 2004, version 08.01). A single ionization (,) component is not adequate to obtain a reasonable fit to the spectrum (reduced ). The addition of an optically thin thermal plasma component (APEC) with the best fit temperature of keV significantly improves the fit (, ; -statistic=9.94 or probability of improvement 99.8%). There is a residual line feature at keV (see Figure 3) that is probably due to OVIII Ly, and can be fit with an additional high ionization component (, ). The probability of improvement over current model is 90%. However, this has little effect on the thermal component. The flux contributed by the thermal component is erg s-1 cm-2 ( erg s-1), which is approximately 30% of the total X-ray emission from cloud G.
4 Discussion
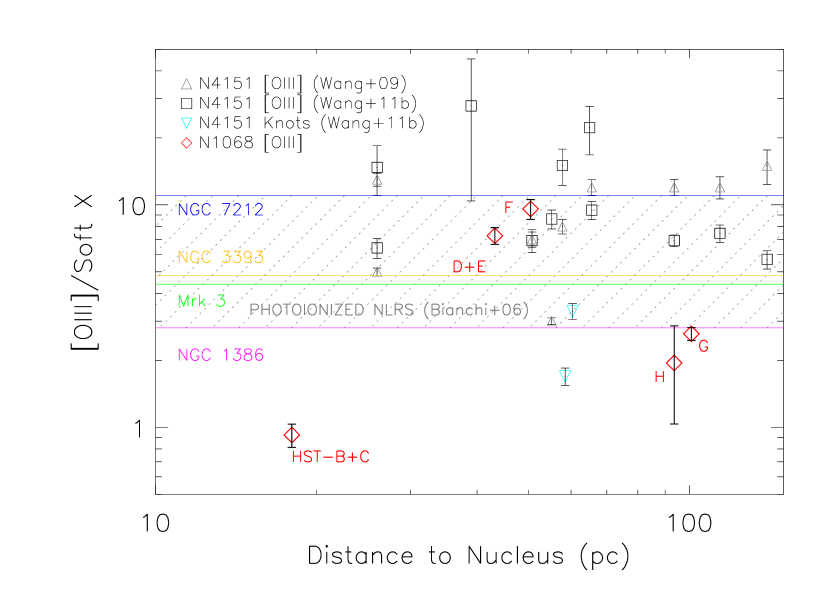
The unprecedented high spatial resolution HRC image of NGC 1068 has enabled us to compare the sub-arcsecond structures of the X-ray emission and those of the HST NLR clouds in the nuclear region, where the ACIS data is affected by pileup. Overall, there is a good correlation between enhancements in [OIII] and X-ray emission (Figure 2a,b) in the nuclear region of NGC 1068, where the grating spectroscopic observations resolve the soft X-ray emission into many lines characterized by photoionization and photoexcitation (e.g., NVII, OVII, OVIII, and NeIX), consistent with previous suggestions that both originate from gas photoionized by the AGN (e.g., Young et al., 2001; Brinkman et al., 2002; Ogle et al., 2003). This general morphological agreement appears to be common for kpc-scale soft X-ray and [OIII] emission in nearby Seyfert galaxies (e.g., Bianchi et al., 2006, 2010; Wang et al., 2011a; Paggi et al., 2012). The ratios between [OIII] and soft X-rays were found to effectively trace the ionization states (e.g., Bianchi et al., 2006; Wang et al., 2009a). Following these studies, we use [OIII]/soft X-ray ratios of different clouds to locate sites of shocks produced in strong jet–cloud interaction, as indicated by low [OIII]/soft X-ray ratios due to enhanced thermal X-ray emission from shock heating (Bicknell et al., 1998; Wang et al., 2009a, 2011b).
Using the calibrated WFPC2 F502N image (Capetti et al., 1997), we measured the [OIII] fluxes for the clouds (Evans et al. 1991) following WFPC2 narrow-band photometry in WFPC2 Data Handbook555http://documents.stsci.edu/hst/wfpc2/documents/handbooks/dhb/wfpc2_cover.html. The 0.5–2 keV X-ray fluxes were measured from counts extracted from the same regions using the HRC image. The central positions (right ascension and declination in J2000) of these clouds and the rectangular regions used to estimate the [OIII] and X-ray fluxes were listed in Table 1. It should be noted that there are finer [OIII] features resolved in the HST image that are not resolved in the X-rays, so these fluxes only reflect the average values for the ionized gas. We assumed the phenomenological model (two-component bremsstrahlung plus power law) for the X-ray emission ( keV and , cm-2; Young et al. 2001) and obtained erg s-1 cm-2 per HRC count s-1 for the flux conversion. In Figure 4 we show the [OIII] to soft X-ray ratio for five distinct cloud features along the jet (Table 1) at various radii to the nucleus (20 pc–100 pc).
We note that three regions (HST-B+C, HST-G, and the previously unlabeled HST-H) show significantly lower [OIII]/X-ray ratio (1) than the typical range spanned by photoionized clouds (3–11 in the Seyfert galaxies observed by Bianchi et al., 2006), implying higher collisional ionization at these locations. We suggest that these clouds are strongly interacting with the jet, and that shocks driven into the obstructing clouds produce thermal X-ray emission. Indeed, our spectral fitting of cloud G revealed presence of keV hot plasma. The remaining two regions (HST-D+E and HST-F), which are clouds that bracket the MERLIN knot “NE” (Gallimore et al., 1996b, Figure 2d), show no evidence of jet-cloud collision. This scenario is consistent with the multi-wavelength morphology of the circum-nuclear region. At the radio knot C, the P.A. of the jet changes from to (Gallimore et al., 1996a); Gallimore et al. (1996b) suggested that it likely results from shock interaction between the radio jet and a dense molecular cloud, which was indeed identified in 2.12m H2(1-0) S1 emission (Müller Sánchez et al., 2009). Similarly, at the clouds HST-G and HST-H, the jet changes into a lobe after driving shocks into these clouds, as shown by our observations. There are other regions also show low [OIII]/X-ray ratios, such as the region between HST-D and HST-G, and a narrow “bar” feature (NW-SE) at the base of the radio lobe. These regions are likely associated with collisional gas as well, although much fainter and diffuse to measure the [OIII] emission.
The kinematics of the ionized gas also suggest jet-cloud impact. The long slit spectroscopy of NGC 1068 with HST FOC (Axon et al., 1998) found that the NLR gas at HST-G is strongly kinematically perturbed and shows velocity systems separated by 1500 km s-1. Crenshaw & Kraemer (2000) show evidence for acceleration of the radio outflow from the nucleus and subsequently deceleration to systemic velocity. The same behavior was seen in the high ionizing potential coronal line region (CLR) gas (Müller-Sánchez et al., 2011), where velocity tomography of coronal lines like [Si VI], suggested a turnover point for the radial acceleration at 80 pc NE from the nucleus, at the position of cloud HST-G, where the jet changes into a lobe. Moreover, the detection of extended highly ionized gas (e.g., [Fe VII]) in NGC 1068 led Rodríguez-Ardila et al. (2006) to the suggestion that shocks related to the outflow could be required to power the line formation.
Last but not least, the spectral modeling of cloud HST-G revealed the presence of keV hot gas. Assuming a spherical symmetry for the gas ( or 36 pc), we can derive the emission measure and electron density for the hot gas (e.g., Wang et al., 2009b). Of most interest, the estimated thermal energy content deposited by the jet-ISM interaction is ergs. Taking the velocity of the fast shocks driven by the jet to be km s-1 (Axon et al., 1998), the relevant timescale is the crossing time for the shocks to move through the 1″ (72 pc) extent of the cloud, yr. If the jet-cloud interaction converts kinematic energy into heating of the hot gas, this implies a kinematic luminosity (or energy injection rate) of erg s-1, which is lower but comparable to the kinematic luminosity measured from the jet-cloud interaction in NGC 4151 ( erg s-1). To put this in the context of the available jet power, we derive the total jet power of NGC 1068, erg s-1, adopting the flux density of Jy at 1.465 GHz (Wilson & Ulvestad, 1983) and the – relation from a sample of radio loud galaxies with X-ray cavities (Cavagnolo et al., 2010). A negligible amount of the jet power () is lost to the ISM during the encounter with the cloud G.
Our Chandra HRC and ACIS results show three locations of intense interaction between the radio jet in NGC 1068 and the NLR clouds in the inner 200 pc: the jet first encounters a dense clump at knot C (HST-B+C), produces a shock front (Gallimore et al., 1996a, b) and changes direction; then it sweeps through between clouds D+E and F with no evidence of interaction; it interacts again with clouds HST-G in the NE and HST-H in the SW, changing morphology and ionization structure (Capetti et al., 1997).
5 Conclusions
We have obtained high spatial resolution X-ray image of the nucleus of NGC 1068 using the HRC, which allows, for the first time, a direct view of the innermost 1 arcsec (72 pc) radius region.
The HRC image resolves the narrow line region into X-ray emission clumps matching bright emission-line clouds in the HST [OIII] 5007 images. Two distinct X-ray knots are revealed at 1.4 arcsec NE and SW of the nucleus. With image deconvolution technique, we resolve sub-arcsec X-ray emission features tracing the collimation and bending of the jet.
Based on the combined X-ray, [OIII], and radio continuum morphology, we identify three locations of radio jet–cloud interaction. The [OIII] to soft X-ray ratios show that these clouds are strongly affected by shock heating, whereas near two clouds the jet simply thrust through with no signs of strong interaction. This is further strengthened by the presence of a keV collisionally ionized component in the ACIS spectrum of the cloud G. We further estimate that the kinematic luminosity (or energy injection rate) of the jet-driven shocks is erg s-1, which shows a negligible amount of the jet power () is lost to the ISM during the jet-cloud interaction.
Our results show that the NGC 1068 radio jet plays a crucial role in shaping the morphology, the kinematics and the ionization structure of the innermost NLR. Recent high spatial resolution studies based on integral-field spectroscopy with Adaptive Optics in the near-IR start to provide velocity fields and trace highly ionized gas in the radial outflows in the NLR of Seyfert galaxies (e.g., Storchi-Bergmann et al., 2010; Müller-Sánchez et al., 2011). As shown in Storchi-Bergmann et al. (2010), [FeII] may be enhanced where jet-induced shocks probably release the Fe locked in grains. We expect to see enhanced [FeII] peaks at the locations of jet-NLR interaction suggested in this work. In addition, the deep ACIS HETG grating observations of NGC 1068 may provide a more detailed picture of the kinematics and ionization of the hot phase ISM in NGC 1068.
References
- Axon et al. (1998) Axon, D. J., Marconi, A., Capetti, A., et al. 1998, ApJ, 496, L75
- Bianchi et al. (2006) Bianchi, S., Guainazzi, M., & Chiaberge, M. 2006, A&A, 448, 499
- Bianchi et al. (2010) Bianchi, S., Chiaberge, M., Evans, D. A., et al. 2010, MNRAS, 405, 553
- Bicknell et al. (1998) Bicknell, G. V., Dopita, M. A., Tsvetanov, Z. I., & Sutherland, R. S. 1998, ApJ, 495, 680
- Bland-Hawthorn et al. (1997) Bland-Hawthorn, J., Gallimore, J. F., Tacconi, L. J., et al. 1997, Ap&SS, 248, 9
- Brinkman et al. (2002) Brinkman, A. C., Kaastra, J. S., van der Meer, R. L. J., et al. 2002, A&A, 396, 761
- Capetti et al. (1997) Capetti, A., Axon, D. J., & Macchetto, F. D. 1997, ApJ, 487, 560
- Cavagnolo et al. (2010) Cavagnolo, K. W., McNamara, B. R., Nulsen, P. E. J., et al. 2010, ApJ, 720, 1066
- Crenshaw & Kraemer (2000) Crenshaw, D. M., & Kraemer, S. B. 2000, ApJ, 532, L101
- Esch et al. (2004) Esch, D. N., Connors, A., Karovska, M., & van Dyk, D. A. 2004, ApJ, 610, 1213
- Exposito et al. (2011) Exposito, J., Gratadour, D., Clénet, Y., & Rouan, D. 2011, A&A, 533, A63
- Evans et al. (1991) Evans, I. N., Ford, H. C., Kinney, A. L., et al. 1991, ApJ, 369, L27
- Evans et al. (2010) Evans, D. A., Ogle, P. M., Marshall, H. L., et al. 2010, Accretion and Ejection in AGN: a Global View, 427, 97
- Ferland (2004) Ferland, G. J. 2004, University of Kentucky Internal Report, 565 pages,
- Gallimore et al. (1996a) Gallimore, J. F., Baum, S. A., O’Dea, C. P., & Pedlar, A. 1996, ApJ, 458, 136
- Gallimore et al. (1996b) Gallimore, J. F., Baum, S. A., & O’Dea, C. P. 1996, ApJ, 464, 198
- Gallimore et al. (2004) Gallimore, J. F., Baum, S. A., & O’Dea, C. P. 2004, ApJ, 613, 794
- Groves et al. (2004) Groves, B. A., Cecil, G., Ferruit, P., & Dopita, M. A. 2004, ApJ, 611, 786
- Karovska et al. (2005) Karovska, M., Schlegel, E., Hack, W., Raymond, J. C., & Wood, B. E. 2005, ApJ, 623, L137
- Karovska et al. (2007) Karovska, M., Carilli, C. L., Raymond, J. C., & Mattei, J. A. 2007, ApJ, 661, 1048
- Kinkhabwala et al. (2002) Kinkhabwala, A., et al. 2002, ApJ, 575, 732
- Kishimoto (1999) Kishimoto, M. 1999, ApJ, 518, 676
- Krips et al. (2011) Krips, M., Martín, S., Eckart, A., et al. 2011, ApJ, 736, 37
- Li et al. (2003) Li, J., Kastner, J. H., Prigozhin, G. Y., & Schulz, N. S. 2003, ApJ, 590, 586
- Matt et al. (2000) Matt, G., Fabian, A. C., Guainazzi, M., et al. 2000, MNRAS, 318, 173
- Müller Sánchez et al. (2009) Müller Sánchez, F., Davies, R. I., Genzel, R., et al. 2009, ApJ, 691, 749
- Müller-Sánchez et al. (2011) Müller-Sánchez, F., Prieto, M. A., Hicks, E. K. S., et al. 2011, ApJ, 739, 69
- Murray et al. (2000) Murray, S. S., Austin, G. K., Chappell, J. H., et al. 2000, Proc. SPIE, 4012, 68
- Ogle et al. (2003) Ogle, P. M., Brookings, T., Canizares, C. R., Lee, J. C., & Marshall, H. L. 2003, A&A, 402, 849
- Paggi et al. (2012) Paggi, A., Wang, J., Fabbiano, G., Elvis, M., & Karovska, M. 2012, ApJ in press, arXiv:1203.1279
- Raban et al. (2009) Raban, D., Jaffe, W., Röttgering, H., Meisenheimer, K., & Tristram, K. R. W. 2009, MNRAS, 394, 1325
- Rodríguez-Ardila et al. (2006) Rodríguez-Ardila, A., Prieto, M. A., Viegas, S., & Gruenwald, R. 2006, ApJ, 653, 1098
- Storchi-Bergmann et al. (2010) Storchi-Bergmann, T., Lopes, R. D. S., McGregor, P. J., Riffel, R. A., Beck, T., & Martini, P. 2010, MNRAS, 402, 819
- Storchi-Bergmann et al. (2012) Storchi-Bergmann, T., Riffel, R. A., Riffel, R., et al. 2012, ApJ in press, arXiv:1206.4014
- Wang et al. (2009a) Wang, J., Fabbiano, G., Karovska, M., et al. 2009, ApJ, 704, 1195
- Wang et al. (2009b) Wang, J., Fabbiano, G., Elvis, M., et al. 2009, ApJ, 694, 718
- Wang et al. (2011a) Wang, J., Fabbiano, G., Elvis, M., et al. 2011, ApJ, 736, 62
- Wang et al. (2011b) Wang, J., Fabbiano, G., Risaliti, G., et al. 2011, ApJ, 729, 75
- Wilson & Ulvestad (1983) Wilson, A. S., & Ulvestad, J. S. 1983, ApJ, 275, 8
- Young et al. (2001) Young, A. J., Wilson, A. S., & Shopbell, P. L. 2001, ApJ, 556, 6
- Zacharias et al. (2004) Zacharias, N., Monet, D. G., Levine, S. E., et al. 2004, Bulletin of the American Astronomical Society, 36, 1418
|
|
|
|
|
|
|
|
|
|||||||||||||||||
|---|---|---|---|---|---|---|---|---|---|---|---|---|---|---|---|---|---|---|---|---|---|---|---|---|---|
| B+C | 0.25 | 18 | 40.s719 | 4771 | 04045 | 15.4 | 16.6 | ||||||||||||||||||
| D+E | 0.6 | 43 | 40.s724 | 4718 | 0404 | 14.2 | 1.9 | ||||||||||||||||||
| F | 0.7 | 50 | 40.s752 | 4740 | 035035 | 14.0 | 1.5 | ||||||||||||||||||
| G | 1.4 | 101 | 40.s758 | 4659 | 04504 | 7.7 | 2.9 | ||||||||||||||||||
| H | 1.3 | 94 | 40.s675 | 4931 | 04504 | 0.73 | 0.38 |
Note. — The [OIII] cloud designations are adopted from Evans et al. (1991), except cloud H was not previously labelled and assigned here. A uncertainty of 5% for [OIII] flux is adopted (Capetti et al. 1997). The [OIII] and X-ray fluxes are in unit of erg s-1 cm-2 per arcsec2.