Galaxy counterparts of intervening high- sub-DLAs/DLAs and Mg ii absorbers towards gamma-ray bursts ††thanks: Based in part on observations collected at the European Organisation for Astronomical Research in the Southern Hemisphere, Chile, as part of the programs 075.A-0603, 075.A-0385, 077.A-0312, 084.A-0303, 177.A-0591 and 275.D-5022. Based in part on observations made with the NASA/ESA Hubble Space Telescope, obtained at the Space Telescope Science Institute, which is operated by the Association of Universities for Research in Astronomy, Inc., under NASA contract NAS 5-26555. Based in part on observations made with the Spitzer Space Telescope, which is operated by the Jet Propulsion Laboratory, California Institute of Technology, under a contract with NASA. Based in part on observations obtained at the Gemini Observatory, which is operated by the Association of Universities for Research in Astronomy, Inc., under a co-operative agreement with the NSF on behalf of the Gemini partnership.
We present the first search for galaxy counterparts of intervening high- () sub-DLAs and DLAs towards GRBs. Our final sample comprises of five intervening sub-DLAs and DLAs in four GRB fields. To identify candidate galaxy counterparts of the absorbers we use deep optical and near-infrared imaging, and low-, mid- and high-resolution spectroscopy acquired with 6 to 10-m class telescopes, the Hubble and the Spitzer space telescopes. Furthermore, we use the spectroscopic information and spectral-energy-distribution fitting techniques to study them in detail. Our main result is the detection and spectroscopic confirmation of the galaxy counterpart of the intervening DLA at in the field of GRB 070721B () as proposed by other authors. We also identify good candidates for the galaxy counterparts of the two strong Mg ii absorbers at and 1.4288 towards GRB 050820A (). The properties of the detected DLA galaxy are typical for Lyman-break galaxies (LBGs) at similar redshifts; a young, highly starforming galaxy that shows evidence for a galactic outflow. This supports the hypothesis that a DLA can be the gaseous halo of an LBG. In addition, we report a redshift coincidence of different objects associated with metal lines in the same field, separated by 130–161 kpc. The high detection rate of three correlated structures on a length scale as small as kpc in two pairs of lines of sight is intriguing. The absorbers in each of these are most likely not part of the same gravitationally bound structure. They more likely represent groups of galaxies.
Key Words.:
galaxies: evolution – galaxies: formation – Galaxies: individual: DLA J0212-0211 – quasars: absorption lines – quasars: individual: QSO J1408-0346 – Gamma-ray burst: individual: GRBs 050730, 050820A, 050908, 070721BKey Words.:
galaxies: evolution – galaxies: formation – Galaxies: individual: DLA J0212-0211 – quasars: absorption lines – quasars: individual: QSO J1408-0346 – Gamma-ray burst: individual: GRBs 050730, 050820A, 050908, 070721B1 Introduction
Intervening absorption-line systems found in quasi-stellar-object (quasar, QSO) spectra play an important role in the observational study of galaxy formation and evolution. Unlike emission-selected objects, QSO absorption-line systems probe structures over the full mass range from under-dense regions to massive virialised dark matter haloes (Rauch 1998; Wolfe et al. 2005). The most neutral-hydrogen-rich absorption systems are called damped Ly absorbers (DLAs), if the neutral hydrogen column density, , exceeds cm-2 () and sub-DLAs (or sometimes super-Lyman-limit systems) if the column density in neutral hydrogen is between and cm-2 (Wolfe et al. 2005, and ref. therein). DLAs represent the main reservoir of neutral hydrogen in the high- () Universe (Wolfe 1986; Péroux et al. 2005; Wolfe et al. 2005). Since the advent of QSO absorption-line spectroscopy, over 1000 intervening sub-DLAs and DLAs have been detected (Prochaska et al. 2005; Noterdaeme et al. 2009; Prochaska & Wolfe 2009).
Although their frequency and chemical composition are well known, the nature of their galaxy counterparts (hereafter called DLA galaxies) has remained poorly constrained for many years. Various models for DLA galaxies exist: e.g. rapidly-rotating proto-galactic disks at high redshift (Prochaska & Wolfe 1997, 1998; Wolfe & Prochaska 1998), low surface brightness galaxies (Jimenez et al. 1999), faint and small gas-rich dwarf galaxies (Tyson 1988; Haehnelt et al. 1998; Okoshi & Nagashima 2005), compact galaxies (Nagamine et al. 2007), and gaseous haloes of high- LBGs (Fynbo et al. 1999; Møller et al. 2002; Fynbo et al. 2008; Rafelski et al. 2011). Chen & Lanzetta (2003) showed that the majority of low- sub-DLAs and DLAs are late-type galaxies and only a few are elliptical or dwarf galaxies. The conclusion that these low- absorbers are indeed sub-DLAs or DLAs is drawn indirectly. Below , the Ly absorption line is below 3000 Å, a spectral range that is inaccessible with ground-based telescopes. Ellison (2006) showed that Mg ii absorbers with , so-called strong Mg ii absorbers, are likely sub-DLAs or DLAs (see also Rao & Turnshek 2000; Ellison et al. 2009).
The successfully identified DLA galaxies allow the study of objects at the very faint end of the galaxy luminosity function (LF), objects that are usually missed in galaxy surveys. During the past 25 years, several deep imaging campaigns have been carried out, but only with limited success (e.g. Smith et al. 1989; Djorgovski et al. 1996; Le Brun et al. 1997; Fynbo et al. 1999; Warren et al. 2001; Møller et al. 2002; Fumagalli et al. 2010, see also Bouché et al. 2012). Up to now, only about 17 sub-DLA and DLA galaxies have been identified below the redshift of unity (e.g. Péroux et al. 2011, and reference therein) and more than 80 DLA galaxy candidates have been reported to date (e.g. Rao et al. 2011). For the majority of these DLA galaxy candidates there is no spectroscopic confirmation yet. At high redshift the situation is worse; only 9 intervening sub-DLAs and DLAs with redshifts between 2 and 3.15 have a confirmed galaxy counterpart (high-; Djorgovski et al. 1996; Møller et al. 2002; Christensen et al. 2004b; Møller et al. 2004; Weatherley et al. 2005; Fynbo et al. 2010, 2011; Péroux et al. 2012; Bouché et al. 2012; Krogager et al. 2012; Noterdaeme et al. 2012, and references therein). In addition to those, a few associated DLAs, i.e. , have detected galaxy counterparts (e.g. Fynbo et al. 1999; Møller & Warren 1993; Ellison et al. 2002; Møller et al. 2004; Adelberger et al. 2006).
Apart from the faintness of the galaxy counterparts, a further issue hampering the search for DLA galaxies is the glare of the bright background QSOs. Counterparts with a small angular distance from the QSO (impact parameter) are difficult to recover. This may lead to a possible misidentification of the DLA galaxy and hence an overestimation of its size, as DLAs at small impact parameters are easily missed. A different class of background light sources, gamma-ray bursts (GRBs), provide a complementary approach to the problem. A GRB is a transient phenomenon, outshining the known Universe in -rays for a fraction of a second up to hundreds of seconds (e.g. Kouveliotou et al. 1993; Zhang & Mészáros 2004). This short-lived emission is followed by an afterglow that can usually be detected from the X-rays over optical/near-infrared (NIR) wavelengths to the radio for several weeks (e.g. Racusin et al. 2009; Kann et al. 2010; Chandra & Frail 2012). An afterglow can outshine the brightest quasars by several orders of magnitudes, but only for a very short period of time ( – ; e.g. Bloom et al. 2009; Kann et al. 2010). Similar to QSOs, GRBs can be found over most of the observable Universe, the most distant spectroscopically-confirmed burst being GRB 090423, at (Tanvir et al. 2009; Salvaterra et al. 2009). In fact, since most GRBs are associated with the death of massive stars (Hjorth & Bloom 2011; Woosley 2011), this should allow us to detect them at higher redshifts than QSOs. In short, GRB afterglows can be brighter than QSOs but they are ephemeral, i.e. they vanish within a couple of months. This leaves the line-of-sight clear and without any interference from a bright object (e.g. Masetti et al. 2003; Vreeswijk et al. 2003; Jakobsson et al. 2004; Ellison et al. 2006; Prochter et al. 2006; Henriksen 2008; Pollack et al. 2009).
GRBs are important for DLA studies for another reason. Nearly all GRB host galaxies have a DLA (GRB-DLA; Fynbo et al. 2009). The distribution of their H i column density, and their metal-line strength distributions of and overlap with those of intervening DLAs, but also extend to larger values (Prochaska et al. 2007b; Fynbo et al. 2009). On average GRB-DLAs have larger metallicities than intervening DLAs (Fynbo et al. 2006; Prochaska et al. 2007b; Fynbo et al. 2008). The difference between in-situ and intervening DLAs lies in the way they probe their host galaxies (Vreeswijk et al. 2004; Prochaska et al. 2007b; Fynbo et al. 2008, 2009). As GRBs are thought to originate from the collapse of a massive star, GRB-DLAs probe the line of sight to the location of a massive star, irrespective of the DLA orientation relative to the host galaxy if the progenitor is located in the DLA. Consequently, GRB-DLAs are selected by their star-formation rate (). In contrast, the properties of an intervening DLA depend on the geometry of the DLA galaxy and its orientation relative to the line of sight. These are selected by their covering fraction and hence their cross-section, . A debated question in observational galaxy formation and evolution is the faint-end slope of the galaxy LF. DLA galaxies probe the faint-end slope, but the in-situ and intervening DLA LFs are only identical if (Chen et al. 2000; Fynbo et al. 2008). The studies of both DLA populations therefore complement each other well.
Currently, seven intervening sub-DLAs and DLAs have been found in six GRB afterglow spectra, with absorber redshifts ranging between 2.077 and 3.564 (GRBs 050730, 050820A, 050908, 050922C, 060607A, 070721B; Chen et al. 2005; Fox et al. 2008; Piranomonte et al. 2008; Chen et al. 2009; Fynbo et al. 2009; Vergani et al. 2009). Although the number of intervening (sub-)DLAs towards GRBs does not increase the number of known (sub-)DLAs significantly, the transient nature of the background afterglow simplifies the search for their galaxy counterparts. After the afterglow has faded, deep follow-up observations are usually carried out to find the GRB host galaxy, typically reaching a limiting magnitude of mag in the -band (e.g. Hjorth et al. 2012; Malesani et al. 2012). These observations are also suitable for the search for DLA galaxies.
In this paper we present the findings from our search for the photometric counterparts of intervening sub-DLAs and DLAs in six GRB lines of sight. In Sect. 2, we introduce our methodology, present the sample selection, and describe how the data were reduced. The results are then presented in Sect. 3, confronted with current models of sub-DLAs and DLAs, and compared to low- and high- DLA galaxies in Sect. 4. In Sect. 5 we draw our conclusions.
2 Data gathering and reduction
2.1 Sample selection and data gathering
| Photometrya𝑎aa𝑎aD | ||||
|---|---|---|---|---|
| Instrument | Filter | Exposure | Seeing | Photo- |
| time (s) | metric? | |||
| GRB 050730: (J2000) | ||||
| VLT/FORS2 | 06 | yes | ||
| HST/ACS | ||||
| VLT/ISAAC | 07 | yes | ||
| Spitzer/IRAC | 7200 | |||
| GRB 050820A: , (J2000) | ||||
| Keck/LRIS | 2620 | 07 | yes | |
| HST/ACS | 2238 | |||
| VLT/FORS2 | 08 | no | ||
| HST/ACS | 4404 | |||
| HST/ACS | 14280 | |||
| Magellan/PANIC | 8460 | 06 | ||
| VLT/ISAAC | 07 | yes | ||
| Spitzer/IRAC | 3600 | |||
| GRB 050908: , (J2000) | ||||
| VLT/FORS2 | 07 | yes | ||
| VLT/ISAAC | 06 | yes | ||
| Spitzer/IRAC | 7200 | |||
| GRB 070721B: , (J2000) | ||||
| VLT/FORS2 | 05 | no | ||
| HST/ACS | ||||
| Magellan/PANIC | 10320 | 05 | ||
| VLT/ISAAC | 10 | yes | ||
All six GRBs with intervening sub-DLAs and DLAs were a part of deep imaging campaigns dedicated to detect their host galaxies. Among these, we selected those that had sufficient spectroscopic data, e.g. spectra obtained with different position angles (PAs), or multi-filter data to construct the spectral energy distribution (SED) of candidates and determine their nature. This reduced the set to GRBs 050730, 050820A, 050908 and 070721B.
In the following, we briefly describe the photometric and spectroscopic data analysed, as summarised in Table 1. The observing conditions during Keck and Magellan observations are described in Chen et al. (2009), while those of other ground-based observations are summarised in Table 1. The astrometric uncertainty is ; the uncertainty between the optical and NIR astrometry is similar, allowing us to unambiguously identify objects in the different bands
2.1.1 GRB 050730
Afterglow spectra of GRB 050730 were acquired with VLT/FORS2 with the 300V grating and with VLT/UVES with the red and blue arm centred at 3460 Å and 5800 Å, respectively (see Table 1). In addition, a further spectrum was acquired with VLT/FORS1 (grating 600V; PA=22.5), as a part of the TOUGH (The Optically Unbiased GRB Host) survey (Hjorth et al. 2012) and three further spectra with VLT/FORS2 (PI: Ellison; Table 1). For the latter, the slits were centred on the afterglow position, and spectra with different slit orientations were obtained with the 600B grism. In doing so, most of the field of view close to the GRB position is covered including several of the brightest close-by objects. This strategy enables us to localise emission line objects via triangulation, similar to Møller et al. (2004), Fynbo et al. (2010), Fynbo et al. (2011), Krogager et al. (2012), Noterdaeme et al. (2012).222In fact, the galaxy counterparts of most sub-DLAs and DLAs at were detected via triangulation.
Fynbo et al. (2009) reported the serendipitous discovery of a quasar at the same redshift as the intervening sub-DLA towards GRB 050730, 175 south of the afterglow position. The quasar is blended with a 18.2-mag bright foreground star. In order to investigate the QSO-sub-DLA connection and to constrain the quasar radiation field, we acquired a spectrum of the quasar with VLT/X-shooter (Table 1). The field was also the target of deep imaging campaigns with VLT/FORS2 (-band) and VLT/ISAAC (-band) as a part of the TOUGH survey (Hjorth et al. 2012), HST/ACS (-band, PI: Levan) and Spitzer/IRAC (3.6 and ; Table 1).
| Spectroscopya𝑎aa𝑎aD | ||||||||
| Instrument | Grating | Spectral | Resolving | Exposure | Slit | Position | Seeing | Photo- |
| range (Å) | power | time (s) | width | angle | metric? | |||
| GRB 050730 | ||||||||
| VLT/FORS1 | 600V+GG435 | 4430–7370 | 990 | 13 | 225 | 08 | yes | |
| VLT/FORS2 | 600B | 3300–6210 | 780 | 13 | -200 | 09 | yes | |
| 300V | 3400–9500 | 440 | 10 | 00 | 15 | no | ||
| 600B | 3300–6210 | 780 | 13 | 335 | 12 | yes | ||
| 600B | 3300–6210 | 780 | 13 | 950 | 13 | yes | ||
| VLT/UVES | 346 and 580 | 3030–6840b𝑏bb𝑏bS | 3000 | 10 | 00 | 18 | no | |
| 437 and 860 | 3730–10600c𝑐cc𝑐cS | 11 | yes | |||||
| VLT/X-shooterd𝑑dd𝑑dT | UVB | 3000–5500 | 4000 | 13 | 437 | 08 | yes | |
| VIS | 5500–10000 | 6700 | 12 | |||||
| NIR | 10000–25000 | 4000 | 12 | |||||
| GRB 050820A | ||||||||
| VLT/FORS2 | 300V | 3400–9500 | 440 | 13 | -520 | 12 | yes | |
| 300V | 13 | 340 | 13 | yes | ||||
| 300V | 13 | 830 | 07 | yes | ||||
| 1028z+OG590 | 7730–9480 | 2560 | 13 | -520 | 08 | yes | ||
| 1028z+OG590 | 13 | 340 | 12 | yes | ||||
| 1028z+OG590 | 13 | 830 | 07 | yes | ||||
| VLT/UVES | 390 and 564 | 3260–6680e𝑒ee𝑒eS | 1800+1815 | 10 | 00 | 10 | yes | |
| 437 and 860 | 3730–10600c𝑐cc𝑐cS | 2430 | ||||||
| GRB 050908 | ||||||||
| Gemini/GMOS-N | B600+G0305 | 5118–7882 | 844 | 075 | 1100 | |||
| VLT/FORS1 | 300V | 3400–9500 | 440 | 10 | 00 | 06 | yes | |
| 600B | 3300–6210 | 780 | 13 | 538 | 12 | yes | ||
| GRB 070721B | ||||||||
| VLT/FORS1 | 300V | 3400–9500 | 440 | 13 | -1185 | 12 | yes | |
| VLT/FORS2 | 300V | 3400–9500 | 440 | 10 | -1183 | 12 | yes | |
Tab. 1 — continued
2.1.2 GRB 050820A
Similar to GRB 050730, GRB 050820A was a target of an extensive spectroscopic campaign. After the afterglow faded, several spectra were acquired with VLT/FORS2 by centring the slit on the afterglow position and using three different slit orientations, each one observed with two different gratings (300V and 1028z; PI: Ellison), see Table 1. Slits were oriented to cover most of the area around the afterglow position and several of the brightest objects close to the afterglow position. The total integration time of the data acquired with the 1028z grism is only half of the time spent on 300V, and the 1028z spectral range does not extend the range of the 300V data substantially, but its resolution is much higher than that of the 300V data. Hence, we do not use the 1028z data in our analysis. In addition, the field was observed in nine filters extending from 473.1 nm ( band) to with VLT/FORS2 and VLT/ISAAC as a part of the TOUGH survey, HST/ACS, KECK/LRIS, Magellan/PANIC, and Spitzer/IRAC (Table 1).
2.1.3 GRB 050908
For this burst, the amount of available data is small. An afterglow spectrum was obtained with the 300V grating (slit width of 10 and ) utilising VLT/FORS1, and with Gemini/GMOS-N utilising the B600 grating (slit width of 075 and ; Table 1). In addition to these data, we included a spectrum obtained with VLT/FORS1 (600B) and deep - and -band images acquired with VLT/FORS2 and VLT/ISAAC as a part of the TOUGH survey, respectively, and deep Spitzer/IRAC images acquired at 3.6 and (Table 1).
2.1.4 GRB 070721B
We use the afterglow spectrum (PA=-1183) acquired with VLT/FORS2 (Table 1), and a spectrum obtained with VLT/FORS1 (PA=-1185) several months after the GRB faded as a part of the TOUGH campaign. In addition, several deep imaging campaigns targeted this field. We use the VLT/FORS2 -band and VLT/ISAAC -band data acquired as a part of the TOUGH campaign, HST/ACS F775W-band data, and Magellan/PANIC -band data.
2.2 Data reduction
2.2.1 Imaging
Ground-based data –
VLT/FORS and Keck/LRIS data were reduced in a standard way, VLT/FORS data with IRAF and Keck/LRIS data with IDL (Tody 1986; see Malesani et al. 2012 for more details on the VLT data reduction, and Perley et al. 2012 on the Keck data reduction). The NIR data acquired with VLT/ISAAC were reduced in a standard way with the jitter routine in eclipse (Devillard 1997). The reduction of the Magellan/PANIC data is presented in Chen et al. (2009).
HST data –
HST/ACS images of GRB 050730 and 070721B consist of 6 dithered exposures in the filter. Individual exposures, after standard “on-the-fly” processing, were retrieved from the STScI archive.444http://archive.stsci.edu These were subsequently cleaned for bias striping, introduced due to the replacement electronics after Servicing Mission 4 (May 11-24, 2009), and then drizzled using the multidrizzle software into final science images. At this stage we adopt a pixel scale of 0033, approximately 2/3 of the native pixel scale. The data reduction of the GRB 050820A HST data is presented in Chen et al. (2009). The pixel scale of these drizzled images is 005 in contrast to that of the images of GRBs 050730 and 070721B.
Spitzer Data
GRBs 050730, 050820A, and 050908 were observed with the Infrared Array Camera aboard Spitzer (IRAC; Fazio et al. 2004) in the bandpasses centred at 3.6 and . We downloaded the processed PBCD data from the Spitzer Heritage Archive and followed the basic procedures for aperture photometry in the IRAC Instrument Handbook,555http://http://sha.ipac.caltech.edu/applications/Spitzer/SHA/ using an extraction radius of 2 native pixels (24, or 4 pixels in the default archive resampling).
Photometry –
In order to measure the total flux, we applied aperture photometry, utilising Source Extractor (Bertin & Arnouts 1996), and applied an aperture correction assuming a stellar point-spread function (PSF; for the aperture correction of the HST images see Sirianni et al. 2005).
The quasar in the field of GRB 050730 is strongly blended with a foreground star at a projected distance of 12. To perform reliable photometry, the contaminating star was subtracted from the VLT/FORS1 images. A model of the FORS1 PSF was constructed from 60 field stars using Daophot as implemented in IRAF. This PSF model was then fitted simultaneously to the star and the QSO. To test the quality of the fit, we subsequently subtracted the stellar contribution from the input image. Photometry was then performed in the final star-subtracted image.
2.2.2 Spectroscopy
VLT/FORS1 and FORS2, Gemini/GMOS and VLT/UVES data –
VLT/X-shooter data –
The QSO in the field of GRB 050730 was observed with X-shooter. These data were reduced with the X-shooter pipeline v1.2.2.666http://www.eso.org/sci/software/pipelines/ The 1-dimensional spectrum of the QSO (; corrected for Galactic extinction) in the field of GRB 050730 could not be extracted with the X-shooter pipeline, because of being blended with the 18.2-mag bright foreground star 12 SW mentioned above (see Fig. 1).
| GRB | Detected lines | References | |||||
| 3.56439 | a𝑎aa𝑎aT | Al ii, Fe ii, Si ii, Si ii∗, C iv, Si iv | |||||
| 050730 | 3.969 | 3.02209 | b𝑏bb𝑏bW | … | Al ii, Fe ii, Si ii | 1, 2, 3 | |
| 050820A | 2.615 | 2.3598c𝑐cc𝑐cmissing | d𝑑dd𝑑dT | Fe ii, Si ii, C iv, Mg ii | 4 | ||
| 050908 | 3.3467 | 2.6208 | d,e𝑑𝑒d,ed,e𝑑𝑒d,efootnotemark: | d𝑑dd𝑑dT | Al ii, Fe ii, Si ii, C iv | 2 | |
| 070721B | 3.6298 | 3.0939g𝑔gg𝑔gmissing | d,e𝑑𝑒d,ed,e𝑑𝑒d,efootnotemark: | d𝑑dd𝑑dT | d𝑑dd𝑑dT | Al ii, Fe ii, Si ii, C iv | 2 |
| GRB | Detected lines | References | |||
| 2.25313 | Fe ii, Mg i, Mg ii | 1, 2 | |||
| 050730 | 3.969 | 1.7731a𝑎aa𝑎amissing | Fe ii, Mg i, Mg ii | 1, 2 | |
| 1.4288 | Fe ii, Mg i, Mg ii | 1 | |||
| 050820A | 2.6147 | 0.6915 | Ca ii, Fe ii, Mg ii | 1 | |
| 050908 | 3.3467 | 1.5481 | Fe ii, Mg ii | 3 |
To estimate the flux of the quasar over the entire wavelength range of the X-shooter spectrograph, we proceeded in the following way. For each arm, we first extracted a profile of the superposed spectral PSFs at several wavelengths. Each profile was best described by two Gaussians, representing the QSO and the star. The centre of their peaks and the widths did not change with wavelength, allowing us to fix these parameters to their mean values for each arm of the X-shooter spectrograph. Then, we extracted the profile for every wavelength and fit it with the aforementioned model, using the routine mpfit by Markwardt (2009), in IDL. To identify outliers, a 9-point median profile was fitted for every wavelength, i.e. four points redward and four points blueward of the considered wavelength. Data points were rejected if they deviated by more than from the median spectral PSF of the quasar and the star.
| GRB 050730 (GRB: , DLA: , sub-DLA: , Mg ii absorbers: , 1.7731) | |||||||||
|---|---|---|---|---|---|---|---|---|---|
| Candidate | Remark | (mag) | (mag) | (mag) | (mag) | (mag) | |||
| A1 | star | 12.8 | |||||||
| A2 | 12.3 | ||||||||
| A3 | 10.6 | ||||||||
| A4 | star | 7.3 | |||||||
| A5a | 2.5 | ||||||||
| A5ba𝑎aa𝑎aBlended object. The magnitude is only an estimate. The spectrum can be the integrated spectrum of the blended objects. | 2.1 | ||||||||
| A5ca𝑎aa𝑎aBlended object. The magnitude is only an estimate. The spectrum can be the integrated spectrum of the blended objects. | 2.0 | ||||||||
| A5d | 1.8 | ||||||||
| A6a | 1.0 | ||||||||
| A6b | 0.7 | ||||||||
| A6c | 0.4 | ||||||||
| A6d | 1.4 | ||||||||
| A6e | 0.9 | ||||||||
| A6f | 1.5 | ||||||||
| A7 | star | 4.2 | |||||||
| A8 | 6.3 | ||||||||
| A9 | 9.8 | ||||||||
| A10 | 11.5 | ||||||||
| A11b𝑏bb𝑏bThe object consists of at least two galaxies and is detected in all filters. We do not report any magnitude of the individual objects or the compound in this work. We detect the continuum down to 4630 Å. If this break is caused by Ly absorption, the redshift is , or if this is the redshifted 4000 Å feature, the redshift is . | 13.3 | ||||||||
| QSOc𝑐cc𝑐cThe -band brightness of the quasar and the star were obtained from an afterglow image taken on 23 February 2007 using PSF photometry (Sect. 2.2.1). The blended star is saturated in the HST image. The PSF was subtracted with Tiny Tim (Krist 1993) assuming a of . While the wings of the star were partly removed, the residuals in the core are quite strong. The measurement of the QSO magnitude is only an estimate. | 17.5 | ||||||||
| Starc𝑐cc𝑐cThe -band brightness of the quasar and the star were obtained from an afterglow image taken on 23 February 2007 using PSF photometry (Sect. 2.2.1). The blended star is saturated in the HST image. The PSF was subtracted with Tiny Tim (Krist 1993) assuming a of . While the wings of the star were partly removed, the residuals in the core are quite strong. The measurement of the QSO magnitude is only an estimate. | star | 18.3 | |||||||
| GRB 050820A (GRB: , DLA: , Mg ii absorbers: , 0.6915) | |||||||||
| Candidate | Remark | (mag) | (mag) | (mag) | (mag) | (mag) | (mag) | (mag) | |
| B1d𝑑dd𝑑dThe compound is a blend of several individual objects. We only report the brightness in the HST images of the brightest object. | 11.8 | ||||||||
| B2 | 12.3 | ||||||||
| B3 | 5.2 | ||||||||
| B4 | star | 2.8 | |||||||
| B5 | 3.7 | ||||||||
| B6 | 4.9 | ||||||||
| B7a𝑎aa𝑎aBlended object. The magnitude is only an estimate. The spectrum can be the integrated spectrum of the blended objects. | 1.6 | ||||||||
| B8Na𝑎aa𝑎aBlended object. The magnitude is only an estimate. The spectrum can be the integrated spectrum of the blended objects. | 0.3 | ||||||||
| B8Sa𝑎aa𝑎aBlended object. The magnitude is only an estimate. The spectrum can be the integrated spectrum of the blended objects. | 0.1 | ||||||||
| B9 | 3.4 | ||||||||
| B10 | star | 3.6 | |||||||
| Candidate | (mag) | (mag) | |||||||
| B1d𝑑dd𝑑dThe compound is a blend of several individual objects. We only report the brightness in the HST images of the brightest object. | |||||||||
| B2 | |||||||||
| B3 | |||||||||
| B4 | |||||||||
| B5 | |||||||||
| B6 | |||||||||
| B7a𝑎aa𝑎aBlended object. The magnitude is only an estimate. The spectrum can be the integrated spectrum of the blended objects. | |||||||||
| B8Na𝑎aa𝑎aBlended object. The magnitude is only an estimate. The spectrum can be the integrated spectrum of the blended objects. | |||||||||
| B8Sa𝑎aa𝑎aBlended object. The magnitude is only an estimate. The spectrum can be the integrated spectrum of the blended objects. | |||||||||
| B9 | |||||||||
| B10 | |||||||||
| GRB 050908 (DLA: , DLA: , Mg ii absorber: ) | |||||||
|---|---|---|---|---|---|---|---|
| Candidate | Remark | (mag) | (mag) | (mag) | (mag) | ||
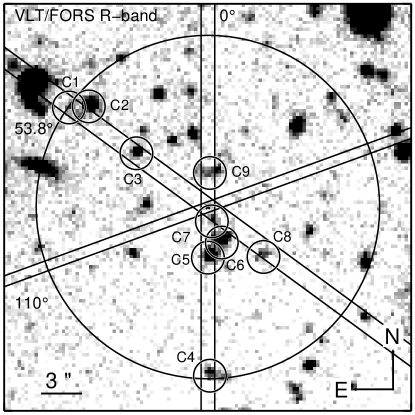
| C1 | 12.6 | ||||||
| C2 | 11.5 | ||||||
| C3 | 6.6 | ||||||
| C4a𝑎aa𝑎aBlended object. The magnitude is only an estimate. The spectrum is the integrated spectrum of the blended objects. | 12.4 | ||||||
| C5a,b𝑎𝑏a,ba,b𝑎𝑏a,bfootnotemark: | 3.7 | ||||||
| C6a,b𝑎𝑏a,ba,b𝑎𝑏a,bfootnotemark: | 2.8 | ||||||
| C7b𝑏bb𝑏bWe do not attempt photometry on objects which are strongly blended in the Spitzer data in this work, with the exception of objects C5, C6, and C7, which are sufficiently closely blended that we report the (summed) photometry of all three objects as a group. | 1.1 | ||||||
| C8 | 5.5 | ||||||
| C9 | 2.5 | ||||||
| GRB 070721B (GRB: , DLA: ) | |||||||
| Candidate | Remark | (mag) | (mag) | (mag) | (mag) | ||
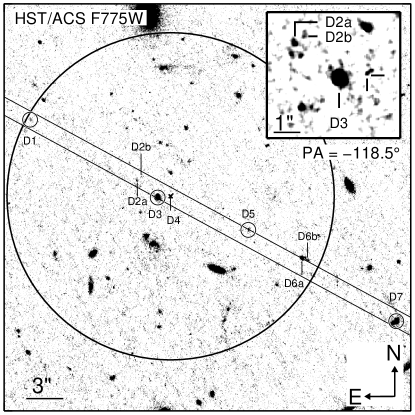
| D1 | 12.8 | ||||||
| D2aa𝑎aa𝑎aBlended object. The magnitude is only an estimate. The spectrum is the integrated spectrum of the blended objects. | 3.0 | ||||||
| D2ba𝑎aa𝑎aBlended object. The magnitude is only an estimate. The spectrum is the integrated spectrum of the blended objects. | 2.8 | ||||||
| D3 | 1.0 | ||||||
| D4 | 0.1 | ||||||
| D5 | 6.9 | ||||||
| D6aa𝑎aa𝑎aBlended object. The magnitude is only an estimate. The spectrum is the integrated spectrum of the blended objects. | 11.7 | ||||||
| D6ba𝑎aa𝑎aBlended object. The magnitude is only an estimate. The spectrum is the integrated spectrum of the blended objects. | 12.2 | ||||||
| D7 | 20.7 | ||||||
Tab. 9 — continued
The QSO was barely visible in the NIR spectrum. We therefore determined the centre of peak and the of the star and set the QSO centre of peak to its expected position. Furthermore, we reduced the spectral resolution to increase the signal-to-noise ratio (S/N) by rebinning the spectrum. The uncertainties in the s and the centre of peaks varied between 0.06 and 0.39 px and 0.3 and 0.18 px for each arm (pixel scale: UVB and VIS 016/px, NIR 021/px), respectively, small enough to be neglected.
We compared the quality of our method with the MCS deconvolution technique developed by Magain, Courbin, & Sohy (Magain et al. 1998) used in Letawe et al. (2008, see also ). This method requires an unblended star to be observed with the identical instrument setup. Because of the short slit length, no such object was covered by the slit. For a rough estimate, we used the observed standard star as reference, although it was observed with a slit width of 5″. Within the errors both methods give the same results.
To flux calibrate the spectrum, we reduced the data of the standard star GD50 with the X-shooter pipeline. The 1D spectrum was extracted using the routine apall in optimal extraction mode. The spectrum was then divided by the corresponding reference spectrum from the CALSPEC HST database (Bohlin & Gilliland 2004) to deduce the response function. In addition, we corrected the flux-calibrated standard star spectrum for undulations by smoothing the ratio between the observed flux-calibrated and expected spectra with a Hamming filter (window size: 40Å in the UVB and VIS arm) in regions that were not affected by strong telluric lines or stellar absorption features. We then applied the corrected response function to the QSO and used the acquisition image to secure the absolute flux calibration. Finally, we followed Cardelli et al. (1989) to correct the QSO for Galactic dust attenuation (). No attempt was made to correct for telluric absorption lines due to the lack of a suitable telluric standard star observed the same night. This has no implications on our analysis.
2.3 SED fitting
The photometric SEDs of the galaxies were modeled within Le Phare (Arnouts et al. 1999; Ilbert et al. 2006).111111http://www.cfht.hawaii.edu/ arnouts/LEPHARE Here, we used a grid of galaxy templates based on Bruzual & Charlot (2003) stellar population synthesis models with a Chabrier IMF (Chabrier et al. 2000) and a Calzetti (Calzetti et al. 2000) dust attenuation curve. In those cases, where prior information about the redshift was available from spectroscopy, we fixed this parameter to the respective value. For a description of the galaxy templates, physical parameters of the galaxy fitting and their error estimation we refer to Krühler et al. (2011). To account for zeropoint offsets in the cross calibration and absolute flux scale, an systematic error contribution of 0.05 mag was added in quadrature to the uncertainty introduced by photon noise.
3 Results
Afterglow spectroscopy allowed us to identify seven intervening sub-DLAs and DLAs in six GRB fields. For four of these fields, we had sufficient data to elucidate the nature of several galaxy counterpart candidates. In the following, we present how candidates were selected, and present the properties of the intervening sub-DLAs and DLAs towards GRBs 050730, 050820A, 050908 and 070721B and our findings on the most likely galaxy counterpart for each field. A summary of the properties of the intervening sub-DLAs and DLAs is presented in Tables 7 and 8. Most of the shown values are taken from the literature.
In order to select candidates that are close enough to the GRB line of sight to produce an intervening absorption-line-system in the afterglow spectrum, we had to set an upper limit on the extent of the possible DLA galaxies. Theoretically, it is very difficult to set a meaningful upper boundary, because different models exist for their galaxy counterparts. The observed impact parameter distribution of confirmed DLA galaxies, based on Péroux et al. (2011) and Krogager et al. (2012), extends from 0.4 to 182 kpc and has a mean value of kpc. The impact parameter distribution of DLA galaxy candidates by Rao et al. (2011) shows similar characteristics. The majority of DLA galaxies have a small impact parameter, however there are few cases with large impact parameters (). We therefore follow the statistical approach by Rao et al. (2011) who used the galaxy number density as a function of impact parameter as a criterion. They found that the galaxy number density is comparable to the number density of foreground and background galaxies, i.e. a chance association is more likely, if the impact parameter exceeds 100 kpc. As a first assumption, we limit our study to those candidates within 100 kpc from the GRB line of sight, keeping in mind that this value was derived for intervening DLAs between and 0.8.
3.1 GRB 050730
GRB 050730 occurred at a redshift of . Its afterglow spectrum contains an intervening sub-DLA (, ),121212The metallicity is not corrected for ionisation effects. and an intervening DLA (, ) at and , respectively (Tables 7, 8). In addition the afterglow light traversed an intermediate and a strong Mg ii absorber at and 1.7731, respectively.
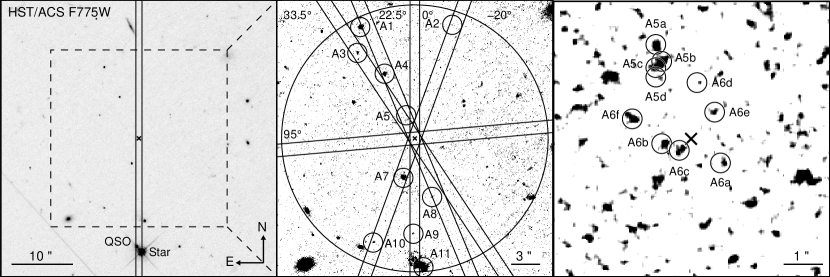
In Figure 1, we show the field of GRB 050730 and zoom-ins to the inner 288 and 60; the region at which the impact parameter exceeds 100 kpc is highlighted. At the redshift of the aforementioned absorption-line systems, the maximum impact parameter of 100 kpc translates to an transverse distance between 121 and 139; the smaller value belongs to and the larger to , including the astrometric uncertainty of the afterglow localisation of 03.
The GRB was a target of an extensive spectroscopic campaign; several low-resolution spectra with a total of five different position angles (PA) were obtained with VLT/FORS1 and VLT/FORS2 (Fig. 1, Table 1). Within the 100-kpc radius, 19 objects were covered by a slit. In Table 9 we summarise their magnitudes in different filters and their angular distances from the afterglow position. Four of these objects were bright enough to allow the extraction of a spectrum. The VLT/FORS1 spectra of objects A1 and A4 are of very low S/N. We detect their continua down to 4500 Å, but we detect no absorption or emission lines. If these objects were the galaxy counterparts to the sub-DLA and DLA, we expect to see the onset of the Ly forest at Å and Å, respectively, which we do not observe. The Ly non-detection and the extension of the continuum to even shorter wavelengths, rules them out as the galaxy counterparts. We detect the continuum of object A7 at very low S/N in the VLT/FORS2 data, but no absorption or emission lines. The objects A1, A4 and A7 are likely late-type stars based on their colours and the fact that the morphology and size of their PSFs () do not differ from point sources. Object A11 lies at the edge of the 100-kpc radius. We detect its continuum down to 4630 Å in the VLT/FORS2 data and a drop in flux blueward of it. Assuming that this is the Balmer break, the redshift of the galaxy is , not in agreement with any of the intervening absorbers.
In conclusion, we do not identify any galaxy counterpart candidate of the intervening sub-DLA and DLA down to a limiting magnitude of and of any of the intermediate Mg ii absorbers down to a limiting magnitude of , assuming a maximum impact parameter 50 (100) kpc. These limits were calculated by considering all objects within 50 (100) kpc but excluding those for which we elucidated the nature or those with a stellar PSF.
Fynbo et al. (2009) reported the serendipitous discovery of a QSO at the redshift of , very similar to the redshift of the sub-DLA in the afterglow spectrum. The QSO is 175 south of the afterglow position (see Fig. 1, Table 9), corresponding to a projected distance of kpc at , the redshift of the sub-DLA towards the GRB. It has a brightness of mag in the -band (corrected for Galactic extinction, Table 9), but is blended with a 18.2-mag bright K-type star. Strictly speaking, the impact parameter exceeds the assumed maximum impact parameter of 100 kpc. Given the redshift coincidence with the sub-DLA in the afterglow spectrum we discuss this correlated structure in Sect. 4.4.
3.2 GRB 050820A
Ledoux et al. (2005) and Vergani et al. (2009) reported an intervening sub-DLA at with and a metallicity of and two strong Mg ii absorbers between and 1.6204 towards GRB 050820A (, Tables 7, 8)
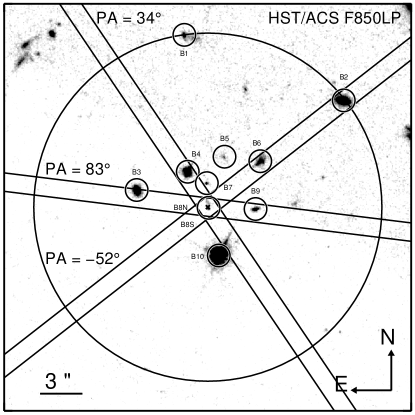
In Figure 2, we show the inner around the afterglow position and highlight the region at which the impact parameter is 100 kpc. At the redshift of the intervening absorbers, the maximum impact parameters correspond to 124 for and 144 for , including the uncertainty of 04 in the afterglow localisation.
After the afterglow faded, several spectra were acquired with VLT/FORS2. In addition, the field was also the target of an extensive photometric campaign covering nine filters from 473.1 nm (-band) to ; for full details we refer to Sect. 2.1 and Table 1. This allows us to elucidate the nature of several objects within 100 kpc, not only of those that were covered by a slit and bright enough for a spectrum to be extracted. In the following, we only consider those objects that are either detected in at least five filters to attempt SED modelling, or fall in one of the slit positions. In total, 11 objects within 100 kpc of the afterglow position fulfil these criteria (Fig. 2, Table 9). Among them, 9 fell into one of the slits.
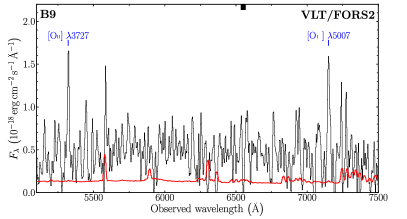
The two brightest objects (B4 and B10) within the 100 kpc radius are late-type stars. The spectrum of B9 exhibits two emission lines at 5322.1 and 7149.3 Å both detected at confidence level (Fig. 10). We identify these lines as [O ii] 3727 and [O iii] 5007 at a common redshift of .
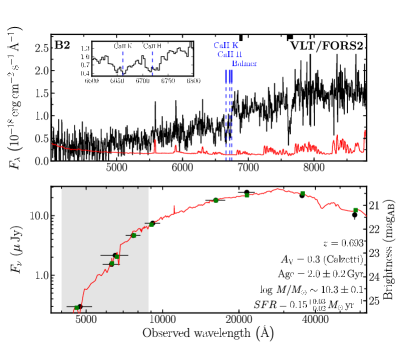
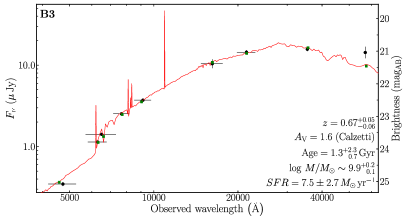
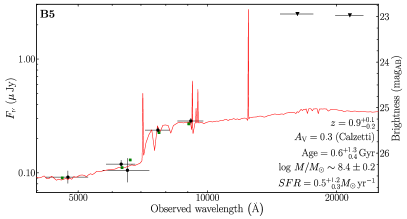
The spectrum of object B2 (Fig. 11) has a continuum break at Å and absorption lines at 6660.2 and 6719.5 Å. These features are consistent with the Balmer break and Ca ii K&H absorption at a redshift of . The S/N ratio of the VLT/FORS2 spectra of B3 and B6 are too low for redshift determination.131313The spectrum of B3 shows a prominent emission line at . The bright [O i] sky emission line at 6300.3 Å partly overlaps with this feature, making the identification ambiguous. If this is indeed an emission line of galaxy B3, it is likely redshifted to , coinciding in redshift with a strong Mg ii absorber. Both objects are detected in the nine filters, see Fig 12 and Fig. 14. The best fits to their SEDs suggest that B3 and B6 are galaxies at and , respectively. Object B5 was detected in five filters from 473 to 766 nm (Fig. 13). The SED is best described by a young and small galaxy at . We caution that the solution is not unique because the galaxy is only detected in five filters. The redshifts of B2, B3, B5 and B6 match the redshifts of the strong Mg ii absorbers at and 1.4288 towards GRB 050820A, see Table 8.
The continua of objects B7 and B8 are visible in the 2D spectrum. Due to seeing the spectrum of B8 is not resolved into the two objects B8N and B8S as seen in the HST image. The extracted 1D spectra of B7 and B8 have a low S/N ratio and thus their redshifts cannot be determined. Recently, Chen (2012) observed the field with the IR echellete spectrograph FIRE mounted on the Magellan telescope. The slit was oriented to cover object B7 and the compound B8. Based on these observations, Chen (2012) found that the galaxy B7 and the host complex B8 are a group of galaxies at , in contrast to Chen et al. (2009) who suggested that B7 and B8S are interacting galaxies forming the strong Mg ii absorber at .
Although we elucidated the nature of all objects within 37 that are visible in the HST images, we did not identify a possible galaxy counterpart of the intervening sub-DLA. We also did not find any candidate brighter than with an maximum impact parameter of 50 (100) kpc.
3.3 GRB 050908
The afterglow spectrum of GRB 050908 (), obtained with VLT/FORS1, revealed an intervening DLA at with , as derived from the Voigt profile fit shown in Fig. 3. We thus revise the conclusion by Fynbo et al. (2009) that this intervening absorber is a sub-DLA. This DLA is peculiar for its strong metal lines () that are stronger than those of most intervening DLAs (Fynbo et al. 2009, their Fig. 11). In addition, the afterglow spectrum comprises of an intermediate Mg ii absorber at . The properties of both absorbers are summarised in Tables 7 and 8.
At the redshift of the intervening Mg ii absorber and the DLA, an impact parameter of 100 kpc corresponds to an angular distance of 120 and 126, respectively, including the uncertainty in the afterglow position of 03. The GRB field and the galaxies within this impact parameter are shown in Fig. 4.
An afterglow spectrum was acquired with VLT/FORS1 () and with Gemini-N/GMOS (). In addition, a further spectrum was obtained with VLT/FORS1 () two years later (Table 1). Both FORS1 spectra cover several faint objects () within the 100-kpc radius (Fig. 4, Table 9). Apart from the afterglow, we only detect a very weak emission feature at Å at the position of C1. Assuming that this is a genuine emission line, the line is likely Ly redshifted to , and not because of the non-detection of H and . The Gemini spectrum () does not cover any of the faint objects visible in the -band image and we do not detect any emission line in these data.
Since the field is quite crowded and the amount of spectroscopic and multi-filter data are limited, we can only place a shallow upper limit on the brightness of the galaxy counterpart of the both absorption-line systems. Assuming a maximum impact parameter of 50 or 100 kpc, the galaxy counterpart cannot be brighter than and 24.7 mag in the band.
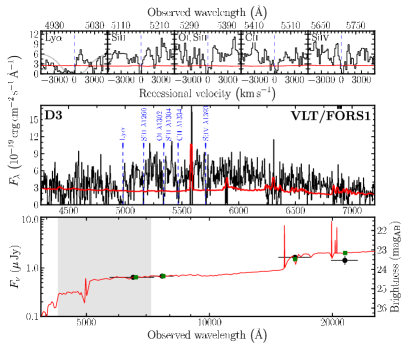
3.4 GRB 070721B
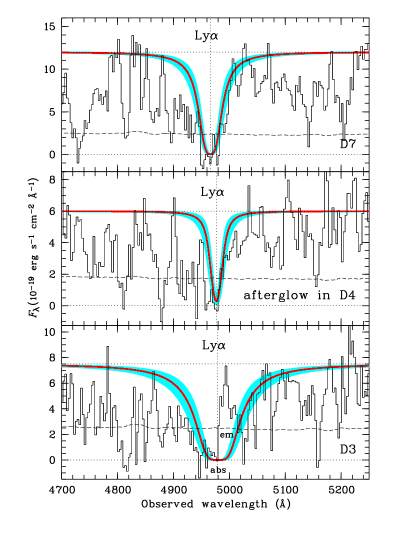
The VLT/FORS2 afterglow spectrum of GRB 070721B () revealed an intervening absorber at , a sub-DLA with strong metal absorption lines (; Table 7). Figure 5 displays the Ly absorption profile; the Voigt profile fit gives . In Figure 6 we show the field of view and highlight the maximum impact parameter of 100 kpc, corresponding to 133 at , including the uncertainty in the afterglow localisation of 04.
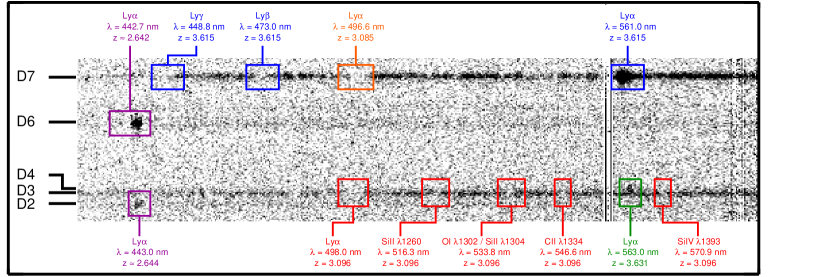
Four months after the GRB, an additional spectrum with was acquired with VLT/FORS1. The spectrum covers several objects within the 100 kpc radius (Table 9). The 2D spectrum shown in Fig. 7 reveals that this is a very complex and perplexing line-of-sight. The galaxy D7, which was also detected in the 2D-spectrum of the afterglow, is a bright Ly emitter at - very similar to the redshift of the GRB. Object D4 is the host galaxy of GRB 070721B and is only detected by its Ly emission line in the 2D spectrum (Fig. 7). The emission line redshift () differs slightly from the absorption-line redshift (), derived from metal lines in the afterglow spectrum (see Milvang-Jensen et al. 2012 for a detailed discussion). In the spectrum of the galaxy D3 we detect several strong metal lines as well as a strong Ly absorption line at a common redshift of . This galaxy has an impact parameter of only 1″relative to the GRB position. Hence, D3 must be the galaxy counterpart of the DLA seen in the GRB afterglow spectrum. This was also suggested by Fynbo et al. (2009) and Chen et al. (2009). Intriguingly, D7 also has an intervening strong Ly absorption line at a very similar redshift (); we derive a H i column density of from the Voigt profile fitting, as shown in Fig. 5.141414There are some uncertainties in the Ly profile fits for D3, D4 and D7. Because of the resolution and the quality of the spectra, the damped wings are barely visible (see Fig. 5). We cannot rule out the possibility that a blend of narrow Ly lines mimics the strong absorption feature. It is not very likely, because it would require that D3 and D7 have a comparable density of H i clumps at almost identical redshifts. Strictly speaking, the stated column densities are only upper limits. The fit does not rule out an extremely large Doppler parameter (), implying a reduction of the H i content by a factor of 100. This remark has in particular to be kept in mind for the strong Ly absorption feature of the intervening absorber towards D7. However, we do not detect metal lines associated with this intervening absorption line system.151515We obtain the following upper limits from the VLT/FORS1 spectrum, assuming an aperture of (twice the of a Gaussian with a Doppler parameter of ): , , , , , , and . These limits, are on average less stringent than the measurements of the detected metal lines in the DLA galaxy D3 (see Table 17). At that redshift the angular separation between D3 and D7 of 207 translates into a transverse distance of 161 kpc. The weak trace below D7 is from the galaxy D6. This spectrum displays a single strong emission line. It is very likely Ly at and not , because of the lack of H and in emission. The spectrum of D2 shows that this is also a Ly emitter at a very similar redshift to that of D6, . In the spectrum of the afterglow we detect absorption lines from Ly, and the C iv doublet (unresolved) at albeit a low S/N ratio. The velocity distance between the absorption and emission line redshifts is .
4 Discussion
4.1 Detected galaxy counterparts
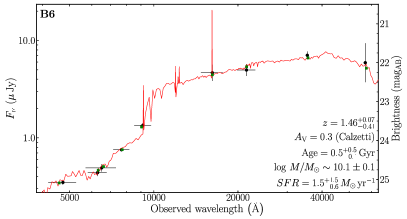
4.1.1 DLA galaxy towards GRB 070721B
In Sect. 3.4 we showed that the galaxy counterpart of the intervening DLA (object D3, ) has an impact parameter of 7.9 kpc and an extinction-corrected -band magnitude of mag (Fig. 6, Table 9). The co-ordinates are and with an uncertainty of 04 in each coordinate. We denote the object as DLA J0212-0211 in the following. Up to now, only one further sub-DLA/DLA galaxy was identified beyond . Djorgovski et al. (1996) found the galaxy counterpart () to the sub-DLA (; Lu et al. 1993) towards QSO B2233+131. Compared to typical galaxies, both objects are comparable to the brightness of an galaxy (; Steidel et al. 1999).
At low- (), the overwhelming majority (75%) of sub-DLA/DLA galaxies summarised in Péroux et al. (2011) are fainter than both sub-DLA/DLA galaxies. The mean luminosity of that sample is and the median is . The sample is not tightly distributed around the mean and the brightest galaxy in that ensemble reaches . A proper comparison with high-z () DLA galaxies is not possible. To date, the luminosity of only 4 of 10 sub-DLA/DLA galaxies is known. The reason for this is that most of them were detected by their Ly emission and have small impact parameters so that they are outshone by the glare of the quasar. This hampers the determination of their luminosity. Chen et al. (2009) concludes that the DLA galaxy in the field of GRB 070721B is the most luminous DLA galaxy at . The morphology of the galaxy is undisturbed, based on the shape in the HST image, inset in Fig. 6. We measure an ellipticity of 0.15 and a half-light radius of 1.2 kpc, obtained with SExtractor. The non-detection of a galaxy interaction or merger is not surprising. Overzier et al. (2010) argued that a detection is hampered at because of the reduced physical resolution and sensitivity in addition to the general difficulties of observing interacting galaxies.
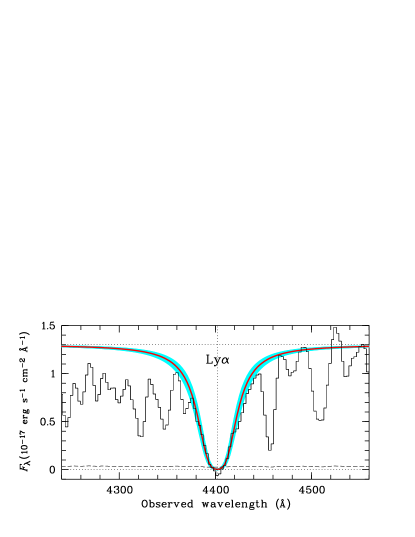
The Ly absorption line shows an excess of flux in the red part of the absorption profile (Fig. 5; Sect. 3.4). The extracted emission line profile, shown in Fig. 8, is slightly asymmetric and peaks at with respect to the systemic redshift. We measure a line flux density of , i.e. a line significance of 9.2 . Pettini et al. (1998a, b, 2000) reported the detection of the same feature with peak recessional velocities between and in several galaxies (see also Adelberger et al. 2003). They argue that this feature is similar to a P-Cygni profile, indicating the presence of a galactic outflow (also found in starburst galaxies; e.g. Kunth et al. 1998; Gonzalez Delgado et al. 1998; but see also Verhamme et al. 2006; Laursen et al. 2009).
To further explore the properties of the galaxy counterpart, we fit the SED with Le PHARE (Sect. 2.3), as displayed in Fig. 8. Leaving all model parameters free, except for the redshift, which was fixed to , the SED is best described by a young () and close to dust-free galaxy (, Calzetti reddening; see Table 16 for all best fit values). The SFR of is similar to the that of the DLA galaxy (Djorgovski et al. 1996; Christensen et al. 2004b; Péroux et al. 2011) and similar to the SFR of typical -band dropout LBGs (Giavalisco 2002).
| GRB 050820A | GRB 070721B | ||||
| B2 | B3 | B5 | B6 | D3 | |
| 0.693 | 3.096 | ||||
| 87.5 | 36.8 | 26.4 | 42.0 | 7.9 | |
| 0.3 | 0.2 | 0.03 | 0.9 | ||
| Dust model | Calzetti | ||||
| 0.3 | 1.6 | 0.3 | 0.3 | ||
| Age (Gyr) | |||||
| a𝑎aa𝑎a” | 16.3/9 | 7.3/9 | 1.5/5 | 1.6/9 | 5.0/4 |
| Ion | Transition | a𝑎aa𝑎aT | a𝑎aa𝑎aT | |||||
| (Å) | (Å) | (Å) | ||||||
| Spectrum of the DLA galaxy D3 | D3 in the afterglow spectrum | |||||||
| H i | 1215 | b𝑏bb𝑏bD | b𝑏bb𝑏bD | |||||
| Si ii | 1260 | c𝑐cc𝑐cT | … | … | ||||
| O i / Si ii | 1302/1304 | … | … | … | … | |||
| C ii | 1334 | … | … | |||||
| Si iv | 1393 | … | … | … | ||||
| Si ii | 1526 | … | … | c𝑐cc𝑐cT | ||||
| C iv | 1548/1549 | … | … | … | ||||
| Fe ii | 1608 | … | … | |||||
| Al ii | 1670 | … | … | |||||
Because of the small impact parameter of the DLA counterpart (), the GRB line-of-sight can be extinguished by the dust in the DLA galaxy if it contains dust (see Fynbo et al. 2011 for an example). Fynbo et al. (2009) derive the spectral slope between the optical and X-ray bands, , to be 0.72. According to Jakobsson et al. (2004), a dust-extinguished optical afterglow would result in , which is not the case for GRB 070721B. Zafar et al. (2011) obtained a visual extinction of , assuming that all extinction is attributed to an absorber in the host galaxy of GRB 070721B. This value is typical for GRB host galaxies (Kann et al. 2010; Schady et al. 2010; Zafar et al. 2011). Motivated by the fact that some GRBs show negligible host reddening, the presence of a foreground absorber cannot be excluded. Assuming the DLA to be responsible for the observed reddening, we expect that increases only slightly (Greiner et al. 2011, their Fig. 3). Hence, we can in this case exclude the presence of significant amounts of dust, i.e. , in the outskirts of the DLA galaxy.
In addition, we measure the s of absorption lines in the DLA galaxy spectrum D3 and of absorption lines imprinted from the DLA galaxy on the GRB afterglow spectrum. The s and column density estimates are listed in Table 17. By comparing the two sets of data it is evident that the DLA galaxy shows a higher than in the afterglow spectrum (see Fig. 5). This trend is also confirmed by all the metal s being higher for the DLA galaxy, despite the individual large errors. These results are easily explained if most of the DLA galaxy light arises from the central, i.e. denser, region of the galaxy, while the GRB afterglow radiation shone through a more peripheral region of the host.
Finally, the most constraining metallicity estimate for the D3 galaxy is (measured from the GRB afterglow spectrum). Iron being a very refractory element, a significant amount of Fe could be depleted into dust grains and not observed in the gas-phase. If this is the case, then the intrinsic metallicity would increase to solar or super-solar values, while GRB DLAs typically show solar or sub-solar metallicities (see Fynbo et al. 2009, and references therein). A more likely scenario is a limited amount of dust in the DLA galaxy, also supported by the low reddening along the line-of-sight () estimated from the SED. Thus, the metallicity along the GRB line-of-sight, i.e. 7.9 kpc away from the galaxy centre, is close to . A higher metallicity could possibly be found in the central regions of the DLA galaxy, given the likely metallicity gradient, but cannot be constrained from our dataset due to absorption-line saturation.
In conclusion, the properties of the DLA galaxy D3 are very typical for LBGs, except that the halo of the galaxy harbours a large amount of neutral hydrogen. This is consistent with the model that DLAs are gaseous halos of faint high- LBGs (Fynbo et al. 1999; Møller et al. 2002; Fynbo et al. 2008; Rafelski et al. 2011).
4.1.2 Mg ii absorbers towards GRB 050820A
In addition to the intervening sub-DLA towards GRB 050820A, the afterglow traverses two strong Mg ii absorbers at and 1.4288 (see Table 8). We find four galaxies within 100 kpc that are consistent with either , namely B2, B3 and B5 (Figs. 11, 12, 13, Table 9), or , namely B6 (Fig. 14, Table 9).181818The photometric redshift of B6 also matches that of a weak Mg ii absorber at towards GRB 050820A. It is unlikely that the galaxy is the counterpart of the weak Mg ii absorber, because the correlation length of weak Mg ii absorbers is kpc (Ellison et al. 2004). The properties of the best-fit galaxy templates are summarised in Table 16.191919 We remind the reader that the solution of B5 is not unique, because it is only detected in five filters.
The impact parameters vary between 26 and 88 kpc for the candidates of the Mg ii absorber at . Galaxy counterparts with an absorption cross-section of more than 88 kpc are rare; for instance Chen et al. (2010) used a set of 94 galaxies () that are located up to 120 kpc around 70 background quasars () to study which kind of Mg ii absorber could be found in the quasar spectrum arising from these galaxies. They did not find any strong Mg ii absorber in a quasar spectrum that is related to a galaxy at a distance of more than from the line of sight of the quasar. Hence, the early-type galaxy B2 is probably not the galaxy counterpart of the absorption-line system. The impact parameters of B3 and B5 are typical for strong Mg ii absorbers (Chen et al. 2010), though at the upper end of the impact parameter distribution. The properties of B3 and B5 are very different from each other (Table 16), B3 is a massive galaxy with a high , while B5 is a young low-mass galaxy with low . These differences are also reflected in their luminosities; adopting the Dahlen et al. (2005) LF, B3 is , and B5 is 6 times fainter (). Both values are in the range of the observed luminosities of the Chen et al. (2010) sample, but in their fainter half.
Galaxy B6 is the most likely galaxy counterpart of the strong Mg ii absorber at . The impact parameter of 42 kpc (49; Table 16) is similar to the impact parameter of the galaxy counterpart candidates of the Mg ii absorber at . The properties of the best-fit galaxy template, displayed in Table 16, show that it is a fairly bright () galaxy with (Fig. 14).
Without additional spectroscopic data it is not possible to decide which of two candidates is the galaxy counterpart of the strong Mg ii absorber and if B6 is the galaxy counterpart to the Mg ii absorber at . Chen (2012) places an upper limit on the brightness of the galaxy counterpart of , i.e. fainter than a galaxy, if the impact parameter is less than 35.
4.2 Limits on galaxy counterparts
In the previous sections we discussed the properties of the detected DLA galaxy towards GRB 070721B and of the galaxy counterpart candidates of the two strong Mg ii absorbers towards GRB 050820A. In this section we present the limits, such as luminosity and , on the non-detected galaxy counterparts. The limits on the luminosities shown in Table 20 are related to the knee of the Dahlen et al. (2005) and the Reddy et al. (2008) LFs. The galaxy counterparts are fainter than a and galaxy in all fields, if the impact parameter is 50 and 100 kpc, respectively. The most stringent upper limit of can be placed on the galaxy counterparts of the intervening sub-DLA towards GRB 050820A. For this field, Chen (2012) reports that the galaxy counterpart is fainter than , corresponding to , if the impact parameter is smaller than 35.
| Absorber | for | Fynbo | ||
|---|---|---|---|---|
| (100) kpc | model | |||
| GRB 050730 | ||||
| DLA | 3.56439 | |||
| sub-DLA | 3.02209 | |||
| Mg ii | 2.25313 | |||
| Mg ii | 1.7743 | |||
| GRB 050820A | ||||
| sub-DLA | 2.3598 | a𝑎aa𝑎aT | ||
| GRB 050908 | ||||
| sub-DLA | 2.6208 | |||
| Mg ii | 1.5481 | b𝑏bb𝑏bT | ||
Fynbo et al. (1999) suggested that DLAs are the gaseous halos of LBG (see also Møller et al. 2002; Fynbo et al. 2008; Rafelski et al. 2011). To confront our measurements with this model, we use the predictions on the brightness of galaxy counterparts by Fynbo et al. (2008). In their model, simple and constrained scaling relations of galaxies in the local Universe are used to predict the luminosity of intervening DLAs based on their metallicity and their impact parameter. These relations are strictly speaking only valid for DLAs. We also adopt this model for DLAs at lower redshift and for sub-DLAs. The main difference between a sub-DLA and a DLA is a larger covering fraction, i.e. impact parameter, if DLAs and sub-DLA are drawn from the same population of galaxies. Based on the measured metallicities, we estimate the brightness and the impact parameter of the unidentified DLA galaxies towards GRBs 050730 and 050820A. For GRB 050908, we used as a metallicity proxy (Prochaska et al. 2008).
The estimated brightnesses, shown in Table 20, indicate that most galaxy counterparts evaded detection because of their intrinsic faintness. This result is not surprising. The majority of all DLA galaxies are expected to be fainter than mag in the -band, i.e. , in the Fynbo et al. (2008) model. The model clearly rules out large impact parameters. Even the larger covering fraction of sub-DLAs does not imply impact parameters of more than 2–3′′ (15.7–23.5 kpc at ). The intervening DLA towards GRB 050908 possibly has a galaxy counterpart.
We find several objects in the field of GRBs 050730 and 050908 that fulfil both criteria, being very faint and having a very small impact parameter (Table 9). There are several objects with a brightness of within 25 of the afterglow position of GRB 050730. If one of these objects is the galaxy counterpart to the sub-DLA, it is a galaxy. In the field of GRB 050908 we find four objects ranging in brightness from to 27 mag within of the afterglow position, corresponding to . To elucidate the nature of these objects, more data is required.
4.3 Quasar radiation field
| Species | Redshift | a𝑎aa𝑎aT | ||
|---|---|---|---|---|
| (Å) | (Å) | (Å) | ||
| 3658 | 911.20 | Ly-limit | 3.01 | |
| Ly + O vi | ||||
| 4888 | 1215.80 | Ly | 3.02 | |
| 4992.72 | 1239.42 | N v | 3.028 | |
| 5621.30 | 2026.14 | Zn ii | 1.77425 | |
| 6208.75 | 1548.20 | C iv | 3.010 | |
| 6210.62 | 1548.20 | C iv | 3.011 | |
| 6219.37 | 1550.77 | C iv | 3.010 | |
| 6220.87 | 1550.77 | C iv | 3.011 | |
| 6229.35 | 1545.86 | C iv | 3.030 | |
| 6503.52 | 2344.21 | Fe ii | 1.77425 | |
| 6610.51 | 2382.77 | Fe ii | 1.77425 | |
| 7145.59 | 2586.65 | Fe ii | 1.77425 | |
| 7213.61 | 2600.17 | Fe ii | 1.77425 | |
| Si ii, C iii/Fe ii | 3.018 | |||
| 7756.18 | 2796.35 | Mg ii | 1.77425 | b𝑏bb𝑏bT |
| 7777.52 | 2803.53 | Mg ii | 1.77425 |
he restframe s ( errors) and the detection limits are measured assuming an aperture of , i.e. a Gaussian with Doppler parameter . he of the lines of the Mg ii doublet are similar, indicating that the lines are saturated.
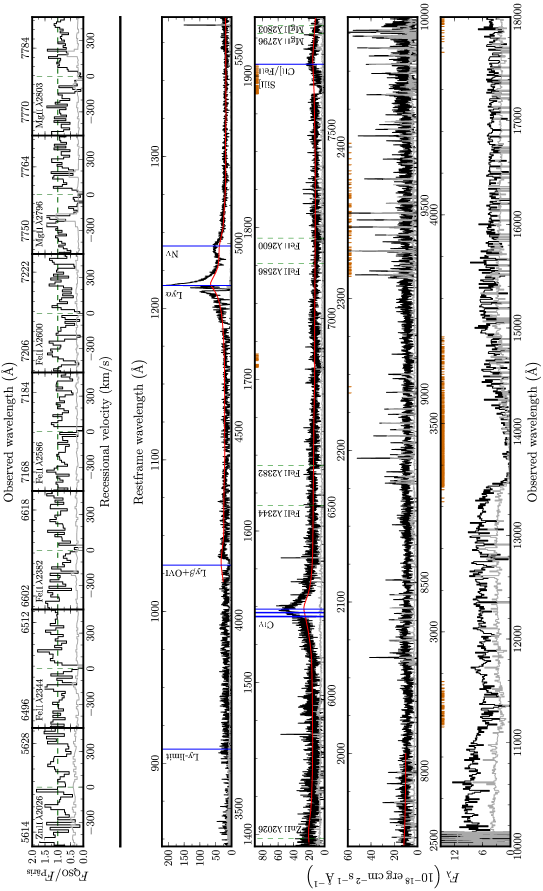
In Sect. 3.1, we alluded to the serendipitous coincidence of the sub-DLA () towards GRB 050730 and the QSO that is 175 south of the GRB position. Before we discuss their connection, we present general properties of the quasar.
After subtracting the bright foreground star (Sect. 2.2; Table 9), we measure an -band magnitude of mag (corrected for Galactic extinction, Table 9). The coordinates of the quasar are and , with an uncertainty of 04. Hereafter the QSO is denoted as QSO J1408-0346. Figure 9 shows the quasar spectrum secured with X-shooter on 18 April, 2010. Table 21 summarises the detected quasar emission and absorption lines; the mean emission line redshift is . The emission lines are substantially narrower in comparison to the quasar composite spectrum by Pâris et al. (2011), which is overplotted in red. In addition to the emission lines, we detect C iv and Ly in absorption at (Table 21). The narrow C iv absorption lines consist of two blueshifted velocity components at 1420 and 1497 km s-1 with respect to the maximum of the C iv emission line.
The proximity of the GRB line-of-sight can constrain the quasar radiation field. Fox et al. (2007) reports that DLAs and sub-DLAs bearing N v are extremely rare, and that several of these have a nearby QSO coincident () at the (sub)-DLA redshift (see also Fox et al. 2007; Ellison et al. 2010). We do not find evidence for N v in absorption in the GRB afterglow spectrum. Besides this, the ionising UV radiation field of a bright quasar can also lead to visible underdensity in the Ly forest as the redshift approaches the quasar emission redshift. This is referred to as the proximity effect (Carswell et al. 1982; Tytler 1987; Bajtlik et al. 1988). In addition, if the quasar radiates isotropically, the line of sight of GRB 050730 might show an underdensity in the Ly forest around the redshift of the foreground quasar (i.e. the transverse proximity effect; Bajtlik et al. 1988). At the projected distance of kpc, the QSO with an inferred Lyman-limit flux density of exceeds the H i UV background at by a factor of (Guimarães et al. 2007; Dall’Aglio et al. 2009). In this case, the Ly forest at the redshift of the QSO is dominated by the sub-DLA so it impossible to infer if there is an effect of the QSO on the IGM along the GRB afterglow line-of-sight.
4.4 Correlated structures
The spectra of GRB 050730 and the QSO 175 south of it (Fig. 1) share a common wavelength interval, as do GRB 070721B and the bright galaxy D7 207 SW of it (Fig. 6). These allow us to identify correlated structures in both fields. We are in particularly interested in absorbers with metal lines, because they are related to galaxies. Their detections provide information on galaxy impact parameters and their clustering.
Correlated structures have been found in several quasar pairs on a length scale of a few kpc up to kpc (e.g. Smette et al. 1995; Petry et al. 1998; Ellison et al. 2004, 2007), and on a length scale of several hundreds of kpc up to a few Mpc (Francis & Hewett 1993; Francis et al. 1996; Fynbo et al. 2003; D’Odorico et al. 2002; Coppolani et al. 2006). In the literature, two different scenarios are discussed to explain correlated structures on these different length scales: a) the lines of sight probe the halo of one galaxy, or of a galaxy and a satellite galaxy, and b) the different lines of sight probe different galaxies that belong to a group of galaxy and are part of a large scale structure. Here we argue that the latter interpretation of correlations being due to large scale structure explains better our observations of the absorbers in both GRB fields.
4.4.1 The field of GRB 050730
The lines of sight of GRB 050730 and QSO J1408-0346 are separated by 175. We identify a Mg ii at in both of them, as well as the sub-DLA towards the GRB and QSO J1408-0346 that are at almost identical redshifts (, ).
The coincidence of the sub-DLA and the QSO is in line with evidence for anisotropic emission of QSOs, which seem to have cleared their surroundings preferentially towards us rather than perpendicular to the line-of-sight (Hennawi & Prochaska 2007). At least it suggests that QSOs reside in over-dense regions (Rollinde et al. 2005; Faucher-Giguère et al. 2008). The angular distance of 175 between the sub-DLA and the QSO translates into a transverse distance of 137 kpc at , which is several times larger than the typical sub-DLA impact parameter of kpc in Péroux et al. (2011) and Krogager et al. (2012). Ellison et al. (2010) argue that proximate DLAs, i.e. DLAs within a comoving distance of 42 Mpc () around QSOs, are not associated with the QSO host, but rather sample overdensities around it (see also Russell et al. 2006). Therefore, the intervening sub-DLA towards GRB 050730 could be an overdensity in the vicinity of the QSO rather than a part of the massive halo of the quasar host galaxy.
The common Mg ii absorbers towards GRB 050730 and the QSO are at and . Vergani et al. (2009) reported a restframe Mg ii equivalent width of and Prochaska et al. (2007a) reported that the doublet is saturated so that the absorber can be placed in the strong Mg ii absorber category. For the intervening Mg ii absorber towards the QSO, we measure (saturated; Table 21). In addition, we detect Zn ii 2026 and several Fe ii absorption lines of that absorber at the same redshift, summarised in Table 21. At the redshift of , the angular distance of 175 translates into a projected distance of kpc, while their redshift implies a velocity distance of 124 km s-1. Chen et al. (2010) reports a typical impact parameter of around kpc for Mg ii absorbers (see also Smette et al. 1995), arguing against the hypothesis that both strong Mg ii absorbers are associated with the same galaxy.222222The galaxy counterpart of the Mg ii absorber towards the QSO is fainter than 26.5 (25.1) mag in (corrected for Galactic extinction) for an impact parameter of 50 kpc (100 kpc), assuming that the galaxy counterpart is neither in the glare of the QSO, nor at the position of the foreground star. Adopting the Dahlen et al. (2005) LF, the limiting magnitudes correspond to and . Finally, we note that there is a high-column density absorber at in the afterglow spectrum, which has no counterpart in the spectrum of the quasar.
4.4.2 The field of GRB 070721B
In Sect. 3.4 we identified object D3 as the galaxy counterpart of the intervening DLA in the afterglow spectrum of GRB 070721B. In addition, we identified another intervening DLA towards the Ly emitter D7 that is at a similar redshift and has a similar H i column density to the DLA galaxy, but is 160.7 kpc from the location of D3 (Figs. 5, 6). It is unlikely that the intervening DLA towards D7 is gravitationally bound to the DLA galaxy D3 because of this large impact parameter. The average impact parameter of DLAs is 13 kpc, although Francis et al. (1996) also report a candidate a counterpart with impact parameter of 182 kpc.
D3 and the intervening absorber towards D7 appear more similar to the pairs of intervening absorption-line systems discussed in Ellison et al. (2007).232323The galaxy counterpart of the intervening DLA towards D7 is fainter than 25.2 mag in , assuming an impact parameter of 50 to 100 kpc, corresponding to , using the LF in Reddy et al. (2008). They found found a pair of sub-DLAs at and a pair of DLAs at towards a binary quasar, where the individual absorbers of each pair are separated by . Based on simulations, they showed that the presence of a large scale structure is more likely than the different lines of sight probing the halo of two massive galaxies at and 2.94, respectively. In this case, the probability increases from to 0.01. We find several correlated structures on a length scale of in the fields of GRBs 050730 and 070721B. These are most likely further examples for a group environment of intervening absorption-line systems.
5 Conclusions
The aim of our work is to detect galaxy counterparts of high- intervening sub-DLAs and DLAs. In contrast to previous studies, we use GRBs to have a clear view on the region that is usually outshone by the glare of a quasar. Since the launch of the Swift satellite, seven intervening sub-DLAs and DLAs have been found towards six GRBs. Among them four lines-of-sight have sufficient photometric and spectroscopic data to study very faint objects.
In our study we successfully detected the DLA galaxy, causing the intervening DLA absorption towards GRB 0707021B, from the afterglow position, as suggested by Chen et al. (2009) and Fynbo et al. (2009). However, these authors did not present any spectroscopic evidence for their inference. In fact, the DLA galaxy would have been almost impossible to detect by direct imaging if the background source would have been a 19-mag quasar. This underlines the argument by Jakobsson et al. (2004) that studies of the galaxy counterparts of intervening absorption line systems towards QSOs can be affected by misidentifications. Hence, proximity is not sufficient for an association. For instance in the case of GRB 050820A, the extensive photometric and spectroscopic campaigns allow us to successfully rule out all objects brighter 26.2 mag in -band within 37, corresponding to at . Assuming that sub-DLAs and DLAs are LBGs weighted by their H i cross-section, Fynbo et al. (2008) showed that the overwhelming majority of intervening DLA galaxies are expected to be fainter than this, naturally explaining the non-detections. Even with the largest telescopes, it is difficult to detect and elucidate the nature of such faint objects. On the other hand, there are cases where intervening absorption-line systems were successfully associated with galaxies at larger distances (e.g. Francis & Hewett 1993), however they are just a minority.
The disadvantage of our approach is the vast amount of observing time required. Deep multi-filter observations exist for several GRBs. However, similar extensive spectroscopic campaigns do not exist for other GRB fields. In those cases, one relies on SED fitting techniques. Rao et al. (2011) showed that this can indeed be successful, in particular for very faint objects where only emission-line spectroscopy is feasible. Recently, Péroux et al. (2011) performed a survey for galaxy counterparts of intervening DLAs using the integral field unit VLT/SINFONI (see also Christensen et al. 2004a; Bouché et al. 2012). This approach could be complementary to the classical strategy of performing very deep imaging campaigns and spectroscopic follow-ups on candidates, or the use of narrow band and broad band strategy to search for emission line objects (e.g. Vreeswijk et al. 2003).
The DLA galaxy () in the field of GRB 070721B is the most luminous high- DLA galaxy known (Chen et al. 2009), and is almost as distant as the highest-redshift DLA galaxy known so far at . The number of high- sub-DLA and DLA galaxies increases thus from nine to 10. DLA J0212-0211 is very metal rich, . It does not differ from normal LBGs, with the exception of the large amount of H i in its halo.This supports a model in which DLAs can be gaseous halos of LBGs (Fynbo et al. 1999; Møller et al. 2002; Fynbo et al. 2008; Rafelski et al. 2011).
The extensive photometric and spectroscopic campaigns allowed us to identify galaxy counterpart candidates of two strong Mg ii absorbers at and 1.4288 towards GRB 050820A. The most likely candidates have impact parameters between 36.8 and 42.0 kpc, this being in the expected range of Mg ii absorbers (Chen et al. 2010). Their properties point to young star-forming galaxies, ranging in luminosity from to .
Finally, we studied the presence of correlated structures as a particular class of intervening absorption-line systems, a phenomenon observed in the field of GRBs 050730 and 070721B. We find evidence for three correlated structures in the field of GRB 050730 and one in the field of GRB 070721B. These absorbers range in redshift from to 3.096 and are probed over transverse distances between 137 and 161 kpc. All of them have associated metal absorption-lines. It is unlikely that the objects in these correlated structures are gravitationally bound to each other, based on simulations (e.g. Ellison et al. 2007). The detection is nevertheless intriguing. The average distance between quasar pairs is several times larger. Up to now, intervening absorption-line systems with coincidences in redshift have been found with separations of several hundreds of kpc up to a few Mpc (e.g. Francis & Hewett 1993; D’Odorico et al. 2002), but only few with a separation of kpc (Ellison et al. 2007). These serendipitous discoveries are important for studying the absorption cross-section of intervening absorption-line systems, their correlation length and their implications on galaxy groups in the early Universe.
Acknowledgments
SS, ADC and PJ acknowledge support by a Grant of Excellence from the Icelandic Research Fund. JPUF acknowledges support form the ERC-StG grant EGGS-278202. AR acknowledges support by the Thüringer Landessternwarte Tautenburg and by the Graduierten-Akademie Jena, Germany. SS thanks Daniele Malesani (Dark Cosmology Centre, Copenhagen) for many productive and valuable discussions and David Alexander Kann (Thüringer Landessternwarte Tautenburg, Germany) for many valuable comments.
References
- Adelberger et al. (2006) Adelberger, K. L., Steidel, C. C., Kollmeier, J. A., & Reddy, N. A. 2006, ApJ, 637, 74
- Adelberger et al. (2003) Adelberger, K. L., Steidel, C. C., Shapley, A. E., & Pettini, M. 2003, ApJ, 584, 45
- Arnouts et al. (1999) Arnouts, S., Cristiani, S., Moscardini, L., et al. 1999, MNRAS, 310, 540
- Asplund et al. (2009) Asplund, M., Grevesse, N., Sauval, A. J., & Scott, P. 2009, ARA&A, 47, 481
- Bajtlik et al. (1988) Bajtlik, S., Duncan, R. C., & Ostriker, J. P. 1988, ApJ, 327, 570
- Bertin & Arnouts (1996) Bertin, E. & Arnouts, S. 1996, A&AS, 117, 393
- Blanton & Roweis (2007) Blanton, M. R. & Roweis, S. 2007, AJ, 133, 734
- Bloom et al. (2009) Bloom, J. S., Perley, D. A., Li, W., et al. 2009, ApJ, 691, 723
- Bohlin & Gilliland (2004) Bohlin, R. C. & Gilliland, R. L. 2004, AJ, 127, 3508
- Bouché et al. (2012) Bouché, N., Murphy, M. T., Péroux, C., et al. 2012, MNRAS, 419, 2
- Bruzual & Charlot (2003) Bruzual, G. & Charlot, S. 2003, MNRAS, 344, 1000
- Calzetti et al. (2000) Calzetti, D., Armus, L., Bohlin, R. C., et al. 2000, ApJ, 533, 682
- Cardelli et al. (1989) Cardelli, J. A., Clayton, G. C., & Mathis, J. S. 1989, ApJ, 345, 245
- Carswell et al. (1982) Carswell, R. F., Whelan, J. A. J., Smith, M. G., Boksenberg, A., & Tytler, D. 1982, MNRAS, 198, 91
- Chabrier et al. (2000) Chabrier, G., Baraffe, I., Allard, F., & Hauschildt, P. 2000, ApJ, 542, 464
- Chandra & Frail (2012) Chandra, P. & Frail, D. A. 2012, ApJ, 746, 156
- Chen & Lanzetta (2003) Chen, H. & Lanzetta, K. M. 2003, ApJ, 597, 706
- Chen et al. (2009) Chen, H., Perley, D. A., Pollack, L. K., et al. 2009, ApJ, 691, 152
- Chen et al. (2005) Chen, H., Prochaska, J. X., Bloom, J. S., & Thompson, I. B. 2005, ApJ, 634, L25
- Chen (2012) Chen, H.-W. 2012, MNRAS, 419, 3039
- Chen et al. (2010) Chen, H.-W., Helsby, J. E., Gauthier, J.-R., et al. 2010, ApJ, 714, 1521
- Chen et al. (2000) Chen, H.-W., Lanzetta, K. M., & Fernández-Soto, A. 2000, ApJ, 533, 120
- Christensen et al. (2004a) Christensen, L., Sánchez, S. F., Jahnke, K., et al. 2004a, Astronomische Nachrichten, 325, 124
- Christensen et al. (2004b) Christensen, L., Sánchez, S. F., Jahnke, K., et al. 2004b, A&A, 417, 487
- Coppolani et al. (2006) Coppolani, F., Petitjean, P., Stoehr, F., et al. 2006, MNRAS, 370, 1804
- Courbin et al. (2000) Courbin, F., Magain, P., Kirkove, M., & Sohy, S. 2000, ApJ, 529, 1136
- Dahlen et al. (2005) Dahlen, T., Mobasher, B., Somerville, R. S., et al. 2005, ApJ, 631, 126
- Dall’Aglio et al. (2009) Dall’Aglio, A., Wisotzki, L., & Worseck, G. 2009, arXiv:0906.1484
- Devillard (1997) Devillard, N. 1997, The Messenger, 87, 19
- Djorgovski et al. (1996) Djorgovski, S. G., Pahre, M. A., Bechtold, J., & Elston, R. 1996, Nature, 382, 234
- D’Odorico et al. (2002) D’Odorico, V., Petitjean, P., & Cristiani, S. 2002, A&A, 390, 13
- Ellison (2006) Ellison, S. L. 2006, MNRAS, 368, 335
- Ellison et al. (2007) Ellison, S. L., Hennawi, J. F., Martin, C. L., & Sommer-Larsen, J. 2007, MNRAS, 378, 801
- Ellison et al. (2004) Ellison, S. L., Ibata, R., Pettini, M., et al. 2004, A&A, 414, 79
- Ellison et al. (2009) Ellison, S. L., Murphy, M. T., & Dessauges-Zavadsky, M. 2009, MNRAS, 392, 998
- Ellison et al. (2010) Ellison, S. L., Prochaska, J. X., Hennawi, J., et al. 2010, MNRAS, 406, 1435
- Ellison et al. (2006) Ellison, S. L., Vreeswijk, P., Ledoux, C., et al. 2006, MNRAS, 372, L38
- Ellison et al. (2002) Ellison, S. L., Yan, L., Hook, I. M., et al. 2002, A&A, 383, 91
- Faucher-Giguère et al. (2008) Faucher-Giguère, C., Lidz, A., Zaldarriaga, M., & Hernquist, L. 2008, ApJ, 673, 39
- Fazio et al. (2004) Fazio, G. G., Hora, J. L., Allen, L. E., et al. 2004, ApJS, 154, 10
- Fox et al. (2008) Fox, A. J., Ledoux, C., Vreeswijk, P. M., Smette, A., & Jaunsen, A. O. 2008, A&A, 491, 189
- Fox et al. (2007) Fox, A. J., Petitjean, P., Ledoux, C., & Srianand, R. 2007, A&A, 465, 171
- Francis & Hewett (1993) Francis, P. J. & Hewett, P. C. 1993, AJ, 105, 1633
- Francis et al. (1996) Francis, P. J., Woodgate, B. E., Warren, S. J., et al. 1996, ApJ, 457, 490
- Fumagalli et al. (2010) Fumagalli, M., O’Meara, J. M., Prochaska, J. X., & Kanekar, N. 2010, MNRAS, 408, 362
- Fynbo et al. (2009) Fynbo, J. P. U., Jakobsson, P., Prochaska, J. X., et al. 2009, ApJS, 185, 526
- Fynbo et al. (2010) Fynbo, J. P. U., Laursen, P., Ledoux, C., et al. 2010, MNRAS, 408, 2128
- Fynbo et al. (2003) Fynbo, J. P. U., Ledoux, C., Møller, P., Thomsen, B., & Burud, I. 2003, A&A, 407, 147
- Fynbo et al. (2011) Fynbo, J. P. U., Ledoux, C., Noterdaeme, P., et al. 2011, MNRAS, 413, 2481
- Fynbo et al. (2008) Fynbo, J. P. U., Prochaska, J. X., Sommer-Larsen, J., Dessauges-Zavadsky, M., & Møller, P. 2008, ApJ, 683, 321
- Fynbo et al. (2006) Fynbo, J. P. U., Starling, R. L. C., Ledoux, C., et al. 2006, A&A, 451, L47
- Fynbo et al. (1999) Fynbo, J. U., Møller, P., & Warren, S. J. 1999, MNRAS, 305, 849
- Giavalisco (2002) Giavalisco, M. 2002, ARA&A, 40, 579
- Gonzalez Delgado et al. (1998) Gonzalez Delgado, R. M., Leitherer, C., Heckman, T., et al. 1998, ApJ, 495, 698
- Greiner et al. (2011) Greiner, J., Krühler, T., Klose, S., et al. 2011, A&A, 526, A30
- Guimarães et al. (2007) Guimarães, R., Petitjean, P., Rollinde, E., et al. 2007, MNRAS, 377, 657
- Haehnelt et al. (1998) Haehnelt, M. G., Steinmetz, M., & Rauch, M. 1998, ApJ, 495, 647
- Hennawi & Prochaska (2007) Hennawi, J. F. & Prochaska, J. X. 2007, ApJ, 655, 735
- Henriksen (2008) Henriksen, C. 2008, Master’s thesis, DARK Cosmology Center - Niels Bohr Institute, Copenhagen University, Juliane Maries Vej 30, 2100 Copenhagen, ø Denmark
- Hjorth & Bloom (2011) Hjorth, J. & Bloom, J. S. 2011, arXiv:1104.2274
- Hjorth et al. (2012) Hjorth, J., Malesani, D., Jakobsson, P., et al. 2012, ApJ, submitted, arXiv:1205.3162
- Ilbert et al. (2006) Ilbert, O., Arnouts, S., McCracken, H. J., et al. 2006, A&A, 457, 841
- Jakobsson et al. (2004) Jakobsson, P., Hjorth, J., Fynbo, J. P. U., et al. 2004, A&A, 427, 785
- Jimenez et al. (1999) Jimenez, R., Bowen, D. V., & Matteucci, F. 1999, ApJ, 514, L83
- Kann et al. (2010) Kann, D. A., Klose, S., Zhang, B., et al. 2010, ApJ, 720, 1513
- Kouveliotou et al. (1993) Kouveliotou, C., Meegan, C. A., Fishman, G. J., et al. 1993, ApJ, 413, L101
- Krist (1993) Krist, J. 1993, in Astronomical Society of the Pacific Conference Series, Vol. 52, Astronomical Data Analysis Software and Systems II, ed. R. J. Hanisch, R. J. V. Brissenden, & J. Barnes, 536
- Krogager et al. (2012) Krogager, J.-K., Fynbo, J. P. U., Møller, P., et al. 2012, MNRAS, L461
- Krühler et al. (2011) Krühler, T., Greiner, J., Schady, P., et al. 2011, A&A, 534, A108
- Kunth et al. (1998) Kunth, D., Mas-Hesse, J. M., Terlevich, E., et al. 1998, A&A, 334, 11
- Landolt (1992) Landolt, A. U. 1992, AJ, 104, 340
- Larson et al. (2011) Larson, D., Dunkley, J., Hinshaw, G., et al. 2011, ApJS, 192, 16
- Laursen et al. (2009) Laursen, P., Sommer-Larsen, J., & Andersen, A. C. 2009, ApJ, 704, 1640
- Le Brun et al. (1997) Le Brun, V., Bergeron, J., Boisse, P., & Deharveng, J. M. 1997, A&A, 321, 733
- Ledoux et al. (2005) Ledoux, C., Vreeswijk, P., Ellison, S., et al. 2005, GCN Circ., 3860
- Ledoux et al. (2009) Ledoux, C., Vreeswijk, P. M., Smette, A., et al. 2009, A&A, 506, 661
- Letawe et al. (2008) Letawe, Y., Magain, P., Letawe, G., Courbin, F., & Hutsemékers, D. 2008, ApJ, 679, 967
- Lu et al. (1993) Lu, L., Wolfe, A. M., Turnshek, D. A., & Lanzetta, K. M. 1993, ApJS, 84, 1
- Magain et al. (1998) Magain, P., Courbin, F., & Sohy, S. 1998, ApJ, 494, 472
- Malesani et al. (2012) Malesani, D., Hjorth, J., Fynbo, J. P. U., Milvang-Jensen, B., & Jakobsson, P. 2012, in prep.
- Markwardt (2009) Markwardt, C. B. 2009, in Astronomical Society of the Pacific Conference Series; arXiv:0902.2850, Vol. 411, Astronomical Data Analysis Software and Systems XVIII, ed. D. A. Bohlender, D. Durand, & P. Dowler, 251
- Masetti et al. (2003) Masetti, N., Palazzi, E., Pian, E., et al. 2003, A&A, 404, 465
- Milvang-Jensen et al. (2012) Milvang-Jensen, B., Fynbo, J. P. U., Malesani, D., et al. 2012, ApJ, accepted, arXiv:1205.3779
- Møller et al. (2004) Møller, P., Fynbo, J. P. U., & Fall, S. M. 2004, A&A, 422, L33
- Møller & Warren (1993) Møller, P. & Warren, S. J. 1993, A&A, 270, 43
- Møller et al. (2002) Møller, P., Warren, S. J., Fall, S. M., Fynbo, J. U., & Jakobsen, P. 2002, ApJ, 574, 51
- Nagamine et al. (2007) Nagamine, K., Wolfe, A. M., Hernquist, L., & Springel, V. 2007, ApJ, 660, 945
- Noterdaeme et al. (2012) Noterdaeme, P., Laursen, P., Petitjean, P., et al. 2012, A&A, 540, A63
- Noterdaeme et al. (2009) Noterdaeme, P., Petitjean, P., Ledoux, C., & Srianand, R. 2009, A&A, 505, 1087
- Okoshi & Nagashima (2005) Okoshi, K. & Nagashima, M. 2005, ApJ, 623, 99
- Overzier et al. (2010) Overzier, R. A., Heckman, T. M., Schiminovich, D., et al. 2010, ApJ, 710, 979
- Pâris et al. (2011) Pâris, I., Petitjean, P., Rollinde, E., et al. 2011, A&A, 530, A50
- Perley et al. (2012) Perley, D. A., Bloom, J. S., Cenko, S. B., et al. 2012, in prep.
- Péroux et al. (2011) Péroux, C., Bouché, N., Kulkarni, V. P., York, D. G., & Vladilo, G. 2011, MNRAS, 410, 2237
- Péroux et al. (2012) Péroux, C., Bouché, N., Kulkarni, V. P., York, D. G., & Vladilo, G. 2012, MNRAS, 419, 3060
- Péroux et al. (2005) Péroux, C., Dessauges-Zavadsky, M., D’Odorico, S., Sun Kim, T., & McMahon, R. G. 2005, MNRAS, 363, 479
- Petry et al. (1998) Petry, C. E., Impey, C. D., & Foltz, C. B. 1998, ApJ, 494, 60
- Pettini et al. (1998a) Pettini, M., Kellogg, M., Steidel, C. C., et al. 1998a, ApJ, 508, 539
- Pettini et al. (2000) Pettini, M., Steidel, C. C., Adelberger, K. L., Dickinson, M., & Giavalisco, M. 2000, ApJ, 528, 96
- Pettini et al. (1998b) Pettini, M., Steidel, C. C., Adelberger, K. L., et al. 1998b, in Astronomical Society of the Pacific Conference Series, Vol. 148, Origins, ed. C. E. Woodward, J. M. Shull, & H. A. Thronson Jr., 67
- Piranomonte et al. (2008) Piranomonte, S., Ward, P. A., Fiore, F., et al. 2008, A&A, 492, 775
- Pollack et al. (2009) Pollack, L. K., Chen, H., Prochaska, J. X., & Bloom, J. S. 2009, ApJ, 701, 1605
- Prochaska et al. (2007a) Prochaska, J. X., Chen, H., Bloom, J. S., et al. 2007a, ApJS, 168, 231
- Prochaska et al. (2007b) Prochaska, J. X., Chen, H., Dessauges-Zavadsky, M., & Bloom, J. S. 2007b, ApJ, 666, 267
- Prochaska et al. (2008) Prochaska, J. X., Chen, H.-W., Wolfe, A. M., Dessauges-Zavadsky, M., & Bloom, J. S. 2008, ApJ, 672, 59
- Prochaska et al. (2005) Prochaska, J. X., Herbert-Fort, S., & Wolfe, A. M. 2005, ApJ, 635, 123
- Prochaska & Wolfe (1997) Prochaska, J. X. & Wolfe, A. M. 1997, ApJ, 487, 73
- Prochaska & Wolfe (1998) Prochaska, J. X. & Wolfe, A. M. 1998, ApJ, 507, 113
- Prochaska & Wolfe (2009) Prochaska, J. X. & Wolfe, A. M. 2009, ApJ, 696, 1543
- Prochter et al. (2006) Prochter, G. E., Prochaska, J. X., & Burles, S. M. 2006, ApJ, 639, 766
- Racusin et al. (2009) Racusin, J. L., Liang, E. W., Burrows, D. N., et al. 2009, ApJ, 698, 43
- Rafelski et al. (2011) Rafelski, M., Wolfe, A. M., & Chen, H.-W. 2011, ApJ, 736, 48
- Rao et al. (2011) Rao, S. M., Belfort-Mihalyi, M., Turnshek, D. A., et al. 2011, MNRAS, 416, 1215
- Rao & Turnshek (2000) Rao, S. M. & Turnshek, D. A. 2000, ApJS, 130, 1
- Rauch (1998) Rauch, M. 1998, ARA&A, 36, 267
- Reddy et al. (2008) Reddy, N. A., Steidel, C. C., Pettini, M., et al. 2008, ApJS, 175, 48
- Rollinde et al. (2005) Rollinde, E., Srianand, R., Theuns, T., Petitjean, P., & Chand, H. 2005, MNRAS, 361, 1015
- Russell et al. (2006) Russell, D. M., Ellison, S. L., & Benn, C. R. 2006, MNRAS, 367, 412
- Salvaterra et al. (2009) Salvaterra, R., Della Valle, M., Campana, S., et al. 2009, Nature, 461, 1258
- Schady et al. (2010) Schady, P., Page, M. J., Oates, S. R., et al. 2010, MNRAS, 401, 2773
- Sirianni et al. (2005) Sirianni, M., Jee, M. J., Benítez, N., et al. 2005, PASP, 117, 1049
- Smette et al. (1995) Smette, A., Robertson, J. G., Shaver, P. A., et al. 1995, A&AS, 113, 199
- Smith et al. (1989) Smith, H. E., Cohen, R. D., Burns, J. E., Moore, D. J., & Uchida, B. A. 1989, ApJ, 347, 87
- Starling et al. (2005) Starling, R. L. C., Vreeswijk, P. M., Ellison, S. L., et al. 2005, A&A, 442, L21
- Steidel et al. (1999) Steidel, C. C., Adelberger, K. L., Giavalisco, M., Dickinson, M., & Pettini, M. 1999, ApJ, 519, 1
- Stetson (2000) Stetson, P. B. 2000, PASP, 112, 925
- Tanvir et al. (2009) Tanvir, N. R., Fox, D. B., Levan, A. J., et al. 2009, Nature, 461, 1254
- Tody (1986) Tody, D. 1986, in Society of Photo-Optical Instrumentation Engineers (SPIE) Conference Series, Vol. 627, Society of Photo-Optical Instrumentation Engineers (SPIE) Conference Series, ed. D. L. Crawford, 733
- Tyson (1988) Tyson, N. D. 1988, ApJ, 329, L57
- Tytler (1987) Tytler, D. 1987, ApJ, 321, 69
- Vergani et al. (2009) Vergani, S. D., Petitjean, P., Ledoux, C., et al. 2009, A&A, 503, 771
- Verhamme et al. (2006) Verhamme, A., Schaerer, D., & Maselli, A. 2006, A&A, 460, 397
- Vreeswijk et al. (2004) Vreeswijk, P. M., Ellison, S. L., Ledoux, C., et al. 2004, A&A, 419, 927
- Vreeswijk et al. (2003) Vreeswijk, P. M., Møller, P., & Fynbo, J. P. U. 2003, A&A, 409, L5
- Warren et al. (2001) Warren, S. J., Møller, P., Fall, S. M., & Jakobsen, P. 2001, MNRAS, 326, 759
- Weatherley et al. (2005) Weatherley, S. J., Warren, S. J., Møller, P., et al. 2005, MNRAS, 358, 985
- Wolfe (1986) Wolfe, A. M. 1986, Royal Society of London Philosophical Transactions Series A, 320, 503
- Wolfe et al. (2005) Wolfe, A. M., Gawiser, E., & Prochaska, J. X. 2005, ARA&A, 43, 861
- Wolfe & Prochaska (1998) Wolfe, A. M. & Prochaska, J. X. 1998, ApJ, 494, L15
- Woosley (2011) Woosley, S. E. 2011, arXiv:1105.4193
- Zafar et al. (2011) Zafar, T., Watson, D., Fynbo, J. P. U., et al. 2011, A&A, 532, A143
- Zhang & Mészáros (2004) Zhang, B. & Mészáros, P. 2004, International Journal of Modern Physics A, 19, 2385
Appendix A Additional figures