EARLY SCIENCE WITH KOREAN VLBI NETWORK: THE QCAL-1 43 GHz CALIBRATOR SURVEY
Abstract
This paper presents the catalog of correlated flux densities in three ranges of baseline projection lengths of 637 sources from a 43 GHz (-band) survey observed with the Korean VLBI Network. Of them, 14 objects used as calibrators were previously observed, but 623 sources have not been observed before at band with very long baseline interferometry (VLBI). The goal of this work in the early science phase of the new VLBI array is twofold: to evaluate the performance of the new instrument that operates in a frequency range of 22–129 GHz and to build a list of objects that can be used as targets and as calibrators. We have observed the list of 799 target sources with declinations down to . Among them, 724 were observed before with VLBI at 22 GHz and had correlated flux densities greater than 200 mJy. The overall detection rate is 78%. The detection limit, defined as the minimum flux density for a source to be detected with 90% probability in a single observation, was in a range of 115–180 mJy depending on declination. However, some sources as weak as 70 mJy have been detected. Of 623 detected sources, 33 objects are detected for the first time in VLBI mode. We determined their coordinates with the median formal uncertainty 20 mas. The results of this work set the basis for future efforts to build the complete flux-limited sample of extragalactic sources at frequencies 22 GHz and higher at 3/4 of the celestial sphere.
Subject headings:
astrometry — galaxies: active — radio continuum: galaxies — surveys — technique interferometric1. Introduction
The Korean VLBI Network (KVN) is the first dedicated very long naseline interferometry (VLBI) network in East Asia in millimeter wavelengths. The KVN was built by Korea Astronomy and Space Science Institute (KASI) in order to achieve the following major goals: (1) to study the formation and death of stars with observing water (H2O), methanol (CH3OH), and silicon monoxide (SiO) masers at high resolutions, (2) to investigate the structure and dynamics of our own Galaxy by conducting highly accurate astrometric VLBI observations of the galactic radio sources, and (3) to study the nature of active galactic nuclei (AGNs) and their population at high frequencies. The KVN as a dedicated VLBI network also aims to study the spectral and temporal properties of transient sources such as bursting star-forming regions, intra-day variable compact radio sources, gamma-ray flaring AGNs, and other objects by conducting systematic multi-wavelength monitoring campaigns (Kim et al. 2004, Lee et al. 2011)
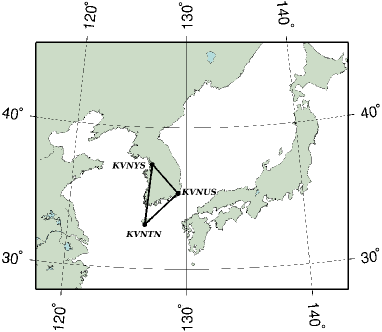
The KVN consists of three 21 m radio telescopes: in Seoul, KVN Yonsei Radio Telescope (KVNYS), in Ulsan, KVN Ulsan Radio Telescope (KVNUS); and in Jeju island, Korea, KVN Tamna Radio Telescope (KVNTN). The baseline lengths are in a range of 305–476 km (see Figure1). All antennas have an identical design. The aggregate root mean square (rms) deviation of the antenna surface from a paraboloid is 0.12 mm, which allows us to observe at frequencies up to 150 GHz. The antennas are equipped with the quasi-optic system that allows simultaneous observations at 22, 43, 86, and 129 GHz. This system is described in detail in Han et al. (2008).
By 2011, the 22 and 43 GHz receivers were installed and carefully tested. The dual beams at two frequencies are well aligned within . The pointing errors are less than in azimuth and elevation. The measured aperture efficiencies are greater than 64% at 22 GHz and greater than 62% at 43 GHz. More detailed results of performance tests of the antenna and receivers in the single-dish mode are presented in Lee et al. (2011). Receivers at 86 and 129 GHz will be tested in 2012.
The signals digitized by the samplers in the receiver room are processed by the KVN Data Acquisition System (DAS) to get spectra for single-dish spectroscopy observations. In VLBI operation, the digitized signals processed in the DAS are recorded onto disks using Mark-5B. In 2011 the aggregate recording rate was limited by 1024 Mbps that can be used either entirely for one band or split between bands.
The KASI has all hardware and software to support the full cycle of VLBI observations either as a three-element interferometer or as a part of a larger VLBI network: scheduling, antenna control system, data recording, correlation, post-correlation data processing, astrometry, geodesy, and imaging analysis.First fringes between KVN stations at 22 GHz in a recording rate of 1 Gbps were obtained on 2010 June 8. Test observations on 2010 September 30 confirmed that the VLBI system works according to specifications. Detailed analysis of system performance will be given in S. Lee et al. (2013 in preparation).
These first tests allowed us to start an early science program including multi-frequency phase referencing observations. The feasibility of the multi-frequency phase referencing observations strongly depends on the information about phase calibrators such as their structures, flux densities, global distribution, etc (Jung et al. 2011). Therefore it is necessary to establish a catalog of radio compact sources at high frequency bands with large VLBI surveys. This determined our choice for the first early science project for VLBI observations in continuum mode.
In this paper we present results of the 43 GHz VLBI survey conducted at the three-element KVN radio interferometer. We describe the strategy for source selection, observations, data analysis and present the catalog of correlated flux densities. Finally, we summarize main findings and make conclusions about performance of the KVN for AGNs studies.
2. The QCAL-1 survey: goals and source selection
Although the accumulative radio fundamental catalog111Available at http://astrogeo.org/rfc (L. Petrov & Y. Kovalev 2013, in preparation) that includes all the sources observed with VLBI in a survey mode by 2012 August has 7216 objects, the majority of them were observed at frequencies 8 GHz and lower. This catalog is based on Very Long Baseline Array (VLBA) Calibrator Survey (Beasley et al. 2002, Fomalont et al. 2003, Petrov et al. 2005, 2006, Kovalev et al. 2007, Petrov et al. 2007b) and other large surveys. There were only several VLBI surveys at frequencies higher than 24 GHz. Lanyi et al. (2010) observed 132 sources at -band in 2002–2003, Marscher et al. (2012) run an ongoing project of monitoring 34 AGNs since 2007, and Jacobs & Sovers (2009) started to work on the catalog of objects at 32 GHz that will become available in the future. Considering that 13 sources overlap in both projects, the total number of sources with known -band flux densities at milliarcsecond scales with their brightness distributions publicly available is 153. This count does not include individual sources that were observed as targets under other programs. All these sources have the correlated flux density at baselines longer than 900 km, which corresponds to 130 mega wavelengths, greater than 200 mJy.
We would like to increase this list for two reasons. First, we need to have a set of sources suitable as calibrators for high frequencies with KVN and VERA (VLBI Exploration of Radio Astrometry). Observations with quick switching between a weak target and a bright calibrator allow to extend the coherence time from several minutes to hours, provided a calibrator located within several degrees from a target can be detected. Second, construction of a flux-limited sample of sources at high frequencies provides an opportunity to study the population of AGNs. At frequency 43 GHz and higher the radio emission at parsec scales is dominated by the core. VLBI observations of a large flux-limited sample allow to derive a number of interesting statistics. In particular, using such a sample we can
-
•
investigate compactness determined as a ratio of the correlated flux density at short and long baselines to the single-dish flux density and compare it with compactness at 2.2, 8.4 GHz, and 22 GHz.
-
•
measure the brightness temperature for the core and jet components in order to populate a model of the distribution of the observed core brightness temperature in terms of the intrinsic properties of relativistic jets such as the brightness temperature, bulk motion, viewing angle. The data will also provide the unbiased sample needed to investigate the unified scheme between quasars, BL Lacs objects, and galaxies.
-
•
analyze the relationship between the core optical depth as measured by the spectral index and other properties of the jet emission and optical properties.
-
•
investigate the variation of the spectral index along the presumably optically thin jets and comparison with the conditions in small-scale and larger-scale jets.
To commence building a large sample of compact sources at 43 GHz, we analyzed prior VLBI surveys at 22–24 GHz: the / VLBA survey (Lanyi et al. 2010), the VERA 22 GHz fringe search survey (Petrov et al. 2007a), the VLBA Galactic Plane Survey (Petrov et al. 2011), the EVN Galactic Plane Survey (Petrov 2012), and the VERA -band Calibrator Survey (Petrov at al. 2012). We selected 878 sources in these surveys that have correlated flux densities at scales less than 10 mas exceeding 200 mJy. After subtracting 153 sources that have already been observed in -band surveys, we got the list of 725 target sources. We added to this list two samples of the sources that were not previously observed with VLBI which we could reasonably expect to be bright enough for being detected at -band with the KVN. These additional sources included 49 objects from the CGRaBS catalog (Healey et al. 2008), many of them are part of the OVRO 40 m telescope monitoring program at 15 GHz (Richards et al. 2011) (other 1576 objects have already been observed with VLBI) and 26 sources from the AT20G catalog (Murphy et al. 2010) with spectral index () greater than that have the flux density extrapolated to 43 GHz greater than 200 mJy. In total, the list of targets included 799 objects.
2.1. Observations
We observed target sources in three observing sessions in December 18, 19, and 22, 2011. The first two sessions had durations 28 and 27 hr respectively. In the 50 minutes long third session we observed the sources missed in the first two sessions. Each source was scheduled in one scan, 90 s long, in the first observing session and in one scan in the second observing session. The algorithm for automatic scheduling implemented in software sur_sked222http://astrogeo.org/sur_sked selected the sources in a sequence that minimizes slewing.
In addition to target sources, every half an hour a source from the list of 34 blazars that are regularly monitored by the Boston group (Jorstad et al. 2005, Marscher et al. 2012) was inserted. The scheduling algorithm has picked up 14 blazars. These bright sources were used for bandpass calibration and for evaluation of station-dependent gain corrections.
Every hour a tipping curve was measured: each antenna recorded system temperature at eight different elevations. These measurements allow us to monitor changes in the opacity of the atmosphere.
The left circular polarization data were recorded using Mark-5B units with 2 bit sampling within 496 MHz wide band in a range of 42.850–43.346 GHz in 16 intermediate sub-bands of 16 MHz wide, equally spaced with a step of 16 MHz using a digital filter. The aggregate recording rate was 1024 Mbps.
3. Data analysis
The data were correlated with DiFX-2 correlator (Deller et al. 2011) with spectral resolution of 0.125 MHz and accumulation periods of 1 s long. The scheme of post-correlator data analysis was similar to the analysis of KCAL VERA calibrator survey at 22 GHz (Petrov at al. 2012). First, for each observation we found such phase delay rates, group delays, and group delay rates that after coherent averaging of complex cross-correlation samples rotated according to these parameters the fringe amplitude of the sum reached the maxima. We used analysis software 333 http://astrogeo.org/pima for performing this task. A dataset that originates from processing data of one scan at one baseline we call an observation.
Analyzing the distribution of achieved signal-to-noise ratios (S/Ns), we found the probability of false detection for observations with no signal, but only noise is less than 0.01 when the S/N is greater than 5.4. We used this value of the S/N as a threshold for a preliminary screening of detected and not detected observations.
Then total group delays and delay rates as well as some auxiliary information was written into a database for further processing with VTD/post-Solve software444 http://astrogeo.org/vtd for analysis of absolute astrometry and geodesy observations. We solved for coordinates of new sources, baseline lengths, clock function and residual atmosphere path delay in zenith direction modeled with a linear B-spline with spans of 1 hr for every station. This was done for two purposes. First, we were able to adjust positions of new sources and improve a priori baseline lengths. Second, considering that for a majority of sources their positions are known at a milliarcsecond level, we can make an additional test whether a given source was detected. The group delay search window was 8 s. If a source is not detected, its estimate of group delay will be uniformly distributed in a range of s. The distribution of post-fit residuals of detected sources has the weighted root mean squares (wrms) 55–80 ps. That is why a non-detected source will show up as an outlier. The probability that a non-detected source which position is not adjusted will accidentally have the post-fit residual greater than 5 times wrms, i.e., ns, and therefore, will not be marked as an outlier, is .
After additional screening for non-detections by analyzing residuals of parameter estimation and elimination of observations with residuals exceeding five times their wrms we performed the amplitude calibration. Previous measurements of antenna gains showed that they vary with elevation within 5%–8%. Table 1 provides parameters of gains used in our analysis.
| Station | DPFU | |||
|---|---|---|---|---|
| KVNTN | 0.0747 | 0.979990 | ||
| KVNUS | 0.0714 | 0.974197 | ||
| KVNYS | 0.0850 | 0.923354 |
Analysis of system temperature measurements revealed small variations with time and with elevation angle. The measured system temperature is considered as a sum of three terms: the receiver temperature , the spillover temperature , and the contribution of the atmosphere:
| (1) |
where is the average temperature of the atmosphere; is the atmosphere opacity; is the spillover efficiency, which includes rear spillover, scattering, blockage, and ohmic loss efficiency; and is the wet mapping function: the ratio of the non-hydrostatic constituent of the path delay in the neutral atmosphere at the elevation to that path delay in the zenith direction. Since the observations were made at different elevation angles down to , decomposition of system temperature according to expression 1 can be easily done using non-linear least squares. Sky tipping curve analysis procedure of the KVN follows the way described in Mangum (2000), Section 6.5.1. We used NMFw wet mapping function Niell (1996) in our work. Estimates of the opacity, spillover efficiency, and receiver temperature from system temperature measured during observations were within 5%–10% from results derived from tipping curves. Variations of both receiver temperature and opacity varied within 10% over four days. Table 2 shows average receiver temperature, opacity, and system equivalent flux density (SEFD) in zenith direction during observations. Using estimates of opacity, we reduced our system temperature to the top of the atmosphere and calibrated fringed amplitudes by multiplying them by a factor , where is the a priori gain.
Since each target source was scheduled in two scans of a three-element interferometer, the self-calibration method for imaging will not work because too few data are available. We computed predicted correlated flux densities for every observation of 14 amplitude calibrator sources using their brightness distributions in the form of CLEAN components from VLBA observations under the Boston blazar monitoring program. We processed images for epoch 2011 December 02 or 2012 January 27, i.e., within one month from our observations. Using these predicted correlated flux densities, and comparing them with the calibrated fringe amplitudes from our observations, we estimated average multiplicative gain factors using least squares. These factors were considered constant over each individual observing session. Detailed discussion of this method and approaches for evaluation of errors associated with this method are given in Petrov at al. (2012). Using the same technique, we found the calibration errors of the QCAL-1 survey were within 15%.
| Station | (K) | SEFD (Jy) | Gaincorr | ||
|---|---|---|---|---|---|
| KVNTN | 89 | 0.945 | 0.081 | 2080 | 1.10 |
| KVNUS | 51 | 0.925 | 0.082 | 1460 | 1.06 |
| KVNYS | 103 | 0.945 | 0.103 | 2810 | 1.31 |
4. QCAL-1 Catalog
| Source names | Stat. | Corr. flux density | Errors of | Source coordinates | |||||||
|---|---|---|---|---|---|---|---|---|---|---|---|
| (1) | (2) | (3) | (4) | (5) | (6) | (7) | (8) | (9) | (10) | (11) | (12) |
| IAU name | IVS name | flag | #Det | Right ascen | Declination | ||||||
| Jy | Jy | Jy | Jy | Jy | Jy | h m s | |||||
| J00134051 | 0010405 | 6 | -1.000 | -1.000 | 0.612 | -1.000 | -1.000 | 0.018 | 00 13 31.1302 | 40 51 37.144 | |
| J00130423 | 0011046 | 3 | -1.000 | -1.000 | 0.087 | -1.000 | -1.000 | 0.014 | 00 13 54.1309 | 04 23 52.294 | |
| J00146117 | 0012610 | 6 | -1.000 | -1.000 | 0.281 | -1.000 | -1.000 | 0.016 | 00 14 48.7921 | 61 17 43.542 | |
| J00178135 | 0014813 | 7 | -1.000 | 0.257 | 0.254 | -1.000 | 0.016 | 0.020 | 00 17 08.4749 | 81 35 08.136 | |
| J00220608 | 0019058 | 6 | -1.000 | 0.449 | 0.448 | -1.000 | 0.016 | 0.017 | 00 22 32.4412 | 06 08 04.268 | |
| J00275958 | 0024597 | 6 | -1.000 | -1.000 | 0.189 | -1.000 | -1.000 | 0.016 | 00 27 03.2862 | 59 58 52.959 | |
| J00290554 | 0027056 | 6 | -1.000 | 0.295 | 0.261 | -1.000 | 0.015 | 0.015 | 00 29 45.8963 | 05 54 40.712 | |
| J00381856 | 0035186 | N | 6 | -1.000 | 0.099 | 0.086 | -1.000 | 0.014 | 0.015 | 00 38 28.8915 | 18 56 17.641 |
Among 813 observed sources, 799 targets and 14 calibrators, 637 sources were detected in three or more observations, 27 objects were detected in two observations, 20 objects were detected in only one observation, and 129 objects were not detected at all. If a source had a residual by modulo greater than 0.4 ns in the astrometry solution, we counted that observation as a non-detection, regadrless of its S/N. We consider a source reliably detected if it was detected in three or more observations. Since the probability of false detection of an individual observation is 0.01, and considering such events are independent, the probability that all three detections with S/N are spurious is . The probability that falsely detected observations have residuals less than 0.4 ns for all three observations is if to regard these cases as statistically independent and if to regard them as totally dependent.
For each 637 detected sources we computed the median correlated flux density in three ranges of baseline projection lengths: [0, 21], [21, 42], and [42, 68] megawavelengths, which corresponds to the ranges of 150, 300, and 477 km. The first 8 rows of the catalog are presented in Table 3.
Errors in estimates of correlated flux density are determined by two factors: errors in calibration and unaccounted source structure. Since the majority of sources are barely resolved at 43 GHz with angular resolution 5 mas that we had in our observations, the first factor dominates. As a test, we analyzed the first and the second observing session separately. Comparison of flux density estimates from independent experiments showed us that they are consistent within 5%–10%. This indicates that our estimate of the calibration uncertainty 15% is close rather to an upper limit of actual errors than the low limit. However, due to scarceness of redundant observations we have to refrain from attempts to derive more robust statistics of flux density measurements.
In our astrometric solution that used all three observing sessions the following parameters were estimated with least squares: positions of 33 new sources, baseline lengths, and the nuisance parameters, such as clock function and residual atmosphere path delay in zenith direction. We kept positions of remaining 604 sources fixed to their values from the recent update of the Radio Fundamental Catalog that used all available VLBI observations under geodesy and absolute astrometry programs since 1980 April through 2012 June. Positions of these 604 sources defined the orientation of the new catalog of 33 sources.
| Source Names | J2000 Coordinates | Errors (mas) | Stat | |||||
| IAU | IVS | Right ascension | Declination | Corr | # Obs | # Exp | ||
| (1) | (2) | (3) | (4) | (5) | (6) | (7) | (8) | (9) |
| J00381856 | 0035186 | 00 38 28.8915 | 18 56 17.641 | 20.0 | 13.0 | 0.479 | 6 | 2 |
| J02023943 | 0159394 | 02 02 01.6563 | 39 43 21.556 | 11.0 | 5.8 | 0.235 | 6 | 2 |
| J02044005 | 0201398 | 02 04 05.1941 | 40 05 03.514 | 20.0 | 12.0 | 0.376 | 6 | 2 |
| J02422653 | 0239266 | 02 42 20.8303 | 26 53 37.722 | 30.0 | 17.0 | 0.092 | 4 | 2 |
| J02517226 | 0246722 | 02 51 37.3545 | 72 26 55.847 | 50.0 | 14.0 | 0.287 | 6 | 2 |
| J02513734 | 0248373 | 02 51 59.1686 | 37 34 18.177 | 33.0 | 23.0 | 0.097 | 4 | 2 |
| J04521236 | 0449125 | 04 52 42.6001 | 12 36 24.586 | 24.0 | 18.0 | 0.565 | 5 | 2 |
| J05022057 | 0500210 | 05 02 10.4053 | 20 57 16.590 | 30.0 | 31.0 | 0.615 | 3 | 1 |
The first 8 entries of the catalog are presented in Table 4. The semi-major axes of the error ellipse from formal uncertainties of source positions are in a range from 8 to 45 mas with the median value of 20 mas. In 2012 March and April, six sources from Table 4 were observed in one scan at 7.9–8.9 GHz with VLBA as fillers under ongoing astrometry project for observations of a complete sample of Two Micron All Sky Survey galaxies (Condon et al. 2011). Uncertainties of source position determined from these observations were in a range of 0.3–3 mas, more than one order of magnitude smaller than in QCAL-1 observations. The average arc length between VLBA and KVN positions is 26 mas, which is consistent with their formal uncertainties.
5. Discussion
Comparing the correlated flux densities and the S/Ns, we can determine for each observations with S/N 10 the minimal correlated flux density that corresponds to the S/N cutoff equal to 5.4. We built the cumulative distribution of the correlated flux densities that correspond to this cutoff and analyzed them. Sources with low declinations, and we observed sources with declinations as low as , are observed inevitably at low elevations through a thick layer of the atmosphere. This certainly affects our ability to detect a source. Table 5 shows the minimal correlated flux density for a source to be detected over 90 s integration time with a given probability derived from analysis of the cumulative distribution.
| Decl. Range | 50% | 70% | 90% | 95% |
|---|---|---|---|---|
| , | 75 | 90 | 115 | 130 |
| , | 105 | 115 | 130 | 140 |
| , | 140 | 160 | 180 | 190 |
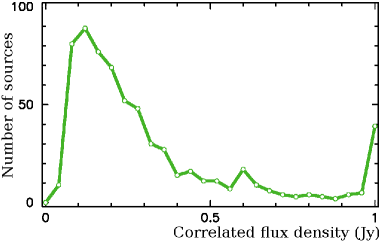
The distribution of correlated flux densities from QCAL-1 observations shows a growth of the number of detected sources with decreasing their flux densities until it drops at around 110 mJy (Figure 2). The flux density where the drop begins agrees well with our estimate of the detection limit presented in Table 5.
The distribution does not include other sources from / and Boston monitoring surveys. At present, we are not in a position to present evidence that the cumulative list of 776 objects from these two surveys and from QCAL-1 is complete at a certain flux density level. More observations and meticulous completeness analysis of the parent source list are needed in order to draw a conclusion about completeness of the -band sample. At present, we can firmly say that at least 534 sources have correlated flux densities greater than 200 mJy at projection baseline length of 40 mega wavelengths and 381 objects have correlated flux densities greater than 300 mJy at 3/4 of the celestial sphere with declination -30 .
We can make a coarse estimate of the number of sources with the flux density at -band greater than 100 mJy. We computed the ratios of -band correlated flux density to -band correlated flux density. For 73% sources the ratio exceeds 0.5 and for 22% exceeds 1.0. The dependence of the number of sources at on the -band correlated flux density for Jy is approximated by , where is in Jansky. Extrapolating this dependence to flux densities 0.2 and 0.1 Jy, we get the expected number of sources: 1426 and 3460, respectively. Considering that 73% sources with -band correlated flux density Jy and 22% sources with -band correlated flux density in a range of Jy can be detected at -band with the KVN, we get a total expected number to detections: objects.
We selected integration time 90 s for target sources. However, visual inspection of variations of fringe amplitudes with time for strong sources did not show a sign of decorrelation due to either the atmosphere or the frequency standards. We re-ran fringe fitting by dropping cross-correlation samples after 45 and after 60 s since the scan nominal start. If decorrelation due to phase fluctuations caused by the atmosphere path delay or by the frequency standards is negligible, the S/N ratio grows with an increase of averaging time as a square root of time. Deviation from this dependence in a form of provides us a measure of decorrelation . We found that the average decorrelation factor is 0.99 when the coherence time is increased from 45 to 60 s and 0.98 when the coherence time is increased from 60 to 90 s. This indicates that the coherence time during QCAL-1 survey was significantly longer than 90 s.
Considering that (1) 100% of scheduled observations were observed, correlated, and fringe fit; (2) no noticeable decorrelation due to either frequency standard or atmosphere was found; (3) system temperature was measured for every scan with no abnormalities; (4) receiver temperature showed variations within 10%; (5) the median detection limit was 110 mJy; (6) positions of new sources were determined with median accuracies 20 mas, we regard the early science KVN observations for QCAL-1 project as fully successful.
6. Summary
The major result is the catalog of flux densities of 637 compact sources at 43 GHz. Their errors do not exceed 15%. The number of sources detected in -band surveys grew by a factor of five and reached 776 objects. Integration time 90 s allowed us to detect a 115 mJy source at declination with the probability 90% in the winter season. We found that our observations were not limited by coherency time of either the atmosphere or the frequency standards. We may tentatively suggest that the coherence time could be increased to 180 s. We can conclude that the KVN is able to reliably detect at -band sources with correlated flux densities greater than 100 mJy, at least in winter time. More observations are needed in order to judge whether the coherence time during QCAL-1 campaign was representative.
We observed sources at elevations as low as and with declinations as low as . The detection limit for sources with declinations below was a factor of 1.5–2 worse that for sources with declinations greater than .
We determined coordinates of 33 new sources that have not been observed before with VLBI. The median formal position uncertainty from two scans is 20 mas. Comparison of these positions with positions of six sources derived from analysis of VLBA observations at 8 GHz in 2012 confirmed that the formal uncertainties are realistic. Observing sources in 12–15 scans which requires approximately 30 minutes per source will bring position uncertainty down to 5–10 mas.
The 56 hr long observing campaign is not sufficient to reach completeness of the AGN population at a certain flux density level. New campaign QCAL-2 is planned to achieve this goal. The on-going KVN -band calibrator survey (J. A. Lee et al. 2013, in preparation) is expected to increase the density of calibrators at 22 GHz for phase referencing observations and it will be used as a pool of targets for QCAL-2.
These early science results met or exceeded our expectations of KVN performance for AGN studies. We conclude that the number of AGNs that the KVN is able to detect at -band using 1024 Mbps recording rate is well over one thousand. These sources can also be used as phase calibrators for observing much weaker targets. With the use of QCAL-1 results, the probability to find a calibrator for KVN observations within of any target is 30%. Future more deep surveys promise to increase significantly this probability and therefore, boost our ability to detect interesting targets at high frequencies.
7. Acknowledgments
We are grateful to all staffs and researchers of KVN who helped to develop and evaluate the KVN systems. This work was supported by global research collaboration and networking program of Korea Research Council of Fundamental Science & Technology (KRCF) and also partially supported by KASI-Yonsei Joint Research Program (2010–2011) for the Frontiers of Astronomy and Space Science funded by the Korea Astronomy and Space Science Institute.
This study critically depends on 43 GHz VLBA data from the Boston University gamma-ray blazar monitoring program555See http://www.bu.edu/blazars/VLBAproject.html (Marscher et al. 2012) funded by NASA through the Fermi Guest Investigator Program. We thank Alan Marscher and Svetlana Jorstad for making results of their analysis in the form of brightness distributions publicly available on-line prior publication. The Very Long Baseline Array is an instrument of the National Radio Astronomy Observatory (NRAO). NRAO is a facility of the National Science Foundation, operated by Associated Universities Inc.
Facilities: Korean VLBI Network
References
- Beasley et al. (2002) Beasley, A. J., Gordon, D., Peck, A. B., et al. 2002, ApJS, 141, 13
- Condon et al. (2011) Condon, J., Darling, J., Kovalev, Y. Y., & Petrov, L. 2011, arXiv:1110.6252
- Deller et al. (2011) Deller, A., Brisken, W. F., Phillips, C. J., et al. 2011, PASP, 123, 275
- Fomalont et al. (2003) Fomalont, E., Petrov, L., McMillan, D. S., Gordon, D., Ma, C. 2003, AJ, 126, 2562
- Han et al. (2008) Han, S.-T., Lee, J.-W., Kang, J., et al. 2008, Int. J. Infrared Milli. Waves, 29, 69
- Healey et al. (2008) Healey, S. E., Romani, R. W., Cotter, G., et al. 2008, ApJS, 175, 97
- Jacobs & Sovers (2009) Jacobs, C. S., & Sovers, O. J., 2009, in Proc. 19th European VLBI for Geodesy and Astrometry Working Meeting, Bordeaux, France, 9 http://adsabs.harvard.edu/abs/2009evga.conf....9J
- Jorstad et al. (2005) Jorstad S. G., Marscher, A. P., Lister, M. L., et al. 2005, AJ, 130, 1418
- Jung et al. (2011) Jung, T., Sohn, B. W., Kobayashi, H., et al. 2011, PASJ, 63, 375
- Kim et al. (2004) Kim, H.-G., Han, S.-T., Sohn, B. W., et al. 2004, in Proc. of the 7th EVN Symp., ed. R. Bachiller, F. Colomer, J. J. Desmurs, & P. de Vicente, Toledo:OAN, 281
- Kovalev et al. (2007) Kovalev, Y. Y., Petrov, L., Fomalont, E., & Gordon, D. 2007, AJ, 133, 1236
- Lanyi et al. (2010) Lanyi, G. E., Boboltz, D. A., Charlot, P., et al. 2010, AJ, 139, 1695
- Lee et al. (2011) Lee, S., Byun, D., Oh, C. S., et al. 2011, PASP, 123, 1398
- Mangum (2000) Mangum J. G. 2000, Users’s Manual for the NRAO 12 m Millimiter-wave Telescope Kitt Peack, Arizona (NRAO; Tucson, Arizona), http://aro.as.arizona.edu/12m_docs/12m_userman.pdf
- Marscher et al. (2012) Marscher, A. P., Jorstad, S. G., Agudo, I., MacDonald, N. R., & Scott, T. L., 2012, preprint arhiv.org/abs/1204.6707
- Murphy et al. (2010) Murphy, T., Sadler, E. M., Ekers, R. D., et al. 2010, MNRAS, 420, 2403
- Niell (1996) Niell, A. E, 1996, J. Geophys. Res, 100, 3227
- Petrov et al. (2005) Petrov, L., Kovalev, Y. Y., Fomalont, E., & Gordon, D. 2005, AJ, 129, 1163
- Petrov et al. (2006) Petrov, L., Kovalev, Y. Y., Fomalont, E., & Gordon, D. 2006, AJ, 131, 1872
- Petrov et al. (2007a) Petrov, L., Hirota, T., Honma, M., et al. 2007a, AJ, 133, 2487
- Petrov et al. (2007b) Petrov, L., Kovalev, Y. Y., Fomalont, E., Gordon, D. 2007b, AJ, 136, 580
- Petrov et al. (2011) Petrov, L., Kovalev, Y. Y., Fomalont, E., Gordon, D. 2011, AJ, 142, 35
- Petrov (2012) Petrov, L., 2012, MNRAS, 416, 1097
- Petrov at al. (2012) Petrov, L., Honma, M., Shibata, S. M. 2012, AJ, 143, 35
- Richards et al. (2011) Richards, J. L., Max-Moerbeck, W., Pavlidou, V., et al. 2011, ApJS, 194, 29