The star cluster formation history of the LMC
Abstract
The Large Magellanic Cloud is one of the nearest galaxies to us and is one of only few galaxies where the star formation history can be determined from studying resolved stellar populations. We have compiled a new catalogue of ages, luminosities and masses of LMC star clusters and used it to determine the age distribution and dissolution rate of LMC star clusters. We find that the frequency of massive clusters with masses M⊙ is almost constant between 10 and 200 Myr, showing that the influence of residual gas expulsion is limited to the first 10 Myr of cluster evolution or clusters less massive than 5000 M⊙. Comparing the cluster frequency in that interval with the absolute star formation rate, we find that about 15% of all stars in the LMC were formed in long-lived star clusters that survive for more than 10 Myr. We also find that the mass function of LMC clusters younger than Gyr can be fitted by a power-law mass function with slope , while older clusters follow a significantly shallower slope and interpret this is a sign of either incompleteness or the ongoing dissolution of low-mass clusters. Our data shows that for ages older than 200 Myr, about 90% of all clusters are lost per dex of lifetime. The implied cluster dissolution rate is significantly faster than that based on analytic estimates and -body simulations. Our cluster age data finally shows evidence for a burst in cluster formation about yrs ago, but little evidence for bursts at other ages.
keywords:
galaxies: star clusters: general — Magellanic Clouds — galaxies: kinematics and dynamics1 Introduction
Open clusters are important test beds for star formation and stellar evolution theories since they provide statistically significant samples of stars of known distance, age and metallicity. Especially useful are star clusters in Local Group galaxies, which are close enough so that they can be resolved into individual stars and therefore allow their age and mass to be determined more accurately than based on integrated photometry as is done for more distant clusters.
The Large Magellanic Cloud (LMC) is one of the nearest galaxies to the Milky Way and contains several thousand star clusters (Bica et al., 2008) with ages ranging from a few Myr to a Hubble time. The large cluster system together with its proximity and the low extinction due to the low inclination of the LMC disc make the LMC cluster system an ideal test case to study the relation between star formation and cluster formation and the dissolution of star clusters.
Two main epochs of cluster formation have been found in the LMC, separated by an age gap of several Gyr (Bertelli et al., 1992; Girardi et al., 1995; Olszewski et al., 1996). The first star formation episode led to the formation of globular clusters and ended about 10 Gyr ago, while the second epoch started about 4 Gyr ago and is still ongoing. Within the last few Gyrs, several short peaks of star formation have been found (e.g. Harris & Zaritsky, 2009), which might have been triggered by close encounters between the Large and Small Magellanic Cloud or between the LMC and the Milky Way (Pietrzynski & Udalski, 2000; Chiosi et al., 2006). Similar peaks have also been found in the cluster formation rate and at least during the last Gyr, peaks in star cluster formation correspond to similar peaks that are seen in the field star formation rate (Maschberger & Kroupa, 2011).
The mass function of star clusters in the LMC is generally found to follow a power-law , although the value of the power-law exponent varies considerably between different authors. Chandar, Fall & Whitmore (2010) found that the mass function of LMC clusters more massive than M⊙ can be fitted with a power-law slope without any evidence for a change of this value with cluster age up to yrs. de Grijs & Anders (2006) found that cluster older than 100 Myr can be fitted by a power-law mass function with slope , while younger clusters follow significantly flatter mass functions. A slope between 2 and 2.4 was also found by Hunter et al. (2003) for clusters more massive than a few times M⊙ at Gyr and a few times M⊙ at Myr in the combined cluster sample of the LMC and SMC. On the other hand, from their reanalysis of the Hunter et al. cluster sample, Popescu et al. (2012) found a relatively small value of only to 1.6 as the average slope for all clusters that are more massive than M⊙ and less than a few Gyr old.
Star clusters are prone to a number of dissolution mechanisms, including two-body relaxation and an external tidal field (Vesperini & Heggie, 1997; Baumgardt & Makino, 2003), disc and bulge shocking (Ostriker et al., 1972; Gnedin & Ostriker, 1997) and encounters with giant molecular clouds (Spitzer, 1958; Wielen, 1985; Gieles et al., 2006a). Boutloukos & Lamers (2002) found evidence for ongoing dissolution of star clusters in the LMC with a characteristic lifetime of log(/yr)= for a M⊙ cluster, significantly longer than the corresponding value found by Lamers et al. (2005) for a sample of nearby galaxies. The long characteristic timescale implies that the high mass end of the cluster mass function in the LMC has stayed virtually unchanged since the time of its formation. Using the same data but a more careful treatment of the incompleteness limit, Parmentier & de Grijs (2008) showed that the cluster disruption time scale is actually highly uncertain and only a lower limit of Gyr can be given, since clusters at the low-mass end fall below the completeness limit of Hunter et al. (2003) before they are destroyed.
Apart from the absolute time scale of cluster dissolution, another important question is whether the timescale for cluster dissolution depends on the cluster mass. Using the cluster sample of Hunter et al. (2003) and based on the observed relation between the mass of the most massive cluster and the sampled age range, Gieles & Bastian (2008) found evidence for mass dependent cluster dissolution for ages larger than yrs, but mass independent dissolution for smaller ages. Chandar, Fall & Whitmore (2010) on the other hand found no evidence for mass dependent cluster dissolution up to yrs when looking at the evolution of the mass function of LMC and SMC star clusters.
Most of the above papers are based on data from the cluster catalogue of Hunter et al. (2003), who determined properties of 939 clusters in the SMC and LMC based on ground-based CCD photometry. Recently a wealth of new data has been obtained for LMC star clusters by Glatt, Grebel & Koch (2010) and Popescu, Hanson & Elmegreen (2012). Glatt et al. have presented ages and luminosities of almost 1200 star clusters in the LMC using data from the Magellanic Cloud Photometric Surveys (Zaritsky et al., 2002, 2004, MCPS). In addition, Popescu et al. (2012) have presented new age and mass estimates based on integrated colors for the clusters of Hunter et al. (2003) taking into account random sampling of the IMF and stochastic effects due to bright stars.
In this paper, we present a new derivation of the mass and age distribution of LMC clusters and use it to study the relation between star and star cluster formation and different cluster dissolution models. Our paper is organised as follows: In Sec. 2 we present the observational data for LMC clusters and derive a combined catalogue of ages and masses for massive LMC clusters. We use this catalogue in Sec. 3 to calculate the age distribution and mass function of LMC clusters. In Sec. 4 we present a discussion of the various cluster dissolution mechanisms and compare predictions with the observational data in Sec. 5. Our conclusions are finally presented in Sec. 6.
2 Observational data
We use four recent compilations of LMC star cluster parameters to derive a combined catalogue for LMC clusters. Our first catalogue is the recent work of Glatt, Grebel & Koch (2010), who used data from the Magellanic Cloud Photometric Surveys together with isochrone fitting to derive ages and luminosities for 1193 populous star clusters in a 64 deg2 area of the LMC. The cluster identifications, sizes, and positions were taken from the catalogue of Bica et al. (2008). Since the MCPS becomes highly incomplete below , the Glatt et al. data become incomplete for ages larger than 500 Myr and do not contain any clusters older than Gyr. Glatt et al. also did not determine ages for clusters younger than about 10 Myr to avoid confusion between star clusters and unbound stellar associations.
The second data set that we use is the catalogue of Pietrzynski & Udalski (2000), who used BVI data from the OGLE II microlensing experiment (Udalski et al., 1998) together with isochrone fitting to derive ages of about 600 star clusters which are located in the central parts of the LMC and are younger than 1.2 Gyr. Since Pietrzynski & Udalski did not derive cluster luminosities or cluster masses, we could only use their data if luminosity information was available from another source. Our third catalogue is the cluster catalogue presented by Hunter et al. (2003). The Hunter et al. catalogue contains data for about 746 different LMC clusters, limited to the inner regions of the LMC and to absolute luminosities brighter than . New age determinations for the cluster in the Hunter et al. catalogue were presented by de Grijs & Anders (2006) from broad-band spectral energy distribution fitting of the integrated UBVR photometry given by Hunter et al. (2003) and recently also Popescu, Hanson & Elmegreen (2012). Popescu et al. use the stellar cluster analysis package MASSCLEANage to derive new ages and masses for the Hunter et al. cluster sample. The advantage of MASSCLEANage is that it allows to take into account stochastic fluctuations in cluster colors and magnitudes which arise from the finite number of stars present in clusters. We average the ages for clusters which appear multiple times in the Popescu et al. sample and are left with a list of 746 unique clusters which are almost identical to those analysed by de Grijs & Anders.
In order to increase the accuracy of the age and mass determinations especially for bright clusters, we also include age determinations from the literature. In particular, we use the ages recently derived by Milone et al. (2009) for massive intermediate-age star clusters from colour-magnitude fitting and the age data compiled by Mackey & Gilmore (2003) for 53 massive LMC clusters. Many of the ages in these papers are derived from HST data reaching several magnitudes below the turnover and are therefore significantly more accurate than the ages derived in the above surveys.

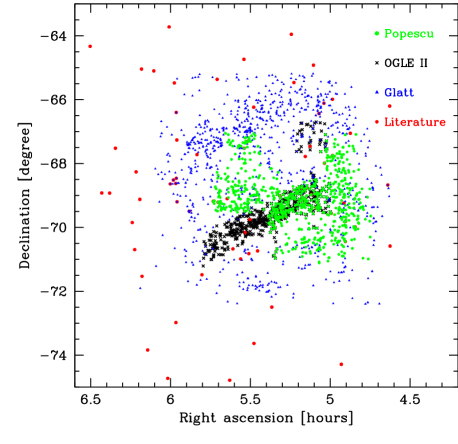
Fig. 1 depicts the positions of all clusters from the above catalogues. Since the list of clusters in de Grijs & Anders is nearly identical to that of Popescu et al., we do not show them separately. It can be seen that the Glatt et al. data covers most of the LMC, while de Grijs & Anders (2006), Popescu, Hanson & Elmegreen (2012) and Pietrzynski & Udalski (2000) catalogues are restricted to varying parts of the LMC. Since the LMC shows evidence for different regions having undergone different star formation histories (Glatt, Grebel & Koch, 2010), it is clear that only a combination of all catalogues can give a complete picture of the LMC cluster population.
| Data set 1 | Data set 2 | Pearson | Slope | Scatter | Data set 1 | Data set 2 | Pearson | Slope | Scatter | ||
|---|---|---|---|---|---|---|---|---|---|---|---|
| OGLE II | de Grijs&Anders | 198 | 0.75 | 0.28 | de Grijs&Anders | OGLE II | 198 | 0.75 | 0.28 | ||
| OGLE II | Glatt et al. | 29 | 0.44 | 0.26 | de Grijs&Anders | Glatt et al. | 294 | 0.46 | 0.33 | ||
| OGLE II | Popescu et al. | 191 | 0.54 | 0.37 | de Grijs&Anders | Popescu et al. | 745 | 0.68 | 0.62 | ||
| OGLE II | Literature val. | 11 | 0.96 | 0.13 | de Grijs&Anders | Literature val. | 18 | 0.91 | 0.27 | ||
| Glatt et al. | OGLE II | 29 | 0.44 | 0.26 | Popescu et al. | OGLE II | 191 | 0.54 | 0.37 | ||
| Glatt et al. | de Grijs&Anders | 294 | 0.46 | 0.33 | Popescu et al. | Glatt et al. | 293 | 0.77 | 0.20 | ||
| Glatt et al. | Popescu et al. | 293 | 0.77 | 0.20 | Popescu et al. | de Grijs&Anders | 745 | 0.68 | 0.62 | ||
| Glatt et al. | Literature val. | 18 | 0.70 | 0.30 | Popescu et al. | Literature val. | 18 | 0.07 | 0.82 |
Fig. 2 and Table 1 compare the ages of star clusters derived in the studies by Pietrzynski & Udalski, de Grijs & Anders, Glatt et al., and Popescu et al. with one another for the clusters common to the different studies. The de Grijs & Anders ages are in good agreement with the OGLE II ages but disagree significantly with the Glatt et al. and Popescu et al. ages, since clusters with yrs in de Grijs & Anders tend on average to be younger than found by the other authors, while clusters with yrs are on average older in de Grijs & Anders than in the other catalogues. As noted by Popescu et al., this difference could be due to the absence of single red giants or supergiants in young clusters, which make the cluster appear bluer and therefore younger. The Glatt et al. data shows fairly good agreement with Popescu et al. It is also in rough agreement with the OGLE II data, however the number of clusters in common is too small to make a meaningful comparison. The OGLE II ages have a small offset by about dex compared with the de Grijs & Anders ages, which might also be present in the comparison with the Popescu et al. data. As noted by de Grijs & Anders, this can be explained by the smaller LMC distance modulus of adopted by Pietrzynski & Udalski, compared to the value of used by most other authors. Placing the LMC at a smaller distance decreases the absolute luminosities of the stars and the turn-over region in the CMD, and therefore makes the clusters appear older. In order to correct for this bias, we increase the OGLE II ages by 0.2 dex.
From the comparison of the cluster ages shown in Fig. 2, we calculate Pearson coefficients and best-fitting linear relations and the standard deviation in about this best-fitting relation. The results are shown in Table 1, which also includes a comparison with the literature data. The relatively large discrepancy between the de Grijs & Anders data on the one hand and Glatt et al. and Popescu et al. on the other is again apparent. Since Glatt et al. use CMD fitting while Popescu et al. work with integrated colors, the difference cannot result from the method used and is more likely due to stochastic effects influencing the integrated colors. Given the Pearson coefficients, the ages from OGLE II seem to better agree with de Grijs & Anders ages than with either Glatt et al. or Popescu et al. However the slope of the best-fitting relation for OGLE II is in all cases compatible with unity. The literature sample has only few clusters in common with the other studies, so it is hard to make a meaningful comparison, but the Pearson coefficients as well as the slopes are mostly compatible with unity within the error bars, indicating good agreement. The final column of Table 1 shows that the RMS deviation in between the different catalogues is typically around 0.20 to 0.30, a value that also agrees with the age uncertainties of individual clusters (see Table 2).
To obtain a complete catalogue of LMC clusters, we combine the clusters from the above data sets, excluding duplicate entries through a coordinate based search with a search radius of 20”, which corresponds to a distance of 5 pc at an assumed LMC distance of 50 kpc. When assigning ages to the clusters, we give the highest priority to the ages given in Milone et al. (2009) and Mackey & Gilmore (2003), followed by Glatt et al. (2010), the OGLE II data, and finally Popescu et al. (2012). We ignore the de Grijs & Anders dataset due to its significant deviation against the Glatt et al. and Popescu et al. ages. Since we need cluster luminosities to calculate cluster masses and OGLE II has only age information, we include clusters from OGLE II only if information on the total cluster luminosity is available from Popescu et al. (2012).
Cluster masses are then derived from the luminosities by calculating values using the Padova isochrones for . These isochrones are based on the Marigo et al. (2008) stellar evolution tracks with corrections from case A in Girardi et al. (2010), assuming a Kroupa (1998) stellar mass function corrected for binaries. The resulting cluster masses show good agreement with the cluster masses calculated by Popescu et al. for the clusters which we take from their catalogue. As shown by Anders et al. (2009), cluster dissolution can affect the cluster ratios since low-mass stars are lost preferentially, however the resulting effect on the ratios is less than 50% until the cluster is close to dissolution.
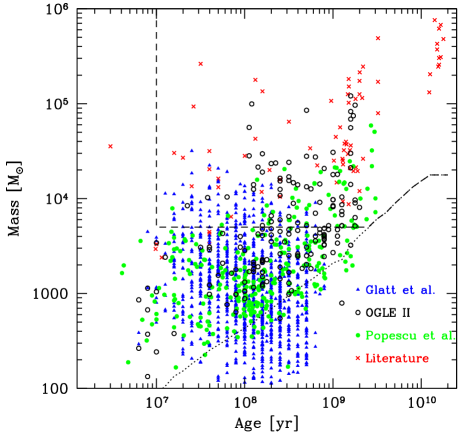
Fig. 3 depicts the location of all clusters from the combined data set in a mass vs. age diagram. The dotted line shows the 50% completeness limit of from Hunter et al. (2003). The majority of clusters have ages between to yrs and masses of a few hundred to a few thousand M⊙. The lack of clusters younger than yrs is due to the fact that such clusters are often obscured by dust clouds and are also easy to confuse with unbound associations and were therefore not analysed by Glatt et al. and OGLE II. The Glatt et al. and OGLE II samples also do not contain clusters older than yrs, since neither the OGLE nor the MCPS photometry is deep enough to permit age dating such clusters from resolved CMDs. This could in part explain the absence of clusters above yrs. In addition, the 50% completeness limit of the Hunter et al. sample reaches several thousand M⊙ for ages larger than . In order to work with a sample that is as complete as possible, we therefore restrict our analysis to clusters older than yrs and brighter than . For clusters of a few thousand stars, a single giant star can have a luminosity exceeding that of the rest of the cluster, leading to large fluctuations in the clusters’ ratio (Piskunov et al., 2011). This makes mass estimates based on cluster luminosity highly uncertain. We therefore also restrict our analysis to clusters more massive than 5000 M⊙. For clusters of this mass and ages larger than yrs, Fig. 11 in Piskunov et al. (2011) shows that stochastic effects due to bright giants change the ratio in the V band by less than 20% compared to a model with a continuous IMF. Comparable mass uncertainties are also found by Popescu et al. for clusters more massive than a few thousand solar masses. The resulting selection limit is shown in Fig. 3 by dashed lines. Out of a total number of 1649 unique clusters in the four data sets, 322 clusters pass our selection criteria. Their basic parameters (names, positions, total luminosities, ages, age uncertainties and masses) are listed in Table 2. Although containing only the brightest and most massive clusters in the LMC, none of the individual catalogues is complete within our age and mass ranges: Of the 322 clusters in our final sample, only 86 were listed in OGLE II, 85 in Glatt et al. and 194 in Popescu et al. In the following analysis, we restrict ourselves to the area of the LMC covered by Glatt et al., which is roughly located between 4.7 and 6.1 hours in right ascension and -65 and -72.5 degrees in declination. This region contains 294 clusters of our final sample and is identical to the region for which Harris & Zaritsky (2009) determined the field star formation rate, which we will compare to the cluster formation rate in the next section.
3 Results

Fig. 4 depicts the cluster frequency , defined as the number of clusters per time unit, as a function of age for clusters with present masses M⊙ and magnitudes brighter than . It can be seen that the observed frequency drops steadily as a function of age. The drop is relatively small during the first 100 Myr since the data point at T=150 Myr is only a factor of two lower than the one at the youngest age. The data show clear evidence for a peak in cluster frequency at yrs. Other peaks are more ambiguous, but could be present between 20 to 30 Myr and around 100 Myr. The peak at ages between 20 to 30 Myr, might however simply be due to cluster incompleteness at ages Myr. Also visible is the well-known absence of star clusters between 3 and 8 Gyr, where the cluster frequency is at least a factor of 10 lower than at older and younger ages.
In order to disentangle true variations in cluster frequency from star formation variations, we divide the cluster frequency by the total star formation rate in each age bin according to Harris & Zaritsky (2009) and show the result in the bottom panel of Fig. 4. As can be seen, the cluster to star ratio is now nearly constant for ages from 10 Myr to 200 Myr. Primordial gas expulsion does therefore either have only a moderate effect on star clusters or its observable effects must be limited to either the first 10 Myr of cluster evolution or low-mass clusters with M⊙ since no strong drop in cluster frequency is visible in the first 100 Myr. After 200 Myr, the frequency of clusters drops significantly, at Gyr it is roughly only 1/10th of that at Myr, and at Gyr it is lower by an additional factor of 10. We note that at Gyr, the 50% completeness limit of Hunter et al. (2003) is almost a factor of 4 more massive than our mass-cut at 5000 M⊙ (see Fig. 4). This, however, does not explain the low number of clusters at Gyr, since all of them are more massive than M⊙.
A nearly constant cluster frequency at young ages followed by a strong decrease at later ages was also found by Lamers et al. (2005) for the open clusters in the solar neighborhood. In the solar neighborhood the break occurs at around , equivalent to 400 Myr. It is also visible in the distribution of massive star clusters with M⊙ in the SMC resented by Chandar, Fall & Whitmore (2006) (see their Fig. 1). Boutloukos & Lamers (2003) showed that this behavior is due to cluster dissolution: For ages , where is a characteristic time related to the dissolution time, only a small number of low-mass clusters fall below the detection threshold, so the cluster frequency drops only slowly, while for ages significant dissolution of clusters causes a strong decrease in cluster frequency.
From Fig. 4, we can therefore conclude that a) if residual gas expulsion has an influence on star clusters, its effects must be limited to either the first 10 Myr of evolution or low-mass clusters with M⊙ b) the characteristic lifetime of a M⊙ star cluster (which make up the majority of our clusters in our sample) in the LMC is a few hundred Myr and roughly the same as in the solar neighborhood (Lamers et al., 2005); c) for ages Myr about 90% of clusters are destroyed per 1 dex in .
The data shown in Fig. 4 confirm the absence of star clusters in the LMC in the age range 4 Gyr Gyr, which was first noticed by Bertelli et al. (1992). A similar gap is not seen in the field star formation rate, as found by Harris & Zaritsky (2009) from an analysis of the MCPS data and Holtzman et al. (1999) from an analysis of HST color-magnitude diagrams of three fields in the LMC. If the star formation rate derived by Harris & Zaritsky (2009) is correct, then the ratio of the number of clusters formed to the absolute star formation rate was at least a factor 5 to 10 lower in this age range then at both earlier ages Gyr and later ages Gyr. Alternatively, only low-mass clusters with M⊙ may have been formed in this age range.
Fig. 5 finally depicts the mass distribution of clusters, split into four age groups. In most age bins, the mass function of clusters can be approximated well by a power-law mass function . Applying a maximum likelihood estimator to the cluster mass distribution as described in Clauset, Rohilla Shalizi & Newman (2009), gives as best-fitting slope for the youngest age bin. This is in good agreement with the slope found by Hunter et al. (2003) and only slightly steeper than the slope of found by Chandar, Fall & Whitmore (2010) for clusters more massive than M⊙. In our sample, clusters up to 1 Gyr can be fitted by a slope similar to that for clusters in the youngest age bin, confirming results by Chandar, Fall & Whitmore (2010) that the dissolution of clusters up to 1 Gyr is mass independent, at least for the mass range considered here. Clusters between 1 and 4 Gyr have a significantly flatter best-fitting slope of . This could be due to either incompleteness of the sample at the low-mass end or be a sign of ongoing cluster dissolution, since low-mass clusters are more easily destroyed by two-body relaxation than high-mass ones (Baumgardt & Makino, 2003). If the flattening were due to incompleteness and the true mass function still a power-law with slope , then about 400 clusters with masses between 5000 M⊙ and M⊙ would be missing from our sample. This seems highly unlikely, given the relatively faint 50% completeness limit of the Hunter et al. sample (about 5000 M⊙ at Gyr). We therefore conclude that the observed flattening of the mass function for clusters with ages Gyr is due to ongoing cluster dissolution. Interestingly, clusters with ages Gyr and masses larger than M⊙ can still be fitted with a slope , the slope flattens only for lower-mass clusters, which is also in agreement with ongoing dissolution of low-mass clusters (see sec. 5). The mass-function slope is even flatter for clusters in the oldest age bin (bottom panel of Fig. 5), however for these a power-law mass function provides a rather poor fit and their mass function is much better described by e.g. a log-normal distribution, similar to what is seen for globular clusters in other galaxies.

From Figs. 4 and 5, we can also deduce the ratio of stars born in clusters that survive gas expulsion and infant mortality to the total number of stars born. Our sample contains 87 clusters with ages 10 Myr Myr and masses M⊙, which have a total mass of M⊙. If we assume that clusters follow a power-law mass function with exponent and extend the cluster mass function down to clusters of M⊙, the total mass in clusters is about a factor 3 higher. Integrating the Harris & Zaritsky (2009) star formation rate, we find that over the same time span M⊙ were born in field stars. Hence about 15% of all stars with Myr formed in clusters that survive for at least 10 Myr. This is within the range of ratios seen in other nearby galaxies as determined by Goddard, Bastian & Kennicutt (2010).
4 Theoretical estimates for the dissolution of star clusters
Star clusters are destroyed through a number of mechanisms, including residual gas expulsion (Hills, 1980; Goodwin, 1997; Baumgardt & Kroupa, 2007), two-body relaxation and external tidal fields (Vesperini & Heggie, 1997; Baumgardt & Makino, 2003) and tidal shocks from disc or bulge passages or passing giant molecular clouds (Spitzer, 1958; Ostriker et al., 1972; Wielen, 1985; Gnedin & Ostriker, 1997; Gieles et al., 2006a). In the following, we discuss each of these dissolution mechanisms in more detail.
4.1 Gas expulsion
Clusters typically form at the centres of dense molecular clouds with star formation efficiencies of about 30%. When the residual gas that is not converted into stars is removed by winds from young O and B type stars, the gravitational potential is lowered and some clusters can become unbound. Baumgardt & Kroupa (2007) showed that the impact of gas expulsion depends on the star formation efficiency , the timescale over which the gas is removed compared to the clusters crossing time , and the strength of the external tidal field which can be quantified through the ratio of the clusters half-mass radius prior to gas expulsion to its tidal radius . Although gas expulsion is thought to happen within the first few Myr after cluster formation, and therefore does not directly affect clusters with ages Myr, clusters need several initial crossing times to dissolve into the field. While dissolving, they could still be visible as clusters and would therefore influence our sample at the youngest ages (see e.g. Parmentier & Baumgardt 2012). The absence of any decrease of cluster frequency between 10 and 200 Myr (see Fig. 4), argues against the presence of dissolving clusters in our sample. We therefore assume that the observed cluster response to gas expulsion is over by an age of 10 Myr and neglect the influence of residual gas expulsion.
4.2 Stellar evolution
Stellar evolution reduces the masses of star clusters by about 45% during a Hubble time if stars follow a Kroupa (2001) IMF. Low-mass clusters with masses M⊙ will therefore fall below our adopted lower mass limit of M⊙ even without any dynamical mass loss. In order to model stellar evolution, we assume for the mass lost by stellar evolution:
| (1) |
where is the initial cluster mass, is the accumulated mass lost by the dynamical effects described below and is calculated as described in Lamers et al. (2010), assuming a metallicity of . Apart from mass loss, stellar evolution also causes the clusters to expand and very extended clusters could suffer additional dynamical mass loss due to this expansion and the related tidal overflow. However we neglected the influence of this process since it is most effective in the first few 100 Myr of cluster evolution, where we see little evidence for cluster dissolution (see Sec. 3).
4.3 Two-body relaxation and external tidal fields
The effects of two-body relaxation and a spherical external tidal field were modeled according to the results of Baumgardt & Makino (2003), who performed simulations of multi-mass clusters moving through spherically symmetric, isothermal galaxies. According to Baumgardt & Makino (2003), the lifetime of a star cluster moving through an external galaxy with circular velocity on an orbit with distance from the centre of the galaxy is given by
| (2) |
Here is the initial number of cluster stars, which can be calculated from the initial cluster mass and the mean mass of the cluster stars as . A Kroupa (2001) IMF between mass limits of 0.1 and 100 has M⊙. and are constants describing the dissolution process and are given by and (Baumgardt & Makino, 2003). Kinematic studies of various population tracer populations show that the LMC has near-solid body rotation in its inner parts (Meatheringham et al., 1988; Hughes, Wood & Reid, 1991, e.g.). van der Marel et al. (2002) found that the LMC shows solid body rotation out to a radius of about 4 kpc and an approximately flat rotation curve for larger radii. The rotation velocity of the LMC is however rather uncertain and depends on the tracer population that is used. Olsen & Massey (2007) find values of km/sec for carbon stars, km/sec for H I gas and km/sec for red supergiants and speculate that the differences could be a sign of the ongoing tidal perturbation of the LMC. If we assume a maximum circular rotation speed of the LMC of 80 km/sec, similar to what Olsen & Massey (2007) found for the rotation velocity of the H I gas, eq. 2 becomes
for radii kpc. We do not consider larger radii since observed LMC clusters mostly have kpc. Note that, as a result of the solid body rotation, does not depend on galactocentric distance.
We finally note that Gieles & Baumgardt (2008) have shown that compact clusters dissolve faster than the tidally filling clusters simulated by Baumgardt & Makino (2003) due to their smaller relaxation times. However we neglect this effect since it only becomes important for , where is the half-mass radius and is the Jacobi radius of the cluster. A cluster starting with an initial mass of M⊙ at a typical distance of 1 kpc from the centre of the LMC has a Jacobi radius pc, so this effect would only be important if clusters start with radii pc.
4.4 Disc shocks
Clusters passing through galactic discs experience tidal heating due to the difference in acceleration for stars in different parts of the cluster (Ostriker et al., 1972). The dissolution time against disc shocking is given by (Binney & Tremaine 1987, eq. 7-72):
| (3) |
where is the orbital time of the cluster, the 1D velocity dispersion of stars in the cluster, the velocity with which the cluster passes the disc, the root-mean square z distance of stars in the cluster and the gravitational acceleration of stars due to the disc. Using the virial theorem, we find
| (4) |
where for most density profiles. For a typical half-mass radius of pc, this gives
| (5) |
The LMC is classified as a SBm galaxy (de Vaucouleurs & Freeman, 1972) and contains a relatively thick disc with an out-of-plane axial ratio of or larger (van der Marel et al., 2002). The velocity dispersion of stars perpendicular to the LMC disc depends on their age and increases for older stars, similar to the situation in the Milky Way (van der Marel et al., 2009). We adopt a velocity dispersion of km/sec, which is intermediate between the velocity dispersion found for red supergiants and that of the H I gas (van der Marel et al., 2009). If we also assume a circular velocity of km/sec at a distance of R=1 kpc from the centre of the LMC, we find Myr. For an infinitely thin disc with radial scale length of kpc (Weinberg & Nikolaev, 2001) and a total mass in stars and gas of M⊙ (van der Marel et al., 2002), the acceleration in z direction is pc/Myr2 at kpc. Inserting all the values in eq. 3 gives a dissolution time of roughly 110 Myr for a M⊙ cluster. Eq. 3 is however only valid for impulsive encounters in which the time scale for shocking is much smaller than the orbital time for stars in the cluster. Slower encounters have a reduced effect since stars with orbital times can adiabatically adjust to the shocking. Gnedin & Ostriker (1997) give various forms for the adiabatic correction factor. If we use their eq. 11, then
| (6) |
where is the ratio of the angular velocity of stars in the cluster to the crossing timescale of the cluster through the disc and is given by
| (7) |
For a vertical scale height of pc (van der Marel et al., 2002) and a cluster mass of M⊙, , and . Disc shocks therefore seem to have a negligible influence on the evolution of star clusters in the LMC. Even if we set km/sec, corresponding to a cluster moving on a highly inclined orbit through the disc and assume a smaller scale height of pc in the past, the lifetime of a M⊙ cluster against disc shocks is still larger than that against two-body relaxation. We therefore neglect the influence of disc shocks on the cluster evolution.
4.5 GMC encounters
Similar to galactic discs, passing giant molecular clouds create transient tidal forces on a star cluster, which increases the internal energy of a cluster and leads to cluster dissolution (Spitzer, 1958). Wielen (1985) found that giant molecular clouds dominate the dissolution of star clusters in the solar neighborhood.
The most thorough calculation of the influence of GMC encounters has been given by Gieles et al. (2006), who showed that considering only the total energy gain can overestimate the effect of GMC encounters since much of the energy gained by the cluster is carried away by escapers and that considering the mass loss of a cluster leads to a better description of the dissolution process. Gieles et al. (2006) also showed that GMCs cannot destroy clusters with more than M⊙ in a single disruptive encounter if one takes the finite size of the GMCs into account. For the cumulative effect of many distant encounters, they derived the following expression for the lifetime of a star cluster of mass and half-mass radius :
| (8) |
where is the mass density of GMCs in a galaxy, the typical surface density of a single GMC, is the ratio of relative mass loss to the relative energy gain of a cluster during an encounter, a numerical correction factor for close encounters, is the typical relative velocity between a star cluster and a GMC, the root-mean square radius of the cluster, and a constant which depends on the density profile of the cluster. A King (1966) model with =5.0 has and . The typical velocity dispersion of stars in the LMC is km/sec (van der Marel et al., 2002). Fig. 12 in Gieles et al. shows that for a typical cluster mass of M⊙ and a typical GMC mass of M⊙, the correction factor is slightly larger than unity, so we adopt . We also assume as found by Gieles et al. through direct -body simulations and an average cluster radius of pc. The mass density and the surface density of the GMCs are taken from the results of the NANTEN LMC molecular cloud survey (Fukui et al., 2008). Fukui et al. found 270 molecular clouds with masses M⊙ within a survey area of 30 deg2. Inside 2 kpc from the center of the LMC, they found a surface mass density of GMCs of 2 M⊙/pc2. Assuming a disc scale height of 180 pc (Padoan et al., 2001) for the gas and that all GMCs are located within scale height of the plane of the disc, gives a space density M⊙/pc3. Hughes et al. (2010) found an average surface density of Mpc2 for individual GMCs in the LMC. Inserting all values, we find for the lifetime of star clusters in the LMC:
| (9) |
Unlike in the Milky Way, GMC encounters do not seem to be a dominant dissolution process for star clusters in the LMC, the main reason being their lower space density as a result of the large disc scale height and their smaller surface density ( Mpc2 for clouds in the LMC vs. Mpc2 in the Milky Way, see Solomon et al. 1987). -body simulations by Weinberg (2000) suggest that the large scale height of the LMC disc could be a result of the interaction with the Milky Way. Hence the importance of GMC encounters might have been higher in the past when the LMC disc had a smaller scale height. It is however unlikely that the lifetime would drop below a Hubble time even for the smallest clusters in our sample, and we therefore also neglect GMC encounters.
We are therefore left with two-body relaxation driven evaporation as the only dissolution process which seems to have a significant influence on the LMC cluster system. In order to model relaxation driven evaporation, we assume that the dynamical mass loss is linear in time, so the dynamically lost mass is given by:
| (10) |
where is the total mass lost by stellar evolution up to time .
We assume that clusters form with the same rate as the field stars and use the star formation history of LMC field stars as derived by Harris & Zaritsky (2009) to form clusters. We assume that clusters form with a power-law mass function and adjust the exponent such that the mass function of clusters in the youngest age bin in Fig. 5 is fitted. We also assume that clusters follow an exponential density distribution in the LMC with scale length kpc, similar to what is seen for the field stars, and that clusters move on circular orbits. Clusters are then evolved according to the description presented in this section up to the present time. The mass and age distribution of the surviving clusters with M⊙ and absolute luminosities mag is then compared with the observational data for LMC clusters and we discuss the results in the next section.
5 Comparison with theory
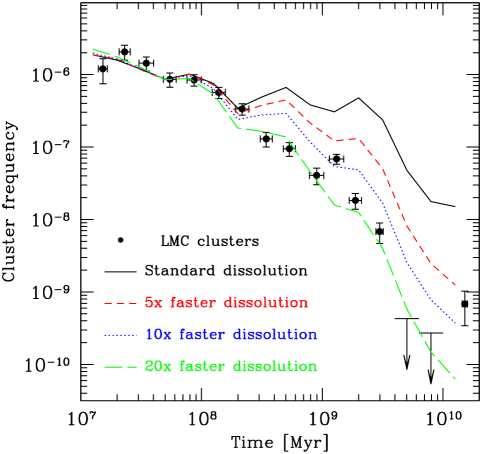
The left panel of Fig. 6 shows a comparison between the predicted and observed cluster frequency as a function of time, assuming that star clusters form with a power-law mass function and with a rate similar to the star formation rate determined by Harris & Zaritsky (2009) for LMC field stars. Clusters are distributed in the LMC following an exponential density distribution up to a maximum radius of kpc, similar to the largest distances from the centre of the LMC for clusters in our sample. The black, solid line depicts the expected cluster frequency distribution if dissolution mechanisms are applied to star clusters exactly as described in the previous section. It can be seen that the frequency of the predicted clusters decreases significantly slower with time than the cluster frequency of the observed clusters for ages Myr, and the black solid line predicts about a factor 10 more clusters than observed for ages of several Gyr. If due to incompleteness, several hundred unstudied clusters with ages Gyr would still exist in the LMC. While new clusters in this age range are still being found (e.g. Piatti, 2011), it seems rather unlikely that so many clusters are missing from our sample.
It is therefore much more likely that the theoretical estimates from sec. 4 underestimate the true rate of cluster dissolution. The red (short dashed), blue (dotted) and green (long dashed) lines show the predicted cluster distribution if we reduce the cluster lifetimes by factors of 5, 10 and 20 respectively. It can be seen that lifetimes need to be reduced by about a factor of at least 10 to 20 to give an agreement between predicted and observed cluster frequency.
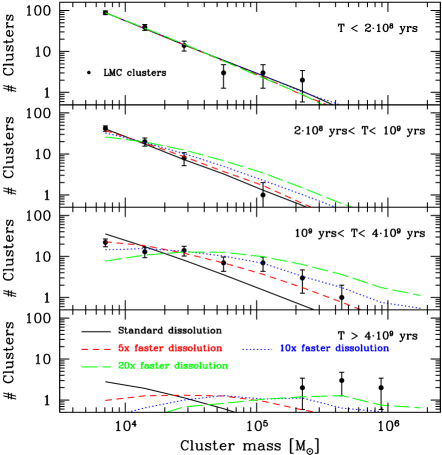
The right panel of Fig. 6 depicts the mass distribution of star clusters as a function of their age. If we apply the various dissolution mechanisms as described in the previous section (solid lines), the mass distribution of star clusters up to 1 Gyr is in good agreement with the observational data since the predicted mass function can be fitted by the same slope for all ages, similar to what was found for the observed cluster distribution in sec. 3. The reason is that in this case the turnover carved into the cluster mass function remains at masses lower than our mass-cut, and is therefore not seen in our cluster sample. As a result, at masses higher than 5000 M⊙, the slope of the cluster mass function is preserved during the first Gyr. For ages larger than yrs, dissolution of clusters more massive than 5000 M⊙ becomes important and the slope starts to flatten at the low-mass end of our sample. For clusters that are more than 4 Gyr old and standard dissolution, the power-law mass function develops a turn-over at a few thousand solar masses. The location of this turn-over is at significantly smaller masses than the observed one, since the observed one is around M⊙. In order to bring the mass function of predicted clusters in the oldest age bin into better agreement with observations a reduction in the lifetimes by about a factor 20 is needed (see green, long-dashed curve). In the age bin from yrs and yrs, lifetimes reduced by a factor 20 produce a mass function that also has a turnover, which is not present in the observed data. A reduction by a factor of 5 to 10 is here in much better agreement with the observations.
The comparison with observations indicates that cluster lifetimes are shorter by about a factor 10 to 20 than given by the theoretical estimates of sec. 4. Given that most of the results in that section were derived based on -body simulations, which are to a large degree free of underlying assumptions, such a reduction seems to be outside the uncertainties of the theoretical estimates. It also does not seem possible to achieve such a reduction in lifetime by changing the adopted LMC parameters, like the rotational velocity or the velocity dispersion, within the uncertainties quoted in the literature. Either the mode of star formation and the properties of LMC clusters were drastically different at ages of 200 Myr and larger, or our knowledge of star formation in the LMC and the star clusters which were formed at these ages is still incomplete. For example, if the star formation rate at ages Gyr was smaller than estimated by Harris & Zaritsky (2009), the difference in frequency between the predicted and observed curves would be smaller and the reduction in lifetime necessary to fit the observed cluster frequencies would be smaller. In addition, the globular cluster system of the LMC might have formed with a log-normal distribution instead of a power-law (Vesperini, 1998; Parmentier & Gilmore, 2007), alleviating the need to drastically modify cluster lifetimes in order to predict the cluster mass distribution in the oldest age bin.
6 Conclusions
We have compiled a new catalogue of ages and masses of LMC star clusters by combining results from four different surveys. Our catalogue covers the whole LMC and contains data for 307 clusters with masses M⊙, ages yrs and absolute magnitudes . We find no significant influence of cluster dissolution for clusters younger than about 200 Myr, since both the ratio of the number of clusters divided by the absolute star formation rate as well as the mass function of clusters is independent of time for these clusters. If residual gas expulsion is an important dissolution mechanism for star clusters, its influence must be restricted to the first 10 Myr of cluster evolution or low-mass clusters with masses M⊙. Young star clusters in the LMC form with a power-law mass function with slope . If we extrapolate this mass function down to M⊙, then about 15% of all stars in the LMC form in bound star clusters that survive for at least 10 Myr.
For ages larger than Myr, the cluster frequency starts to drop and the ratio of cluster frequency to star formation rate is about a factor 40 smaller at Gyr than what it was at Myr. In addition, the mass function of clusters flattens for clusters older than Gyr. The number of missing clusters in our catalogue needed to explain this flattening seems to be too large to be explained by incompleteness and we therefore conclude that most of the flattening is due to cluster dissolution. The amount of cluster dissolution necessary to fit the observed cluster distribution is about a factor 10 higher than predicted by theory, indicating either that the effectiveness of the considered processes was significantly underestimated or that older star cluster formed with a mass distribution significantly different from their younger counterparts.
Acknowledgments
HB is supported by the Australian Research Council through Future Fellowship grant FT0991052. EKG wishes to acknowledge support from the Sonderforschungsbereich ”The Milky Way System” (SFB 881) of the German Research Foundation (DFG), especially via subproject B5. PA acknowledges funding by the National Natural Science Foundation of China (NSFC, grant number 11073001). GP acknowledges support from the Max-Planck-Institut für Radioastronomie (Bonn) in the form of a Research Fellowship.
References
- Anders et al. (2009) Anders, P., Lamers, H.J.G.L.M., Baumgardt, H., 2009, A&A 502, 817
- Baumgardt & Makino (2003) Baumgardt, H., Makino, J., 2003, MNRAS 340, 227
- Baumgardt & Kroupa (2007) Baumgardt, H., Kroupa, P., 2007, MNRAS 380, 1589
- Bertelli et al. (1992) Bertelli, G. Mateo, M., Chiosi, C., Bressan, A., 1992, ApJ 388, 400
- Bica et al. (2008) Bica, E., Bonatto, C., Dutra, C. M., Santos, J. F. C., 2008, MNRAS, 389, 678
- Boutloukos & Lamers (2002) Boutloukos, S. G., Lamers, H. J. G. L. M., 2002, in Geisler D., Grebel E. K., Minniti D. eds, IAU Symposium 207, Extragalactic Star Clusters, San Francisco, p. 703
- Boutloukos & Lamers (2003) Boutloukos, S. G., Lamers, H. J. G. L. M., 2003, MNRAS 338, 717
- Chabrier (2001) Chabrier, G., 2001, ApJ 554, 1274
- Chandar, Fall & Whitmore (2006) Chandar, R., Fall, S. M., Whitmore, B. C., 2006, ApJ 650, L111
- Chandar, Fall & Whitmore (2010) Chandar, R., Fall, S. M., Whitmore, B. C., 2010, ApJ 711, 1263
- Chiosi et al. (2006) Chiosi, E., Vallenari, A., Held, E. V., Rizzi, L., Moretti, A., 2006, A&A 452, 179
- Clauset, Rohilla Shalizi & Newman (2009) Clauset, A., Rohilla Shalizi, C., Newman, M.E.J., 2009, SIAM Review 51, 661
- de Grijs & Anders (2006) de Grijs, R., Anders, P., 2006, MNRAS 366, 295
- de Vaucouleurs & Freeman (1972) de Vaucouleurs, G., Fremmen, K. C., 1972, Vistas in Astronomy 14, 163
- Fukui et al. (2008) Fukui, Y., et al., 2008, ApJSS, 178, 56
- Goddard, Bastian & Kennicutt (2010) Goddard, Q. E., Bastian, N., Kennicutt, R. C., 2010, MNRAS 405, 857
- Gieles et al. (2006a) Gieles, M., Portegies Zwart, S. F., Baumgardt, H., Athanassoula, E., Lamers, H.J.G.L.M., Sipior, M., Leenaarts, J., 2006, MNRAS 371, 793
- Gieles et al. (2006b) Gieles, M., Larsen, S. S., Bastian, N., Stein, I. T., 2006, A&A, 450, 129
- Gieles & Bastian (2008) Gieles, M., Bastian, N., 2008, A&A 482, 165
- Gieles & Baumgardt (2008) Gieles, M., Baumgardt, H., 2008, MNRAS 389, L28
- Girardi et al. (1995) Girardi, L., Chiosi, C., Bertelli, G., Bressan, A., 1995, A&A 298, 87
- Girardi et al. (2010) Girardi, L., et al., 2010, ApJ 724, 1030
- Glatt, Grebel & Koch (2010) Glatt, K., Grebel, E. K., Koch, A., 2010, A&A 517, 50
- Gnedin & Ostriker (1997) Gnedin, O., Ostriker, J., 1997, ApJ 474, 223
- Goddard, Bastian & Kennicutt (2010) Goddard, Q. E., Bastian, N., Kennicutt, R. C., 2010, MNRAS, 405, 857
- Goodwin (1997) Goodwin, S., 1997, MNRAS 284, 785
- Harris & Zaritsky (2009) Harris, J., Zaritsky, D., 2009, AJ 138, 1243
- Hills (1980) Hills, J.G., 1980, ApJ 235, 986
- Holtzman et al. (1999) Holtzman, J. A., et al., 1999, AJ 118, 2262 Hughes, S. M. G., Wood, P. R., Reid, N., 1991, AJ 101, 1304
- Hughes, Wood & Reid (1991) Hughes, S. M. G., Wood, P. R., Reid, N., 1991, AJ 101, 1304
- Hughes et al. (2010) Hughes, A., et al., 2010, MNRAS 406, 2065
- Hunter et al. (2003) Hunter D. A., Elmegreen B. G., Dupuy T. J., Mortonson M., 2003, AJ, 126, 1836
- Kroupa (1998) Kroupa, P., 1998, MNRAS 298, 231
- Kroupa (2001) Kroupa, P., 2001, MNRAS 322, 231
- Lamers et al. (2005) Lamers, H. J. G. L. M., Gieles, M., Bastian, N., Baumgardt, H., Kharchenko, N. V., Portegies Zwart, S., 2005a, A&A, 441, 117
- Lamers et al. (2005) Lamers, H. J. G. L. M., Gieles, M., Portgies Zwart, S. F., 2005b, A&A, 429, 173
- Lamers et al. (2010) Lamers, H. J. G. L. M., Baumgardt, H., Gieles, M., 2010, MNRAS, 409, 305
- Mackey & Gilmore (2003) Mackey, A. D., Gilmore, G. F., 2003, MNRAS 338, 85
- Marigo et al. (2008) Marigo, P., Girardi, L., Bressan, A., Groenewegen, M.A.T., Silva, L., Granato, G.L., 2008, A&A 482, 883
- Maschberger & Kroupa (2011) Maschberger, T., Kroupa, P., 2011, MNRAS 411, 1495
- Meatheringham et al. (1988) Meatheringham, S. J., Dopita, M. A., Ford, H. C., Webster, B. L., 1988, ApJ 327, 651
- Milone et al. (2009) Milone, A. P., Bedin, L. R., Piotto, G., Anderson, J., 2009, A&A 497, 755
- Ostriker et al. (1972) Ostriker, J. P., Spitzer, L. Jr., Chevalier, R. A., 1972, ApJ 176, L51
- Olsen & Massey (2007) Olsen, K. A. G., Massey, P., 2007, ApJ 656, L61
- Olszewski et al. (1996) Olszewski, E. W., Suntzeff, N. B.; Mateo, M., 1996, ARA&A 34, 511
- Padoan et al. (2001) Padoan, P., Kim, S., Goodman, A., 2001, ApJ 555, L33
- Parmentier & Gilmore (2007) Parmentier, G., Gilmore, G., 2007, MNRAS 377, 352
- Parmentier & de Grijs (2008) Parmentier, G., de Grijs, R., 2008, MNRAS 383, 1103
- Parmentier & Baumgardt (2012) Parmentier, G., Baumgardt, H., 2012, MNRAS submitted
- Piatti (2011) Piatti, A. E., 2011, MNRAS 418, L40
- Pietrzynski & Udalski (2000) Pietrzynski, G., Udalski, A., 2000, Acta Astron., 50, 337
- Piskunov et al. (2008) Piskunov, A.E., Kharchenko, N.V., Schilbach, E., Röser, S., Scholz, R.-D., Zinnecker, H., 2008, A&A, 487, 557
- Piskunov et al. (2011) Piskunov, A.E., Kharchenko, N.V., Schilbach, E., Röser, S., Scholz, R.-D., Zinnecker, H., 2011, A&A, 525, 122
- Popescu, Hanson & Elmegreen (2012) Popescu, B., Hanson, M. M, Elmegreen, B. G., 2012, ApJ 751, 122
- Solomon et al. (1987) Solomon, P. M., Rivolo, A. R., Barrett, J., Yahil, A., 1987, ApJ 319, 730
- Spitzer (1958) Spitzer, L. Jr., 1958, ApJ 127, 17
- Udalski et al. (1998) Udalski, A., et al. 1998, Acta Astron., 48, 147
- van der Marel et al. (2002) van der Marel, R. P., Alves, D. R., Hardy, E., Suntzeff, N. B., 2002, AJ, 124, 2639
- van der Marel et al. (2009) van der Marel, R. P., Kallivayalil, N., Besla, G., 2009, in van Loon J. T., Oliveira J. M., eds, Proc. IAU Symp. 256, The Magellanic System: Stars, Gas and Galaxies. Cambridge Univ. Press, Cambridge, p. 81
- Vesperini & Heggie (1997) Vesperini, E., Heggie, D. C., 1997, MNRAS 289, 898
- Vesperini (1998) Vesperini, E., 1998, MNRAS 299, 1091
- Weinberg (2000) Weinberg, M. D., 2000, ApJ 532, 922
- Weinberg & Nikolaev (2001) Weinberg, M. D., Nikolaev, S., 2000, ApJ 548, 712
- Whitmore et al. (2010) Whitmore, B. C., et al., 2010, AJ 140, 75
- Wielen (1985) Wielen, R., 1985, in Goodman J., Hut P., eds, IAU Symp. 113, Dynamics of Star Clusters. Reidel, Dordrecht, p. 449
- Zaritsky et al. (2002) Zaritsky, D., Harris, J., Thompson, I. B.; Grebel, E. K., Massey, P., 2002, AJ 123, 855
- Zaritsky et al. (2004) Zaritsky, D., Harris, J., Thompson, I. B.; Grebel, E. K., 2004, AJ 128, 1606
| Name | RA | DEC | age | age | M | Data | Alternative | |||||
|---|---|---|---|---|---|---|---|---|---|---|---|---|
| [J2000] | [J2000] | [yr] | [yr] | [M⊙] | Source | Name | ||||||
| NGC1466 | 3 | 44 | 32.9 | -71 | 40 | 13.0 | -7.59 | 10.10 | 0.01 | 5.31 | 4 | |
| NGC1651 | 4 | 37 | 31.1 | -70 | 35 | 2.0 | -7.16 | 9.30 | 0.09 | 5.24 | 4 | |
| NGC1644 | 4 | 37 | 39.0 | -66 | 11 | 58.0 | -5.61 | 9.19 | 0.05 | 4.32 | 4 | |
| NGC1652 | 4 | 38 | 22.0 | -68 | 40 | 21.0 | -5.37 | 9.23 | 0.05 | 4.29 | 4 | |
| NGC1841 | 4 | 45 | 23.9 | -83 | 59 | 56.0 | -7.80 | 10.09 | 0.01 | 5.12 | 4 | |
| LW52 | 4 | 45 | 46.0 | -71 | 35 | 40.9 | -5.30 | 8.70 | 0.20 | 3.83 | 1 | |
| SL37 | 4 | 46 | 46.0 | -72 | 23 | 40.9 | -4.99 | 8.70 | 0.20 | 3.71 | 1 | |
| NGC1695 | 4 | 47 | 43.0 | -69 | 22 | 26.0 | -6.24 | 8.00 | 0.20 | 3.73 | 1 | |
| NGC1698 | 4 | 49 | 4.0 | -69 | 6 | 52.9 | -7.09 | 8.00 | 0.20 | 4.07 | 1 | |
| HS35 | 4 | 49 | 33.0 | -69 | 43 | 40.0 | -4.93 | 9.00 | 0.18 | 3.89 | 2 | KMHK124 |
| NGC1704 | 4 | 49 | 55.0 | -69 | 45 | 19.1 | -7.09 | 7.50 | 0.20 | 3.76 | 1 | |
| HS37 | 4 | 50 | 28.9 | -68 | 42 | 42.1 | -4.65 | 9.25 | 0.23 | 4.02 | 2 | KMHK139 |
| NGC1711 | 4 | 50 | 37.3 | -69 | 59 | 4.0 | -8.88 | 7.70 | 0.05 | 4.21 | 4 | |
| SL58 | 4 | 50 | 59.0 | -69 | 38 | 13.0 | -6.14 | 8.37 | 0.15 | 3.95 | 2 | KMHK153 |
| SL66 | 4 | 51 | 56.5 | -70 | 23 | 25.1 | -5.50 | 9.23 | 0.15 | 4.34 | 2 | KMHK180 |
| NGC1718 | 4 | 52 | 25.6 | -67 | 3 | 6.0 | -7.14 | 9.30 | 0.30 | 5.10 | 4 | |
| SL75 | 4 | 52 | 55.7 | -68 | 55 | 11.6 | -6.49 | 8.20 | 0.30 | 3.96 | 2 | KMHK199 |
| KMHK208 | 4 | 53 | 7.2 | -69 | 2 | 36.0 | -6.18 | 8.58 | 0.28 | 4.10 | 2 | |
| SL76 | 4 | 53 | 9.0 | -68 | 12 | 41.0 | -6.71 | 8.10 | 0.40 | 3.98 | 1 | |
| NGC1732 | 4 | 53 | 11.8 | -68 | 39 | 1.1 | -6.72 | 7.84 | 0.17 | 3.83 | 2 | |
| KMHK229 | 4 | 53 | 51.0 | -69 | 34 | 19.0 | -5.04 | 9.05 | 0.31 | 3.97 | 2 | |
| NGC1751 | 4 | 54 | 12.0 | -69 | 48 | 25.0 | -6.83 | 9.15 | 0.05 | 4.60 | 4 | |
| NGC1754 | 4 | 54 | 18.9 | -70 | 26 | 31.0 | -7.36 | 10.19 | 0.06 | 5.39 | 4 | |
| NGC1735 | 4 | 54 | 19.0 | -67 | 6 | 1.1 | -7.79 | 7.70 | 0.20 | 4.17 | 1 | |
| BSDL210 | 4 | 54 | 37.0 | -68 | 57 | 33.1 | -5.78 | 8.40 | 0.40 | 3.82 | 1 | |
| BRHT43b | 4 | 54 | 44.0 | -68 | 57 | 45.0 | -6.26 | 8.30 | 0.60 | 3.94 | 1 | |
| NGC1756 | 4 | 54 | 50.0 | -69 | 14 | 17.0 | -6.26 | 8.40 | 0.05 | 4.02 | 4 | |
| SL106 | 4 | 55 | 5.0 | -69 | 40 | 26.0 | -7.18 | 7.70 | 0.20 | 3.93 | 1 | |
| NGC1755 | 4 | 55 | 13.0 | -68 | 12 | 16.9 | -9.11 | 7.40 | 0.20 | 4.50 | 1 | |
| SL105 | 4 | 55 | 23.0 | -68 | 32 | 29.0 | -6.45 | 8.00 | 0.20 | 3.81 | 1 | |
| HS65 | 4 | 55 | 31.7 | -68 | 52 | 58.8 | -5.02 | 8.97 | 0.09 | 3.91 | 2 | H88-31 |
| KMHK292 | 4 | 55 | 34.0 | -69 | 26 | 53.2 | -7.78 | 7.20 | 0.20 | 3.84 | 1 | |
| KMHK300 | 4 | 55 | 39.0 | -70 | 32 | 48.0 | -4.68 | 9.06 | 0.28 | 3.83 | 2 | |
| NGC1777 | 4 | 55 | 48.9 | -74 | 17 | 3.0 | -7.38 | 9.08 | 0.15 | 4.75 | 4 | |
| SL114 | 4 | 56 | 7.9 | -69 | 14 | 47.6 | -7.27 | 7.35 | 0.10 | 3.73 | 2 | KMHK305 |
| SL117 | 4 | 56 | 22.0 | -68 | 58 | 0.1 | -6.90 | 8.10 | 0.40 | 4.06 | 1 | |
| SL116 | 4 | 56 | 25.1 | -68 | 48 | 13.9 | -6.88 | 7.68 | 0.03 | 3.80 | 2 | KMHK315 |
| NGC1767 | 4 | 56 | 26.0 | -69 | 24 | 11.9 | -8.41 | 7.30 | 0.40 | 4.15 | 1 | |
| SL124e | 4 | 56 | 31.0 | -69 | 58 | 54.0 | -5.50 | 8.73 | 0.17 | 3.93 | 2 | KMHK324e |
| HD32228 | 4 | 56 | 34.0 | -66 | 28 | 25.0 | -7.77 | 7.30 | 0.20 | 3.89 | 1 | |
| BSDL285 | 4 | 56 | 37.0 | -68 | 14 | 12.8 | -5.83 | 8.50 | 0.40 | 3.91 | 1 | |
| SL119 | 4 | 56 | 38.1 | -68 | 9 | 53.3 | -6.16 | 8.86 | 0.08 | 4.28 | 2 | KMHK316 |
| NGC1772 | 4 | 56 | 52.0 | -69 | 33 | 22.0 | -7.76 | 7.60 | 0.20 | 4.11 | 1 | |
| KMHK355 | 4 | 57 | 22.9 | -70 | 28 | 58.6 | -3.81 | 9.27 | 0.18 | 3.70 | 2 | |
| SL134 | 4 | 57 | 30.0 | -68 | 21 | 47.0 | -6.79 | 7.57 | 0.09 | 3.70 | 2 | KMHK349 |
| SL136 | 4 | 57 | 30.6 | -69 | 3 | 6.5 | -5.80 | 9.19 | 0.11 | 4.39 | 2 | KMHK352 |
| NGC1782 | 4 | 57 | 51.0 | -69 | 23 | 35.2 | -8.30 | 7.20 | 0.20 | 4.05 | 1 | |
| NGC1774 | 4 | 58 | 5.0 | -67 | 14 | 31.9 | -8.15 | 7.70 | 0.20 | 4.32 | 1 | |
| BSDL365 | 4 | 58 | 40.0 | -70 | 31 | 39.0 | -5.36 | 8.70 | 0.60 | 3.85 | 1 | |
| SL151 | 4 | 58 | 51.1 | -69 | 57 | 32.5 | -5.59 | 9.15 | 0.07 | 4.10 | 2 | KMHK388 |
| SL150 | 4 | 58 | 56.5 | -69 | 13 | 2.3 | -5.03 | 9.44 | 0.01 | 4.34 | 2 | KMHK386 |
| NGC1791 | 4 | 59 | 7.4 | -70 | 10 | 7.5 | -5.94 | 8.15 | 0.23 | 3.71 | 2 | |
| NGC1786 | 4 | 59 | 7.9 | -67 | 44 | 45.0 | -8.41 | 10.18 | 0.01 | 5.57 | 4 | |
| NGC1783 | 4 | 59 | 8.0 | -65 | 59 | 18.0 | -8.11 | 9.18 | 0.05 | 5.26 | 4 | |
| SL153 | 4 | 59 | 19.0 | -66 | 19 | 7.0 | -6.92 | 8.20 | 0.40 | 4.14 | 1 | |
| BRHT61a | 4 | 59 | 21.4 | -68 | 50 | 36.3 | -5.98 | 8.79 | 0.01 | 4.16 | 2 | |
| NGC1793 | 4 | 59 | 37.0 | -69 | 33 | 27.0 | -6.40 | 8.00 | 0.40 | 3.79 | 1 | |
| NGC1795 | 4 | 59 | 46.0 | -69 | 48 | 6.0 | -6.08 | 9.11 | 0.05 | 4.36 | 4 | |
| NGC1801 | 5 | 0 | 35.6 | -69 | 36 | 50.1 | -6.91 | 8.45 | 0.11 | 4.31 | 2 | |
| Name | RA | DEC | age | age | M | Data | Alternative | |||||
|---|---|---|---|---|---|---|---|---|---|---|---|---|
| [J2000] | [J2000] | [yr] | [yr] | [M⊙] | Source | Name | ||||||
| HS87 | 5 | 0 | 41.0 | -69 | 20 | 31.0 | -4.56 | 9.25 | 0.05 | 3.98 | 3 | |
| SL168 | 5 | 0 | 43.0 | -65 | 27 | 18.0 | -6.29 | 8.30 | 0.40 | 3.96 | 1 | |
| HS85 | 5 | 0 | 51.0 | -67 | 48 | 14.0 | -4.71 | 9.02 | 0.04 | 3.82 | 2 | KMHK428 |
| NGC1804 | 5 | 1 | 4.0 | -69 | 4 | 57.0 | -6.83 | 7.80 | 0.40 | 3.85 | 1 | |
| HS88 | 5 | 1 | 5.3 | -68 | 5 | 0.7 | -4.55 | 9.39 | 0.16 | 4.10 | 2 | KMHK436 |
| SL174 | 5 | 1 | 12.3 | -67 | 49 | 4.9 | -5.93 | 9.04 | 0.08 | 4.32 | 2 | KMHK439 |
| H88-93 | 5 | 1 | 29.4 | -67 | 38 | 0.7 | -3.72 | 9.48 | 0.37 | 3.85 | 2 | |
| KMHK448 | 5 | 1 | 29.5 | -68 | 42 | 42.2 | -5.54 | 8.45 | 0.08 | 3.77 | 3 | |
| SL180 | 5 | 1 | 37.0 | -69 | 2 | 18.0 | -5.54 | 9.20 | 0.10 | 4.32 | 3 | |
| SL181 | 5 | 1 | 51.0 | -69 | 12 | 50.0 | -5.17 | 8.80 | 0.10 | 3.85 | 3 | |
| NGC1806 | 5 | 2 | 11.0 | -67 | 59 | 17.0 | -7.50 | 9.18 | 0.05 | 5.01 | 4 | |
| NGC1805 | 5 | 2 | 21.0 | -66 | 6 | 42.1 | -8.42 | 7.60 | 0.20 | 4.37 | 1 | |
| NGC1815 | 5 | 2 | 27.0 | -70 | 37 | 14.9 | -6.57 | 7.80 | 0.20 | 3.75 | 1 | |
| HS94 | 5 | 2 | 30.6 | -70 | 17 | 33.5 | -4.39 | 9.05 | 0.19 | 3.71 | 2 | KMHK468 |
| SL188 | 5 | 2 | 33.7 | -68 | 49 | 24.0 | -6.16 | 8.10 | 0.10 | 3.76 | 3 | |
| SL191 | 5 | 3 | 6.1 | -69 | 2 | 12.0 | -7.00 | 8.10 | 0.05 | 4.10 | 3 | |
| SL197 | 5 | 3 | 34.3 | -67 | 37 | 32.2 | -4.95 | 9.10 | 0.08 | 3.93 | 3 | KMHK482 |
| HS102 | 5 | 3 | 38.5 | -69 | 23 | 10.0 | -4.78 | 9.10 | 0.05 | 3.87 | 3 | |
| NGC1818 | 5 | 4 | 13.8 | -66 | 26 | 2.0 | -9.61 | 7.40 | 0.20 | 4.13 | 4 | |
| NGC1825 | 5 | 4 | 19.4 | -68 | 55 | 40.0 | -7.24 | 7.80 | 0.10 | 4.02 | 3 | |
| NGC1828 | 5 | 4 | 21.0 | -69 | 23 | 17.0 | -6.69 | 8.40 | 0.10 | 4.18 | 3 | |
| KMK88-8 | 5 | 4 | 30.0 | -69 | 9 | 21.0 | -5.25 | 8.60 | 0.10 | 3.75 | 3 | H88-106 |
| KMK88-7 | 5 | 4 | 31.0 | -69 | 21 | 19.0 | -5.16 | 9.00 | 0.10 | 3.99 | 3 | H88-108 |
| NGC1830 | 5 | 4 | 39.0 | -69 | 20 | 27.1 | -6.25 | 8.60 | 0.10 | 4.14 | 3 | |
| NGC1837 | 5 | 4 | 53.0 | -70 | 42 | 55.1 | -7.77 | 7.30 | 0.20 | 3.89 | 1 | |
| KMK88-11 | 5 | 5 | 4.1 | -68 | 54 | 35.8 | -5.75 | 9.05 | 0.15 | 4.25 | 3 | H88-117 |
| NGC1835 | 5 | 5 | 6.7 | -69 | 24 | 15.0 | -8.74 | 10.22 | 0.07 | 5.83 | 4 | |
| NGC1834 | 5 | 5 | 12.0 | -69 | 12 | 27.0 | -7.12 | 8.10 | 0.15 | 4.15 | 3 | |
| SL212 | 5 | 5 | 12.4 | -68 | 33 | 10.7 | -6.49 | 8.70 | 0.10 | 4.31 | 3 | |
| HS112 | 5 | 5 | 33.3 | -69 | 6 | 59.2 | -5.39 | 8.95 | 0.04 | 4.04 | 2 | |
| NGC1836 | 5 | 5 | 35.7 | -68 | 37 | 42.0 | -6.84 | 8.70 | 0.05 | 4.45 | 3 | |
| SL224 | 5 | 5 | 43.3 | -70 | 19 | 30.1 | -5.49 | 8.50 | 0.42 | 3.77 | 2 | KMHK534 |
| HS111 | 5 | 5 | 44.9 | -68 | 30 | 23.9 | -4.39 | 9.10 | 0.10 | 3.71 | 3 | |
| HS115 | 5 | 5 | 54.8 | -70 | 22 | 21.4 | -4.98 | 8.97 | 0.25 | 3.89 | 2 | KMHK537 |
| NGC1839 | 5 | 6 | 1.0 | -68 | 37 | 36.1 | -7.17 | 7.90 | 0.20 | 4.05 | 1 | |
| NGC1831 | 5 | 6 | 17.4 | -64 | 55 | 11.0 | -8.41 | 8.50 | 0.30 | 4.81 | 4 | |
| HS117 | 5 | 6 | 25.9 | -68 | 42 | 12.0 | -5.10 | 9.20 | 0.10 | 4.15 | 3 | |
| SL228w | 5 | 6 | 28.0 | -66 | 54 | 24.1 | -6.49 | 8.20 | 0.20 | 3.96 | 1 | |
| SL230 | 5 | 6 | 33.0 | -68 | 21 | 47.9 | -7.55 | 7.40 | 0.20 | 3.88 | 1 | |
| SL234 | 5 | 6 | 53.0 | -68 | 43 | 7.0 | -6.31 | 7.95 | 0.20 | 3.73 | 1 | |
| OGLE-LMC0114 | 5 | 6 | 56.0 | -69 | 25 | 48.0 | -3.88 | 9.25 | 0.10 | 3.71 | 3 | |
| SL237 | 5 | 6 | 58.3 | -69 | 9 | 0.1 | -7.11 | 7.78 | 0.05 | 3.95 | 3 | |
| NGC1847 | 5 | 7 | 7.7 | -68 | 58 | 17.0 | -10.41 | 7.42 | 0.30 | 4.97 | 4 | |
| NGC1844 | 5 | 7 | 29.0 | -67 | 19 | 23.9 | -6.31 | 7.90 | 0.40 | 3.70 | 1 | |
| NGC1846 | 5 | 7 | 35.0 | -67 | 27 | 39.0 | -7.82 | 9.17 | 0.05 | 5.10 | 4 | |
| SL249 | 5 | 7 | 35.5 | -70 | 44 | 56.1 | -6.14 | 8.38 | 0.14 | 3.95 | 2 | KMHK562 |
| SL244 | 5 | 7 | 38.9 | -68 | 32 | 30.9 | -6.12 | 9.43 | 0.01 | 4.77 | 2 | |
| SL250 | 5 | 7 | 51.0 | -69 | 26 | 10.6 | -5.83 | 9.00 | 0.10 | 4.25 | 3 | |
| NGC1850 | 5 | 8 | 45.8 | -68 | 45 | 38.0 | -10.95 | 7.50 | 0.20 | 5.42 | 4 | |
| BRHT5 | 5 | 8 | 54.6 | -68 | 45 | 16.8 | -7.28 | 8.20 | 0.10 | 4.28 | 3 | H88-159 |
| BSDL734 | 5 | 9 | 13.3 | -69 | 16 | 57.6 | -4.10 | 9.25 | 0.05 | 3.80 | 3 | |
| SL268 | 5 | 9 | 14.8 | -69 | 35 | 16.0 | -7.02 | 9.20 | 0.30 | 4.92 | 3 | |
| NGC1854 | 5 | 9 | 20.3 | -68 | 50 | 55.0 | -8.70 | 8.05 | 0.05 | 4.75 | 3 | |
| NGC1852 | 5 | 9 | 23.0 | -67 | 46 | 42.0 | -6.49 | 9.12 | 0.05 | 4.51 | 4 | |
| NGC1856 | 5 | 9 | 31.5 | -69 | 7 | 46.0 | -10.39 | 8.12 | 0.30 | 5.25 | 4 | |
| NGC1849 | 5 | 9 | 34.0 | -66 | 18 | 59.0 | -5.85 | 8.30 | 0.20 | 3.78 | 1 | |
| BSDL767 | 5 | 9 | 43.3 | -70 | 18 | 34.9 | -5.47 | 8.51 | 0.26 | 3.77 | 2 | |
| HS141 | 5 | 9 | 49.3 | -69 | 5 | 3.1 | -5.01 | 9.00 | 0.10 | 3.92 | 3 | |
| SL276 | 5 | 9 | 58.0 | -69 | 21 | 11.0 | -6.17 | 8.90 | 0.08 | 4.32 | 3 | |
| OGLE-LMC0169 | 5 | 10 | 6.1 | -69 | 5 | 19.6 | -6.32 | 8.25 | 0.05 | 3.93 | 2 | |
| SL282 | 5 | 10 | 10.9 | -70 | 22 | 33.3 | -4.52 | 9.13 | 0.10 | 3.71 | 2 | KMHK619 |
| SL278 | 5 | 10 | 16.0 | -68 | 29 | 30.8 | -5.53 | 8.40 | 0.40 | 3.72 | 1 | |
| KMK88-32 | 5 | 10 | 20.0 | -68 | 52 | 45.0 | -5.58 | 8.50 | 0.10 | 3.81 | 3 | H88-178 |
| Name | RA | DEC | age | age | M | Data | Alternative | |||||
|---|---|---|---|---|---|---|---|---|---|---|---|---|
| [J2000] | [J2000] | [yr] | [yr] | [M⊙] | Source | Name | ||||||
| NGC1861 | 5 | 10 | 21.9 | -70 | 46 | 44.2 | -5.97 | 8.79 | 0.11 | 4.16 | 2 | |
| HS153 | 5 | 10 | 30.0 | -68 | 52 | 21.0 | -5.84 | 8.55 | 0.10 | 3.95 | 3 | BRHT48 |
| SL291 | 5 | 10 | 30.5 | -70 | 54 | 36.2 | -5.54 | 8.72 | 0.11 | 3.94 | 2 | KMHK626 |
| NGC1860 | 5 | 10 | 38.9 | -68 | 45 | 12.0 | -8.88 | 8.28 | 0.30 | 4.30 | 4 | |
| SL288 | 5 | 10 | 39.4 | -69 | 2 | 28.6 | -6.94 | 7.65 | 0.05 | 3.81 | 3 | |
| SL294 | 5 | 10 | 42.2 | -70 | 3 | 46.8 | -5.89 | 8.28 | 0.30 | 3.78 | 2 | KMHK627 |
| SL296 | 5 | 10 | 56.7 | -69 | 33 | 31.1 | -5.86 | 8.85 | 0.05 | 4.15 | 3 | |
| NGC1859 | 5 | 11 | 31.0 | -65 | 14 | 57.1 | -6.31 | 8.10 | 0.20 | 3.82 | 1 | |
| NGC1863 | 5 | 11 | 39.0 | -68 | 43 | 48.0 | -7.91 | 7.80 | 0.40 | 4.28 | 1 | |
| SL304 | 5 | 12 | 1.0 | -69 | 12 | 1.0 | -6.76 | 8.40 | 0.10 | 4.21 | 3 | |
| KMK88-38 | 5 | 12 | 9.3 | -68 | 54 | 40.6 | -4.40 | 9.10 | 0.05 | 3.71 | 3 | H88-206 |
| NGC1865 | 5 | 12 | 25.0 | -68 | 46 | 23.0 | -6.65 | 8.80 | 0.05 | 4.44 | 3 | |
| BSDL880 | 5 | 12 | 27.6 | -69 | 33 | 13.8 | -4.68 | 9.10 | 0.05 | 3.83 | 3 | |
| KMK88-40 | 5 | 12 | 34.0 | -69 | 17 | 11.0 | -7.66 | 7.20 | 0.60 | 3.79 | 1 | |
| KMK88-42 | 5 | 12 | 50.2 | -68 | 51 | 51.2 | -6.34 | 8.20 | 0.05 | 3.91 | 3 | H88-216 |
| NGC1878 | 5 | 12 | 50.7 | -70 | 28 | 20.2 | -6.00 | 8.54 | 0.03 | 4.01 | 2 | |
| HS177 | 5 | 13 | 3.5 | -69 | 3 | 1.7 | -4.48 | 9.25 | 0.05 | 3.95 | 3 | |
| NGC1870 | 5 | 13 | 10.0 | -69 | 7 | 1.0 | -7.49 | 8.15 | 0.05 | 4.33 | 3 | |
| NGC1872 | 5 | 13 | 11.0 | -69 | 18 | 43.0 | -8.05 | 8.70 | 0.10 | 4.93 | 3 | |
| NGC1866 | 5 | 13 | 38.9 | -65 | 27 | 52.0 | -9.98 | 8.12 | 0.30 | 4.63 | 4 | |
| BSDL946 | 5 | 13 | 57.5 | -68 | 42 | 52.1 | -5.67 | 9.13 | 0.06 | 4.17 | 2 | |
| NGC1868 | 5 | 14 | 36.2 | -63 | 57 | 14.0 | -7.58 | 8.74 | 0.30 | 4.53 | 4 | |
| HS190 | 5 | 14 | 47.0 | -69 | 27 | 22.0 | -5.44 | 9.44 | 0.35 | 4.51 | 2 | |
| HS186 | 5 | 14 | 49.0 | -66 | 11 | 1.0 | -4.84 | 8.80 | 0.60 | 3.71 | 1 | |
| HS191 | 5 | 14 | 51.0 | -69 | 25 | 39.5 | -4.58 | 8.95 | 0.10 | 3.71 | 3 | |
| BSDL985 | 5 | 14 | 53.0 | -66 | 3 | 33.8 | -5.15 | 8.60 | 0.60 | 3.71 | 1 | |
| NGC1885 | 5 | 15 | 6.0 | -68 | 58 | 45.0 | -7.32 | 8.30 | 0.03 | 4.37 | 3 | |
| NGC1894 | 5 | 15 | 51.0 | -69 | 28 | 9.0 | -7.96 | 8.05 | 0.05 | 4.45 | 3 | |
| NGC1887 | 5 | 16 | 4.0 | -66 | 19 | 9.1 | -6.13 | 8.10 | 0.20 | 3.75 | 1 | |
| BSDL1102 | 5 | 16 | 37.4 | -70 | 12 | 38.9 | -4.12 | 9.21 | 0.11 | 3.77 | 2 | |
| SL352 | 5 | 16 | 41.6 | -70 | 32 | 27.0 | -5.80 | 8.61 | 0.03 | 3.97 | 2 | KMHK715 |
| NGC1898 | 5 | 16 | 42.4 | -69 | 39 | 25.0 | -7.82 | 10.15 | 0.07 | 5.88 | 4 | |
| SL349 | 5 | 16 | 55.1 | -68 | 52 | 36.2 | -5.38 | 8.85 | 0.05 | 3.96 | 3 | BRHT33 |
| H1 | 5 | 17 | 8.4 | -68 | 52 | 27.0 | -6.82 | 9.20 | 0.10 | 4.84 | 3 | SL353, BRHT33 |
| NGC1903 | 5 | 17 | 22.0 | -69 | 20 | 17.0 | -9.28 | 8.08 | 0.03 | 5.00 | 3 | |
| SL357 | 5 | 17 | 27.0 | -69 | 22 | 35.0 | -6.59 | 9.20 | 0.08 | 4.75 | 3 | BRHT9 |
| SL358 | 5 | 17 | 34.0 | -69 | 30 | 51.0 | -6.03 | 8.70 | 0.05 | 4.12 | 3 | |
| HS211 | 5 | 17 | 38.0 | -68 | 58 | 30.4 | -5.01 | 8.70 | 0.10 | 3.71 | 3 | |
| H2 | 5 | 17 | 49.2 | -69 | 38 | 38.6 | -7.06 | 9.25 | 0.10 | 4.98 | 3 | SL363 |
| HS213 | 5 | 17 | 56.2 | -69 | 34 | 56.2 | -5.79 | 8.30 | 0.07 | 3.76 | 3 | |
| BRHT10 | 5 | 18 | 10.7 | -69 | 32 | 25.4 | -5.87 | 8.20 | 0.10 | 3.72 | 3 | H88-264 |
| NGC1902 | 5 | 18 | 17.0 | -66 | 37 | 37.9 | -7.24 | 8.00 | 0.20 | 4.13 | 1 | |
| NGC1913 | 5 | 18 | 19.1 | -69 | 32 | 13.7 | -7.55 | 7.58 | 0.03 | 4.01 | 3 | |
| NGC1916 | 5 | 18 | 37.5 | -69 | 24 | 25.0 | -8.93 | 10.20 | 0.09 | 5.79 | 4 | |
| H88-269 | 5 | 18 | 41.7 | -69 | 4 | 46.5 | -4.98 | 9.00 | 0.10 | 3.91 | 3 | |
| HS223A | 5 | 18 | 52.4 | -69 | 22 | 15.2 | -5.15 | 9.10 | 0.05 | 4.02 | 3 | |
| NGC1917 | 5 | 19 | 2.0 | -69 | 0 | 4.0 | -6.17 | 9.11 | 0.05 | 4.42 | 4 | |
| HS227 | 5 | 19 | 4.0 | -69 | 48 | 39.0 | -5.16 | 9.00 | 0.03 | 3.99 | 3 | |
| NGC1921 | 5 | 19 | 23.8 | -69 | 47 | 16.2 | -5.95 | 8.30 | 0.10 | 3.82 | 3 | |
| SL385 | 5 | 19 | 26.3 | -69 | 32 | 25.2 | -6.63 | 8.50 | 0.05 | 4.23 | 3 | BRHT35 |
| SL387 | 5 | 19 | 33.7 | -69 | 32 | 31.7 | -6.41 | 9.00 | 0.10 | 4.49 | 3 | BRHT35 |
| NGC1922 | 5 | 19 | 50.0 | -69 | 30 | 1.0 | -7.74 | 7.35 | 0.10 | 3.92 | 3 | |
| SL390 | 5 | 19 | 54.3 | -68 | 57 | 50.4 | -5.92 | 9.20 | 0.03 | 4.48 | 3 | |
| SL397 | 5 | 20 | 12.0 | -68 | 54 | 15.1 | -6.67 | 7.80 | 0.20 | 3.79 | 1 | |
| SL402 | 5 | 20 | 23.6 | -69 | 35 | 6.3 | -6.53 | 8.50 | 0.07 | 4.19 | 3 | |
| H88-281 | 5 | 20 | 26.0 | -69 | 15 | 8.8 | -5.81 | 8.27 | 0.22 | 3.74 | 2 | |
| NGC1926 | 5 | 20 | 35.0 | -69 | 31 | 27.8 | -7.76 | 8.20 | 0.10 | 4.47 | 3 | |
| NGC1928 | 5 | 20 | 57.5 | -69 | 28 | 41.6 | -6.83 | 9.23 | 0.05 | 4.87 | 3 | |
| BSDL1334 | 5 | 21 | 14.0 | -68 | 47 | 0.0 | -3.72 | 9.48 | 0.41 | 3.86 | 2 | |
| NGC1938 | 5 | 21 | 25.4 | -69 | 56 | 23.3 | -5.90 | 8.75 | 0.05 | 4.10 | 3 | |
| NGC1939 | 5 | 21 | 27.1 | -69 | 57 | 1.3 | -7.43 | 9.20 | 0.10 | 5.08 | 3 | |
| SL410 | 5 | 21 | 45.0 | -65 | 13 | 55.9 | -6.36 | 8.05 | 0.20 | 3.81 | 1 | |
| SL418 | 5 | 21 | 49.5 | -69 | 39 | 6.9 | -6.47 | 8.40 | 0.20 | 4.10 | 3 | |
| Name | RA | DEC | age | age | M | Data | Alternative | |||||
|---|---|---|---|---|---|---|---|---|---|---|---|---|
| [J2000] | [J2000] | [yr] | [yr] | [M⊙] | Source | Name | ||||||
| NGC1944 | 5 | 21 | 57.0 | -72 | 29 | 39.0 | -6.66 | 7.84 | 0.05 | 3.81 | 4 | |
| SL419 | 5 | 22 | 3.4 | -69 | 15 | 18.3 | -6.39 | 8.55 | 0.05 | 4.17 | 3 | |
| SL423 | 5 | 22 | 13.3 | -69 | 30 | 48.8 | -6.30 | 8.40 | 0.10 | 4.03 | 3 | |
| SL425 | 5 | 22 | 25.0 | -68 | 47 | 6.0 | -6.21 | 8.20 | 0.40 | 3.85 | 1 | |
| NGC1932 | 5 | 22 | 26.0 | -66 | 9 | 9.0 | -6.85 | 8.10 | 0.20 | 4.04 | 1 | |
| NGC1943 | 5 | 22 | 29.5 | -70 | 9 | 14.9 | -7.25 | 8.35 | 0.05 | 4.38 | 3 | |
| NGC1940 | 5 | 22 | 43.0 | -67 | 11 | 10.0 | -6.50 | 8.00 | 0.20 | 3.83 | 1 | |
| HS259 | 5 | 22 | 45.7 | -69 | 50 | 49.5 | -7.18 | 8.14 | 0.02 | 4.20 | 2 | |
| SL434 | 5 | 23 | 25.6 | -69 | 1 | 18.2 | -5.07 | 8.70 | 0.20 | 3.74 | 2 | |
| SL453 | 5 | 25 | 1.9 | -69 | 26 | 7.4 | -7.01 | 8.50 | 0.05 | 4.38 | 3 | |
| SL461 | 5 | 25 | 19.0 | -71 | 48 | 11.2 | -5.05 | 8.70 | 0.40 | 3.73 | 1 | |
| NGC1953 | 5 | 25 | 26.0 | -68 | 50 | 17.9 | -6.87 | 7.90 | 0.20 | 3.93 | 1 | |
| NGC1951 | 5 | 26 | 4.0 | -66 | 35 | 49.9 | -7.82 | 7.70 | 0.20 | 4.18 | 1 | |
| BSDL1657 | 5 | 26 | 5.0 | -67 | 10 | 57.0 | -6.33 | 8.00 | 0.20 | 3.77 | 1 | |
| KMHK898 | 5 | 26 | 24.0 | -68 | 2 | 48.1 | -5.59 | 9.12 | 0.03 | 4.16 | 2 | |
| HS301A | 5 | 26 | 38.0 | -71 | 58 | 50.2 | -6.46 | 7.90 | 0.20 | 3.76 | 1 | |
| NGC1967 | 5 | 26 | 43.0 | -69 | 6 | 5.0 | -7.62 | 7.20 | 0.20 | 3.78 | 1 | |
| NGC1987 | 5 | 27 | 17.0 | -70 | 44 | 8.0 | -6.76 | 9.03 | 0.05 | 4.65 | 4 | |
| SL482 | 5 | 27 | 17.0 | -66 | 22 | 7.0 | -7.47 | 7.60 | 0.20 | 3.99 | 1 | |
| NGC2000 | 5 | 27 | 29.0 | -71 | 52 | 48.0 | -6.62 | 8.00 | 0.20 | 3.88 | 1 | |
| NGC1984 | 5 | 27 | 40.0 | -69 | 8 | 3.1 | -9.11 | 7.80 | 0.20 | 4.76 | 1 | |
| SL492 | 5 | 27 | 43.0 | -68 | 59 | 8.2 | -7.47 | 7.70 | 0.20 | 4.04 | 1 | |
| SL495 | 5 | 28 | 3.0 | -68 | 48 | 42.1 | -7.59 | 7.40 | 0.20 | 3.89 | 1 | |
| NGC1994 | 5 | 28 | 21.0 | -69 | 8 | 30.1 | -7.02 | 7.70 | 0.40 | 3.86 | 1 | |
| HS314 | 5 | 28 | 26.0 | -68 | 58 | 55.9 | -7.30 | 7.30 | 0.40 | 3.70 | 1 | |
| KMHK945 | 5 | 28 | 27.4 | -68 | 38 | 59.4 | -5.27 | 9.08 | 0.25 | 4.06 | 2 | |
| SL498 | 5 | 28 | 34.0 | -67 | 13 | 30.0 | -7.15 | 7.45 | 0.12 | 3.75 | 2 | KMHK943 |
| HODGE14 | 5 | 28 | 39.3 | -73 | 37 | 49.0 | -5.95 | 9.26 | 0.10 | 4.33 | 4 | |
| NGC1978 | 5 | 28 | 45.0 | -66 | 14 | 10.0 | -7.80 | 9.30 | 0.05 | 5.33 | 4 | |
| HS319 | 5 | 28 | 47.6 | -68 | 59 | 1.4 | -6.02 | 8.32 | 0.41 | 3.86 | 2 | BRHT52a |
| SL503 | 5 | 29 | 0.2 | -68 | 25 | 8.0 | -5.47 | 8.56 | 0.42 | 3.81 | 2 | KMHK952 |
| SL502 | 5 | 29 | 10.0 | -66 | 35 | 29.0 | -8.37 | 7.60 | 0.20 | 4.35 | 1 | |
| BSDL1938 | 5 | 29 | 19.0 | -69 | 0 | 20.9 | -7.16 | 7.60 | 0.20 | 3.87 | 1 | |
| OGLE-LMC0531 | 5 | 30 | 2.1 | -69 | 31 | 36.2 | -4.24 | 9.30 | 0.05 | 3.91 | 3 | |
| NGC2005 | 5 | 30 | 10.3 | -69 | 45 | 9.0 | -13.12 | 10.22 | 0.14 | 5.49 | 4 | |
| NGC2002 | 5 | 30 | 21.0 | -66 | 53 | 2.0 | -8.57 | 7.10 | 0.20 | 4.05 | 1 | |
| ESO86SC2 | 5 | 30 | 22.0 | -65 | 54 | 32.0 | -7.39 | 7.50 | 0.20 | 3.88 | 1 | |
| BSDL2001 | 5 | 30 | 25.4 | -67 | 13 | 17.9 | -6.74 | 7.81 | 0.18 | 3.82 | 2 | |
| NGC2010 | 5 | 30 | 35.0 | -70 | 49 | 11.0 | -6.78 | 8.19 | 0.05 | 4.07 | 4 | |
| NGC2004 | 5 | 30 | 40.9 | -67 | 17 | 9.0 | -9.62 | 7.30 | 0.20 | 4.43 | 4 | |
| NGC2003 | 5 | 30 | 53.0 | -66 | 27 | 59.0 | -7.78 | 7.40 | 0.20 | 3.97 | 1 | |
| SL539 | 5 | 30 | 55.0 | -70 | 41 | 42.0 | -7.89 | 7.40 | 0.20 | 4.01 | 1 | |
| NGC2009 | 5 | 30 | 58.0 | -69 | 11 | 3.1 | -7.60 | 7.50 | 0.20 | 3.96 | 1 | |
| SL543 | 5 | 30 | 59.0 | -71 | 53 | 35.9 | -6.38 | 7.90 | 0.20 | 3.73 | 1 | |
| KMHK1022 | 5 | 31 | 7.0 | -71 | 57 | 45.0 | -6.68 | 8.30 | 0.60 | 4.11 | 1 | |
| SL538 | 5 | 31 | 17.0 | -66 | 57 | 28.1 | -7.92 | 7.40 | 0.20 | 4.03 | 1 | |
| NGC2006 | 5 | 31 | 19.0 | -66 | 58 | 22.1 | -7.81 | 7.60 | 0.20 | 4.13 | 1 | |
| NGC2019 | 5 | 31 | 56.6 | -70 | 9 | 33.0 | -12.97 | 10.25 | 0.08 | 5.68 | 4 | |
| BSDL2180 | 5 | 32 | 1.0 | -66 | 50 | 57.1 | -5.01 | 8.70 | 0.60 | 3.71 | 1 | |
| HS346 | 5 | 32 | 3.0 | -69 | 22 | 10.0 | -6.11 | 8.22 | 0.20 | 3.82 | 2 | |
| SL558 | 5 | 32 | 11.9 | -69 | 29 | 41.1 | -5.66 | 8.40 | 0.10 | 3.77 | 3 | |
| KMHK1047 | 5 | 32 | 18.0 | -68 | 52 | 28.0 | -6.59 | 7.74 | 0.19 | 3.72 | 2 | |
| BRHT14b | 5 | 32 | 19.0 | -67 | 31 | 40.1 | -7.25 | 7.50 | 0.20 | 3.82 | 1 | |
| NGC2011 | 5 | 32 | 19.0 | -67 | 31 | 16.0 | -7.66 | 7.40 | 0.20 | 3.92 | 1 | |
| HODGE4 | 5 | 32 | 25.2 | -64 | 44 | 11.0 | -9.29 | 9.34 | 0.10 | 5.39 | 4 | |
| NGC2025 | 5 | 32 | 33.0 | -71 | 43 | 0.8 | -7.36 | 7.95 | 0.20 | 4.15 | 1 | |
| BSDL2300 | 5 | 33 | 19.0 | -68 | 53 | 32.0 | -5.86 | 9.47 | 0.03 | 4.70 | 2 | |
| SL569 | 5 | 33 | 20.4 | -68 | 9 | 9.9 | -5.83 | 9.08 | 0.01 | 4.29 | 2 | KMHK1065 |
| NGC2031 | 5 | 33 | 41.1 | -70 | 59 | 13.0 | -8.98 | 8.20 | 0.10 | 5.13 | 4 | |
| SL582 | 5 | 34 | 28.0 | -67 | 7 | 28.9 | -7.23 | 7.90 | 0.20 | 4.07 | 1 | |
| HS358 | 5 | 34 | 35.0 | -66 | 3 | 56.2 | -6.05 | 8.30 | 0.20 | 3.86 | 1 | |
| KMHK1098 | 5 | 34 | 40.0 | -67 | 30 | 13.0 | -6.95 | 7.50 | 0.20 | 3.70 | 1 | |
| SL588 | 5 | 34 | 40.3 | -68 | 18 | 18.5 | -5.46 | 8.70 | 0.10 | 3.89 | 2 | KMHK1101 |
| Name | RA | DEC | age | age | M | Data | Alternative | |||||
|---|---|---|---|---|---|---|---|---|---|---|---|---|
| [J2000] | [J2000] | [yr] | [yr] | [M⊙] | Source | Name | ||||||
| SL586 | 5 | 34 | 43.0 | -66 | 57 | 45.0 | -7.03 | 7.60 | 0.20 | 3.81 | 1 | |
| HS359 | 5 | 34 | 45.5 | -69 | 23 | 18.4 | -5.98 | 9.02 | 0.04 | 4.33 | 2 | |
| KMHK1112 | 5 | 35 | 16.6 | -68 | 52 | 13.9 | -3.77 | 9.38 | 0.11 | 3.78 | 2 | |
| NGC2030 | 5 | 35 | 39.0 | -66 | 1 | 50.2 | -6.32 | 8.00 | 0.60 | 3.76 | 1 | |
| HDE269828 | 5 | 36 | 0.4 | -69 | 11 | 50.5 | -7.97 | 7.18 | 0.09 | 3.90 | 2 | |
| NGC2051 | 5 | 36 | 7.0 | -71 | 0 | 42.1 | -6.92 | 8.00 | 0.40 | 4.00 | 1 | |
| LT-delta | 5 | 36 | 10.0 | -69 | 11 | 46.0 | -7.94 | 7.30 | 0.20 | 3.96 | 1 | |
| NGC2041 | 5 | 36 | 28.0 | -66 | 59 | 26.2 | -8.52 | 7.40 | 0.40 | 4.27 | 1 | |
| SL607 | 5 | 36 | 31.4 | -68 | 48 | 44.6 | -5.66 | 8.59 | 0.07 | 3.90 | 2 | KMHK1137 |
| NGC2056 | 5 | 36 | 34.0 | -70 | 40 | 18.0 | -6.73 | 8.40 | 0.05 | 4.20 | 4 | |
| NGC2053 | 5 | 37 | 40.5 | -67 | 24 | 51.4 | -6.46 | 8.09 | 0.27 | 3.87 | 2 | |
| IC2146 | 5 | 37 | 46.0 | -74 | 46 | 58.0 | -6.09 | 9.19 | 0.05 | 4.51 | 4 | |
| M-OB1 | 5 | 38 | 16.0 | -69 | 3 | 58.0 | -7.76 | 7.40 | 0.20 | 3.96 | 1 | |
| SL629 | 5 | 38 | 22.0 | -68 | 46 | 50.7 | -4.45 | 9.31 | 0.02 | 4.00 | 2 | KMHK1169 |
| SL628 | 5 | 38 | 30.0 | -67 | 19 | 57.0 | -6.44 | 8.30 | 0.15 | 4.02 | 2 | KMHK1166 |
| BSDL2652 | 5 | 38 | 31.1 | -68 | 8 | 23.0 | -3.93 | 9.24 | 0.11 | 3.73 | 2 | |
| KMHK1188 | 5 | 39 | 30.0 | -68 | 19 | 21.0 | -4.08 | 9.48 | 0.02 | 4.00 | 2 | |
| NGC2091 | 5 | 40 | 58.0 | -69 | 26 | 11.0 | -6.95 | 7.70 | 0.40 | 3.84 | 1 | |
| NGC2088 | 5 | 40 | 58.0 | -68 | 27 | 52.9 | -6.32 | 7.90 | 0.20 | 3.71 | 1 | |
| BSDL2794 | 5 | 41 | 10.0 | -69 | 10 | 44.0 | -5.55 | 9.07 | 0.24 | 4.18 | 2 | |
| NGC2093 | 5 | 41 | 49.0 | -68 | 55 | 15.0 | -7.22 | 7.48 | 0.15 | 3.80 | 2 | |
| KMHK1244 | 5 | 42 | 0.0 | -67 | 20 | 34.1 | -6.79 | 7.90 | 0.20 | 3.90 | 1 | |
| NGC2100 | 5 | 42 | 8.6 | -69 | 12 | 44.0 | -9.93 | 7.20 | 0.20 | 4.48 | 4 | |
| NGC2096 | 5 | 42 | 16.0 | -68 | 27 | 29.9 | -7.51 | 7.50 | 0.20 | 3.93 | 1 | |
| SL663 | 5 | 42 | 28.8 | -65 | 21 | 44.0 | -7.58 | 9.51 | 0.06 | 5.23 | 4 | |
| NGC2098 | 5 | 42 | 29.0 | -68 | 16 | 28.9 | -7.78 | 7.60 | 0.20 | 4.11 | 1 | |
| NGC2108 | 5 | 43 | 56.0 | -69 | 10 | 50.0 | -6.18 | 9.01 | 0.05 | 4.40 | 4 | |
| NGC2105 | 5 | 44 | 19.0 | -66 | 55 | 4.1 | -6.23 | 8.20 | 0.20 | 3.86 | 1 | |
| NGC2109 | 5 | 44 | 22.0 | -68 | 32 | 48.1 | -6.58 | 8.20 | 0.40 | 4.00 | 1 | |
| BM32 | 5 | 44 | 49.0 | -67 | 19 | 43.0 | -6.67 | 7.90 | 0.20 | 3.85 | 1 | |
| SL714 | 5 | 47 | 16.0 | -66 | 52 | 59.2 | -5.28 | 8.60 | 0.40 | 3.76 | 1 | |
| NGC2117 | 5 | 47 | 46.0 | -67 | 27 | 2.9 | -6.70 | 7.80 | 0.20 | 3.80 | 1 | |
| NGC2121 | 5 | 48 | 11.6 | -71 | 28 | 51.0 | -7.85 | 9.51 | 0.06 | 5.69 | 4 | |
| HODGE7 | 5 | 50 | 3.0 | -67 | 43 | 5.0 | -6.24 | 9.17 | 0.05 | 4.47 | 4 | |
| SL748 | 5 | 50 | 15.0 | -70 | 25 | 40.1 | -5.85 | 8.40 | 0.40 | 3.85 | 1 | |
| BM112 | 5 | 50 | 21.0 | -68 | 39 | 27.0 | -5.64 | 8.40 | 0.60 | 3.77 | 1 | |
| LW318 | 5 | 50 | 43.0 | -65 | 18 | 14.0 | -6.48 | 8.10 | 0.20 | 3.89 | 1 | |
| NGC2127 | 5 | 51 | 22.0 | -69 | 21 | 38.9 | -6.90 | 7.90 | 0.20 | 3.94 | 1 | |
| NGC2133 | 5 | 51 | 28.0 | -71 | 10 | 28.9 | -6.30 | 8.20 | 0.20 | 3.89 | 1 | |
| NGC2123 | 5 | 51 | 43.0 | -65 | 19 | 17.0 | -6.01 | 8.20 | 0.20 | 3.77 | 1 | |
| NGC2134 | 5 | 51 | 55.0 | -71 | 5 | 51.0 | -7.71 | 7.40 | 0.40 | 3.94 | 1 | |
| NGC2130 | 5 | 52 | 22.0 | -67 | 20 | 2.0 | -6.31 | 7.90 | 0.40 | 3.70 | 1 | |
| NGC2136 | 5 | 52 | 58.0 | -69 | 29 | 36.0 | -8.62 | 8.00 | 0.10 | 4.45 | 4 | |
| HS445 | 5 | 53 | 49.0 | -67 | 23 | 8.9 | -6.77 | 8.30 | 0.20 | 4.15 | 1 | |
| NGC2145 | 5 | 54 | 22.0 | -70 | 54 | 4.0 | -6.27 | 8.30 | 0.20 | 3.95 | 1 | |
| NGC2157 | 5 | 57 | 32.4 | -69 | 11 | 49.0 | -9.09 | 7.60 | 0.20 | 4.31 | 4 | |
| NGC2154 | 5 | 57 | 38.0 | -67 | 15 | 43.0 | -6.71 | 9.15 | 0.05 | 4.57 | 4 | |
| NGC2156 | 5 | 57 | 45.0 | -68 | 27 | 38.2 | -7.17 | 7.90 | 0.20 | 4.05 | 1 | |
| NGC2153 | 5 | 57 | 51.2 | -66 | 23 | 58.0 | -5.58 | 9.11 | 0.14 | 3.97 | 4 | |
| NGC2159 | 5 | 57 | 57.0 | -68 | 37 | 26.0 | -7.10 | 8.00 | 0.20 | 4.08 | 1 | |
| NGC2173 | 5 | 57 | 58.5 | -72 | 58 | 40.0 | -7.33 | 9.33 | 0.08 | 5.06 | 4 | |
| NGC2160 | 5 | 58 | 11.0 | -68 | 17 | 24.0 | -6.30 | 8.00 | 0.20 | 3.75 | 1 | |
| NGC2155 | 5 | 58 | 33.3 | -65 | 28 | 35.0 | -6.68 | 9.51 | 0.06 | 4.90 | 4 | |
| NGC2164 | 5 | 58 | 55.9 | -68 | 31 | 0.0 | -8.61 | 7.70 | 0.20 | 4.12 | 4 | |
| NGC2172 | 6 | 0 | 4.0 | -68 | 38 | 12.8 | -6.80 | 7.90 | 0.20 | 3.90 | 1 | |
| NGC2162 | 6 | 0 | 30.4 | -63 | 43 | 19.0 | -6.33 | 9.11 | 0.14 | 4.40 | 4 | |
| NGC2190 | 6 | 1 | 2.0 | -74 | 43 | 33.0 | -5.56 | 9.04 | 0.05 | 4.17 | 4 | |
| SL822 | 6 | 2 | 5.0 | -68 | 20 | 8.2 | -5.45 | 8.80 | 0.60 | 3.96 | 1 | |
| NGC2203 | 6 | 4 | 42.0 | -75 | 26 | 16.0 | -7.21 | 9.26 | 0.05 | 5.05 | 4 | |
| NGC2193 | 6 | 6 | 17.0 | -65 | 5 | 54.0 | -6.23 | 9.34 | 0.10 | 4.42 | 4 | |
| SL842 | 6 | 8 | 14.9 | -62 | 59 | 15.0 | -5.34 | 9.30 | 0.09 | 4.08 | 4 | |
| NGC2209 | 6 | 8 | 34.8 | -73 | 50 | 12.0 | -7.90 | 8.98 | 0.19 | 5.03 | 4 | |
| NGC2213 | 6 | 10 | 42.2 | -71 | 31 | 46.0 | -6.48 | 9.20 | 0.11 | 4.56 | 4 | |
| Name | RA | DEC | age | age | M | Data | Alternative | |||||
|---|---|---|---|---|---|---|---|---|---|---|---|---|
| [J2000] | [J2000] | [yr] | [yr] | [M⊙] | Source | Name | ||||||
| SL855 | 6 | 10 | 53.7 | -65 | 2 | 30.0 | -5.01 | 9.13 | 0.30 | 4.58 | 4 | |
| NGC2210 | 6 | 11 | 31.5 | -69 | 7 | 17.0 | -8.00 | 10.20 | 0.01 | 5.48 | 4 | |
| NGC2214 | 6 | 12 | 55.8 | -68 | 15 | 38.0 | -8.41 | 7.60 | 0.20 | 4.50 | 4 | |
| LW431 | 6 | 13 | 27.0 | -70 | 41 | 42.0 | -4.83 | 9.18 | 0.05 | 3.94 | 4 | |
| HODGE11 | 6 | 14 | 22.3 | -69 | 50 | 50.0 | -7.50 | 10.18 | 0.01 | 5.63 | 4 | |
| NGC2231 | 6 | 20 | 42.7 | -67 | 31 | 10.0 | -7.03 | 9.18 | 0.11 | 5.18 | 4 | |
| NGC2241 | 6 | 22 | 53.0 | -68 | 55 | 30.0 | -5.25 | 9.28 | 0.05 | 4.29 | 4 | |
| NGC2249 | 6 | 25 | 49.8 | -68 | 55 | 13.0 | -6.73 | 8.82 | 0.30 | 4.35 | 4 | |
| NGC2257 | 6 | 30 | 12.1 | -64 | 19 | 42.0 | -7.06 | 10.20 | 0.10 | 5.41 | 4 | |