Pressure effects on superconducting properties of single-crystalline Co doped NaFeAs
Abstract
Resistivity and magnetic susceptibility measurements under external pressure were performed on single-crystals NaFe1-xCoxAs (x=0, 0.01, 0.028, 0.075, 0.109). The maximum enhanced by pressure in both underdoped and optimally doped NaFe1-xCoxAs is the same, as high as 31 K. The overdoped sample with x = 0.075 also shows a positive pressure effect on , and an enhancement of by 13 K is achieved under pressure of 2.3 GPa. All the superconducting samples show large positive pressure coefficient on superconductivity, being different from Ba(Fe1-xCox)2As2. However, the superconductivity cannot be induced by pressure in heavily overdoped non-superconducting NaFe0.891Co0.109As. These results provide evidence for that the electronic structure is much different between superconducting and heavily overdoped non-superconducting NaFe1-xCoxAs, being consistent with the observation by angle-resolved photoemission spectroscopy.
pacs:
74.25.-q, 74.25.Ha, 74.25.F-, 74.25.Dw, 74.70.DdI INTRODUCTION
Extensive experimental and theoretical efforts have been made to study the iron based superconductors since the discovery of superconductivity in F doped LaOFeAs.Hosono Most of the parent compounds of the iron based superconductors undergo structural and spin density wave (SDW) transitions. With doping or applying high pressure, both the structural and SDW transitions are suppressed and superconductivity emerges. The so called ”111”-type iron arsenide compound with the PbFCl structure, including LiFeAsWangXC and NaFeAsParker1 , has been regarded as a unique family which is superconducting without purposely doping or applying pressure. Although no long range antiferromagnetic order has been observed in LiFeAsBorisenko , NaFeAs is reported to undergo three successive phase transitions at around 52, 41, and 23 K, which correspond to structural, magnetic, and superconducting transition, respectively.ChenGF Although the resistivity of NaFeAs drops to zero at about 10K, it has been pointed out that the superconductivity is filamentary rather than a bulk phenomenon.DaiPC ; WangAF With substitution of Co on Fe site, both magnetism and the structural distortion are suppressed, and bulk superconductivity with zero resistivity up to 20 K can be achieved.Parker2 ; Wright Full shielding fraction and large specific heat jump can be observed in single-crystalline optimally doped NaFe0.972Co0.028As samples.WangAF
Applying pressure has been proved to be an effective method to enhance the superconductivity transition temperature in many types of iron arsenide superconductors. It was revealed that the of F-doped LaOFeAs was enhanced up to 43 K soon after the discovery of superconductivity in this system.Takahashi In tetragonal FeSe, increases from 8.5 K at ambient pressure to about 37 K under P = 8.9 GPa, which is the largest pressure effect reported in iron based superconductors so far.FeSepressure Pressure effects in electron doped 122-system Ba(Fe1-xCox)2As2 with different doping levels have been thoroughly studied. Applying pressure dramatically enhances in the underdoped regime, whereas, the effect of pressure on is rather small in the optimally doped and overdoped regimes.Ahilan ; Colombier For the ”111”-type Fe-pnictides, it is reported that the transition temperature of LiFeAs is suppressed linearly with pressureGooch , whereas, of Na1-xFeAs polycrystal can be enhanced up to 31 K at about 3 GPa.JinCQ This difference is attributed to the different ionic radius between Li and Na. However, in former high-pressure study the superconducting transition is rather broad due to the highly hygroscopic nature of polycrystalline NaFeAs sample. In order to study the intrinsic properties of this system, it is of great interest to investigate the combined effect of doping and pressure on superconducting properties of single-crystal samples. In this paper, we report the results of resistivity measurements under hydrostatic pressure for single-crystalline NaFe1-xCoxAs, tracking as a function of both pressure and doping level in different regions of the phase diagram. The initial slope of the pressure dependence of , (d/d)P=0, is positive in the whole superconducting doping regime of phase diagram. The value of pressure coefficient is comparably large among Fe-pnictides, even in the overdoped region. For the nonsuperconducting extremely overdoped sample, the pressure effect is negligible. as high as 31 K, generally consistent with the maximum under pressure in polycrystalline NaFeAs, can be reached in both underdoped and optimally doped samples. The identical maximum under pressure in different doping regions indicates that there is a universal maximum transition temperature of about 31 K in electron-doped NaFeAs, which can be obtain by applying high pressure or combined effect of pressure and doping.
II EXPERIMENTAL DETAILS
High-quality NaFe1-xCoxAs single crystals were grown by the conventional high temperature solution growth method using the NaAs self-flux technique. Details of the growth procedures were provided in our previous work.WangAF Electrical resistivity was measured using the ac four-probe method. Pressure was generated using a Be-Cu pressure cell with a Teflon cup which was filled with Daphene Oil 7373. The pressure applied in the resistivity measurement was determined by shift of the superconducting transition temperature of pure Sn.ZhangM The magnetic susceptibility was measured under pressure up to 6.1 GPa in a diamond anvil cell (DAC). The pressure transmitting medium was Daphene Oil 7373 and the pressure was measured at room temperature by ruby fluorescence spectroscopy. The resistivity measurements were performed using a Quantum Design physical properties measurement system (PPMS-9), and the magnetic susceptibility was measured using a superconducting quantum-interference device magnetometer (SQUID-MPMS-7T, ).
III RESULTS AND DISCUSSION
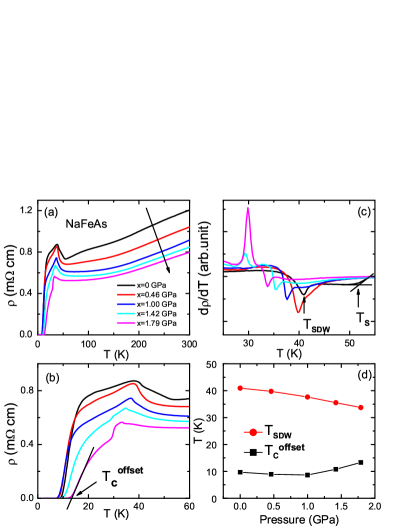
Fig. 1(a) shows the temperature dependence of resistivity for NaFeAs under different pressures. Two anomalies in the resistivity curve are observed at 51 K and 41 K under ambient pressure, which are consistent with previous reports.ChenGF These anomalies have been proved by neutron scattering experiment to arise from the structural and SDW transition, respectively.DaiPC With increasing pressure the anomalies corresponding to the SDW transition is gradually suppressed to lower temperature, whereas the structural transition quickly becomes undetectable. The suppression of the resistive anomalies can also be seen in the derivative of resistivity shown in Fig.1(c). We use the same criteria to infer the structural and SDW transitions from the resistivity as described in Ref.17, which has been confirmed by specific heat and magnetic susceptibility measurements.WangAF As shown in Fig.1(b), the superconducting transition is rather broad, and the three transitions take place in a narrow temperature range, thus it is difficult to define the . We use the criterion to describe the superconducting transition temperature in this paper, the definition of which is shown in Fig.1(b). With the applied pressure increasing, firstly decreases slightly, then increases quickly with pressure higher than 1 GPa. The highest we can achieve is 11.9 K at P = 1.79 GPa. The data of NaFeAs under pressure are summarized in Fig.1(d). The phase diagram T() is similar to that of underdoped Ba(Fe1-xCox)2As2Ahilan , in which is suppressed gradually while superconductivity is enhanced by applied pressure.
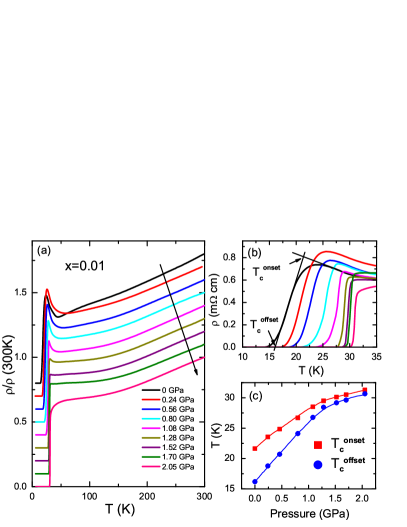
For the underdoped sample NaFe0.99Co0.01As with 16K, the kinks in resistivity curves associate with the structural and SDW transition are distinct at ambient pressure. Once the external pressure is applied, the kinks quickly become obscure and then indistinguishable, similar to the case in doped 122-system.Ahilan As shown in Fig.2(a), the low-temperature resistive upturn corresponding to the structural and/or magnetic transition are progressively suppressed, and ultimately vanished at P = 2.05 GPa, at which the highest superconducting transition temperature about 30.7 K is obtained. The criteria used to determine the onset and offset temperature of superconducting transition are shown in Fig 2(b). Since the onset temperature of superconductivity is ambiguous in NaFe1-xCoxAs, we write for for convenience hereafter. As reported in underdoped Ba(Fe1-xCox)2As2, the critical pressure at which the high temperature transition disappears coincides rather well with the pressure at which is highest and the superconducting transition is narrowest. Colombier The pressure coefficient d/d is 9.6 K/GPa below 1.28 GPa, and the pressure coefficient between ambient and the pressure at which reaches its maximum is 7.06 K/GPa, even larger than the pressure coefficient of FeSe (3.2 K GPa-1).FeSepressure The pressure effect coefficient based on the is about 4.7 K/GPa which is still relatively large in iron pnictides. In the phase diagram shown in figure 2(d), it is obvious that the superconducting transition width become narrower with increasing the pressure. The sharp superconducting transition observed at 2.05 GPa indicates that the pressure condition is still hydrostatic.
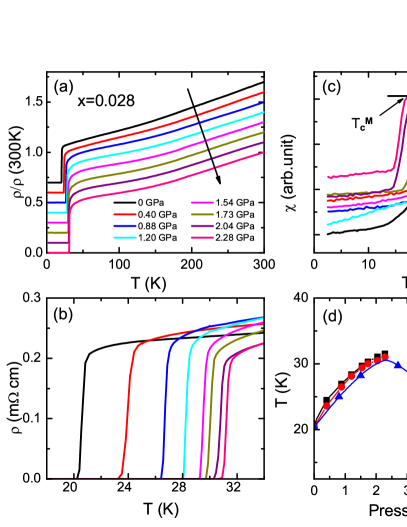
For the optimally doped sample NaFe0.972Co0.028As, the anomalies associated with the structural or SDW transition are suppressed completely by Co doping. As shown in Fig.3(a), measured by in-plane resistivity increases monotonously from 20.4 K to 31.0 K with increasing the applied pressure from zero to 2.28 GPa. The pressure coefficient is 4.67 K/GPa, much larger than 1 K/GPa in optimally doped Ba(Fe1-xCox)2As2Ahilan and comparable with 5 K/GPa in optimally doped LaFeAsO1-xFx.Takahashi In order to establish the complete superconducting dome in the phase diagram. We carried out the magnetic susceptibility measurement using the diamond anvil cell (DAC) technology. Pressures up to 6.1 GPa were applied on NaFe0.972Co0.028As single crystal. The values under various pressures are determined from the beginning of deviation from the extrapolated line of the normal state - curve as shown in Fig.3(c). Fig.3(d) displays the () phase diagram based on the resistivity and magnetic susceptibility measurements. The measured by DAC technology initially increases monotonously, and begins to decrease when pressure is higher than 2.3 GPa. The behavior of transition temperature obtained by resistivity and magnetic susceptibility are highly consistent with each other. The highest transition temperature obtained by our measurement is 31.0 K, where the transition width is 0.5 K which is considerably sharp. The = 31.0 K presented here is the highest in the 111 system up to now.
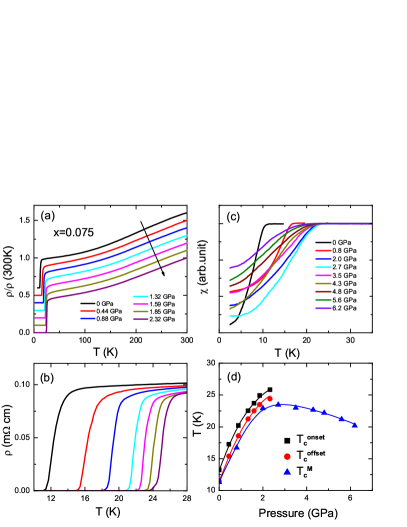
Fig.4(a) and Fig.4(c) display the pressure dependence of the in-plane resistivity and magnetic susceptibility of overdoped sample NaFe0.925Co0.075As, respectively. The superconducting transition temperature of this overdoped sample is 11.5 K at ambient pressure. Similar to the case in optimally doped NaFe0.972Co0.028As, the increases monotonously up to 24.5 K with increasing the applied pressure to 2.32 GPa. Domelike shape of () was revealed by magnetic susceptibility measurement, from which we can infer that the highest superconducting transition temperature in NaFe0.925Co0.075As is about 24.5 K with the uncertainty less than 1 K. A large enhancement of by 13 K, which is comparable to those in underdoped and optimally doped samples, is still exist in this overdoped composition. The pressure coefficient of NaFe0.925Co0.075As is 5.57 K/GPa, even higher than that of the optimally doped sample. The large pressure coefficient of overdoped NaFe0.925Co0.075As is obviously different from those in other iron-pnictide superconductors, which are rather small or change their sign from positive to negative in the overdoped regime in the phase diagram.Ahilan ; SmOFeAs ; Torikachvili ; KSr
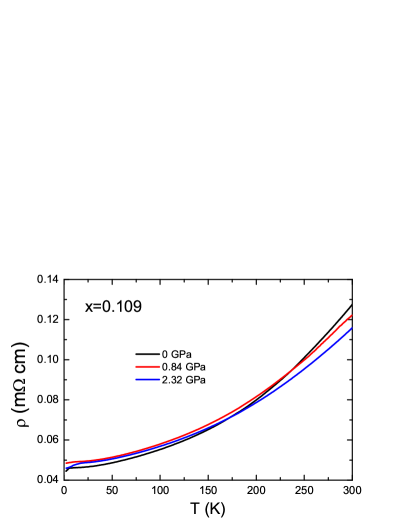
When external pressure was applied on the extremely overdoped sample NaFe0.891Co0.109As which shows no superconductivity down to 2 K at ambient pressure, we cannot observe the pressure-induced superconductivity with applied pressure up to 2.32 GPa. Besides, both the magnitude and the behavior of the resistivity do not change much with the applied pressure.
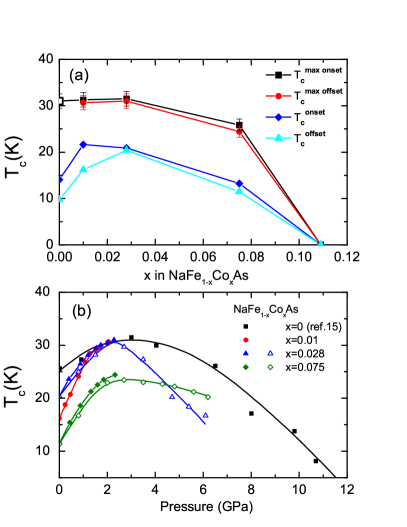
The effect of applied pressure on the superconducting transition temperature of NaFe1-xCoxAs is illustrated in Fig.6(a), where the maximum under pressure and at ambient pressure are plotted as a function of doping level . Because the maximum transition temperature has not been reached in undoped NaFeAs, we use the maximum value reported by Zhang . for this composition.JinCQ Large positive pressure coefficient d/d is observed in all the superconducting compositions, even in the overdoped regime. The maximum transition temperatures in NaFeAs, NaFe0.99Co0.01As and NaFe0.972Co0.028As are all around 31 K. () phase diagram of NaFe1-xCoxAs system for various is shown in Fig.6(b). It is obvious that the maximum transition temperature in undoped, underdoped and optimally doped sample is strikingly the same. These results indicate that there is a universal maximum transition temperature in NaFe1-xCoxAs of about 31 K, which can be achieved by applying a critical pressure of P = 2-3 GPa.
For the undoped and underdoped samples, applied external pressure suppresses the structural and SDW transitions, and enhances superconductivity simultaneously. This behavior is similar to the pressure effect in LaFeAsO1-xFx Takahashi and 122-systems.Alireza ; SrFe2As2pressure ; Ahilan ; Torikachvili Although the and normal state resistivity behavior evolve systematically with Co doping, the maximum transition temperature enhancement and corresponding critical pressure is nearly the same in all the superconducting samples. These properties are different from the case in most of the iron based superconductors that pressure effect is different in different regions of electronic phase diagram. An identical maximum of 31 K under doping as well as pressure has also been reported in BaFe2(As1-xPx)2.BaFe2As2P In the P doped Ba-122 system, phosphorous substitution could be regarded as chemical pressure, which changes Fe-Pn distance and causes similar effects on superconductivity to the physical pressure. Though the Co substitution in NaFeAs is referred to as electron doping, different from the replacement of As by P which is referred to as isovalent substitution, it is likely that the pressure-induced enhancement of in NaFe1-xCoxAs is also associated with the optimization of the structural parameters of FeAs layers, including the As-Fe-As bond angle and anion height.QLiu One possible reason for lower maximum transition temperature obtained in overdoped NaFe0.925Co0.075As single crystal is that the superconductivity is disturbed by the disorder or additional scattering induced by excess cobalt doping. This phenomenon is different from the case of overdoped LaFeAsO1-xFx, in which the conducting layer is not affected by F doping and the highest transition temperature acquired in optimal and overdoped samples are almost the same.Takahashi
The overdoped superconducting sample NaFe0.925Co0.075As
still has considerable positive pressure coefficient which is rare
in Fe-pnictide superconductors. However, when the pressure is
applied on the extremely overdoped non-superconducting sample, no
superconductivity induced by pressure can be observed. It has also
been reported that temperature linear dependent susceptibiltiy can
be observed in high temperatures for all the superconducting samples
and the breakdown of the temperature linear dependent susceptibility
in the overdoped region coinciding with the disappearance of
superconductivity.WangAF These phenomena indicate that there
is a sudden change in the electronic structure between the
superconducting compositions and the heavily overdoped
non-superconducting phase. This conclusion is supported by the
experimental results of STM investigationsWangYY and the
angle-resolved photoemission spectroscopy (ARPES)
studies.ZSun The STM study revealed that the high energy
spectra of superconducting NaFe1-xCoxAs remain
nearly the same, whereas, the high energy spectrum suddenly started
to shift to the lower energy substantially for the sample with x =
0.109. The direct measurements of the electronic structure of
NaFe1-xCoxAs by ARPES revealed that all the superconducting
NaFe1-xCoxAs compounds have similar band structures and
small relative Fermi level shifts. However, the x = 0.109 compound
in the heavily overdoped regime shows a large Fermi level shifts
(about 100 meV) relative to the optimally doped compounds, and its
band structure is significantly changed as the hole-like bands
around the zone center disappears and an electron pocket appears
instead, which means the consequent Fermi surface consists of
electron pockets only in this sample. The drastic change in
electronic structure for the heavily overdoped nonsuperconducting
samples could explain the observed properties of pressure effect.
IV Summary
In conclusion, we have performed resistivity and magnetic susceptibility measurements under various pressure on NaFe1-xCoxAs (x=0, 0.01, 0.028, 0.075, 0.109) single crystals. In the undoped and underdoped compounds, structural and SDW transitions are gradually suppressed while superconductivity is enhanced by applied external pressure. A universal maximum transition temperature of about 31 K under external pressure is observed in underdoped and optimally doped NaFe1-xCoxAs. The superconducting transition temperature of NaFe1-xCoxAs is strongly enhanced in the whole superconducting regime of the phase diagram, and the pressure effect is considerably large compared to other iron pnictides. The large positive pressure coefficient in the optimally and overdoped region is different from that in Ba(Fe1-xCox)2As2, and disappears simultaneously with the superconductivity in the phase diagram. These results could be explained as originated from the similarity of electron structures within the superconducting dome, and a drastic change of the electron structures between the superconducting overdoped regime and the non-superconducting heavily overdoped regime, which correspond to the conclusions of STM and ARPES measurements.
Acknowledgements
This work is supported by the National Natural Science Foundation of China (Grant No. 11190021 and No. 51021091), the National Basic Research Program of China (973 Program, Grant No. 2012CB922002 and No. 2011CB00101) and the Chinese Academy of Sciences.
References
- (1) Y. Kamihara, H. Hiramatsu, M. Hirano, R. Kawamura, H. Yanagi, T. Kamiya, and H. Hosono, J. Am. Chem. Soc. 128, 10012 (2008).
- (2) Wang, X. C., Q. Q. Liu, Y. X. Lv, W. B. Gao, L. X. Yang, R. C. Yu, F. Y. Li, and C. Q. Jin, Solid State Commun. 148, 538 (2008).
- (3) Dinah R. Parker, Michael J. Pitcher, Peter J. Baker, Isabel Franke, Tom Lancaster, Stephen J. Blundell and Simon J. Clarke, Chem. Commun., 2189 (2009).
- (4) S. V. Borisenko, V. B. Zabolotnyy, D. V. Evtushinsky, T. K. Kim, I. V. Morozov, A. N. Yaresko, A. A. Kordyuk, G. Behr, A. Vasiliev, R. Follath, and B. Büchner, Phys. Rev. Lett. 105, 067002 (2010).
- (5) G. F. Chen, W. Z. Hu, J. L. Luo, and N. L. Wang, Phys. Rev. Lett. 102, 227004 (2009).
- (6) Shiliang Li, Clarina de la Cruz, Q. Huang, G. F. Chen, T.-L. Xia, J. L. Luo, N. L. Wang, and Pengcheng Dai, Phys. Rev. B 80, 020504 (2009).
- (7) A. F. Wang, X. G. Luo, Y. J. Yan, J. J. Ying, Z. J. Xiang, G. J. Ye, P. Cheng, Z. Y. Li, W. J. Hu, and X. H. Chen, Phys. Rev. B 85, 224521 (2012).
- (8) Dinah R. Parker, Matthew J. P. Smith, Tom Lancaster, Andrew J. Steele, Isabel Franke, Peter J. Baker, Francis L. Pratt, Michael J. Pitcher, Stephen J. Blundell, and Simon J. Clarke, Phys. Rev. Lett. 104, 057007 (2010).
- (9) J. D. Wright, T. Lancaster, I. Franke, A. J. Steele, J. S. Möller, M. J. Pitcher, A. J. Corkett, D. R. Parker, D. G. Free, F. L. Pratt, P. J. Baker, S. J. Clarke, and S. J. Blundell, Phys. Rev. B 85, 054503 (2012).
- (10) Hiroki Takahashi, Kazumi Igawa, Kazunobu Arii, Yoichi Kamihara, Masahiro Hirano, and Hideo Hosono, Nature (London) 453, 376 (2008).
- (11) S. Medvedev, T.M.McQueen, I. A. Troyan, T. Palasyuk, M. I. Eremets, R. J. Cava, S. Naghavi, F. Casper, V. Ksenofontov, G. Wortmann, and C. Felser, Nat. Mater. 8, 630 (2009).
- (12) K. Ahilan, F. L. Ning, T. Imai, A. S. Sefat, M. A. McGuire, B. C. Sales, and D. Mandrus, Phys. Rev. B 79, 214520 (2009).
- (13) E. Colombier, M. S. Torikachvili, N. Ni, A. Thaler, S. L. Bud’ko, and P. C. Canfield, Supercond. Sci. Technol. 23, 054003 (2010).
- (14) M.Gooch, B. Lv, J. H. Tapp, Z. Tang, B. Lorenz, A. M. Guloy, and P. C. W. Chu, Europhys. Lett. 85, 27005 (2009).
- (15) S. J. Zhang, X. C. Wang, Q. Q. Liu, Y. X. Lv, X. H. Yu, Z. J. Lin, Y. S. Zhao, L. Wang, Y. Ding, H. K. Mao and C. Q. Jin, Europhys. Lett. 88, 47008 (2009).
- (16) M.Zhang J. J. Ying, Y. J. Yan, A. F. Wang, X. F. Wang, Z. J. Xiang, G. J. Ye, P. Cheng, X. G. Luo, J. P. Hu, and X. H. Chen, Phys. Rev. B 85, 092503 (2012).
- (17) N. Ni, A. Thaler, J. Q. Yan, A. Kracher, E. Colombier, S. L. Bud’ko, and P. C. Canfield, Phys. Rev. B 82, 024519 (2010).
- (18) Y. Takabayashi, M. T. McDonald, D. Papanikolaou, S. Margadonna, G. Wu, R. H. Liu, X. H. Chen, and K. Prassides, J. Am. Chem. Soc. 130, 9242 (2008).
- (19) M. S. Torikachvili, S. L. Bud ko, N. Ni, and P. C. Canfield, Phys. Rev. B 78, 104527 (2008).
- (20) M. Gooch, B. Lv, B. Lorenz, A. M. Guloy, and C. W. Chu, Phys. Rev. B 78, 180508 (2008).
- (21) P. L. Alireza, Y. T. Chris Ko, J. Gillett, C. M. Petrone, J. M. Cole, G. G. Lonzarich and S. E. Sebastian, J. Phys.: Condens. Matter 21, 012208 (2009).
- (22) E. Colombier, S. L. Bud’ko, N. Ni, and P. C. Canfield, Phys. Rev. B 79, 224518 (2009).
- (23) Lina E. Klintberg, Swee K. Goh, Shigeru Kasahara, Yusuke Nakai, Kenji Ishida, Michael Sutherland, Takasada Shibauchi, Yuji Matsuda, and Takahito Terashima J. Phys. Soc. Jpn., 79, 123706 (2010)
- (24) Qingqing Liu, Xiaohui Yu, Xiancheng Wang, Zheng Deng, Yuxi Lv, Jinlong Zhu, Sijia Zhang, Haozhe Liu, Wenge Yang, Lin Wang, Hokwang Mao, Guoyin Shen, Zhong-Yi Lu, Yang Ren, Zhiqiang Chen, Zhijun Lin, Yusheng Zhao, and Changqing Jin, J. Am. Chem. Soc. 133, 7892 (2011)
- (25) Xiaodong Zhou, Peng Cai, Aifeng Wang, Wei Ruan, Cun Ye, Xianhui Chen, Yizhuang You, Zheng-Yu Weng, and Yayu Wang, Phys. Rev. Lett. 109, 037002 (2012).
- (26) S. T. Cui, S. Y. Zhu, A. F. Wang, S. Kong, S. L. Ju, X. G. Luo, X. H. Chen, G. B. Zhang, and Z. Sun, arxiv:1206.4402 (2012).