A Luminous Be+White Dwarf Supersoft Source in the Wing of the SMC: MAXI J0158-744
Abstract
We present a multi-wavelength analysis of the very fast X-ray transient MAXI J0158-744, which was detected by MAXI/GSC on 2011 November 11. The subsequent exponential decline of the X-ray flux was followed with Swift observations, all of which revealed spectra with low temperatures (100eV) indicating that MAXI J0158-744 is a new Supersoft Source (SSS). The Swift X-ray spectra near maximum show features around 0.8 keV that we interpret as possible absorption from O viii, and emission from O, Fe, and Ne lines. We obtained SAAO and ESO optical spectra of the counterpart early in the outburst and several weeks later. The early spectrum is dominated by strong Balmer and He i emission, together with weaker He ii emission. The later spectrum reveals absorption features that indicate a B1/2IIIe spectral type, and all spectral features are at velocities consistent with the Small Magellanic Cloud. At this distance, it is a luminous SSS ( erg s-1) but whose brief peak luminosity of erg s-1in the 2–4 keV band makes it the brightest SSS yet seen at “hard” X-rays. We propose that MAXI J0158-744 is a Be–WD binary, and the first example to possibly enter ULX territory. The brief hard X-ray flash could possibly be a result of the interaction of the ejected nova shell with the B star wind in which the white dwarf (WD) is embedded. This makes MAXI J0158-744 only the third Be/WD system in the Magellanic Clouds, but it is by far the most luminous. The properties of MAXI J0158-744 give weight to previous suggestions that SSS in nearby galaxies are associated with early-type stellar systems.
Subject headings:
accretion, accretion disks — binaries: close — Magellanic Clouds — stars: individual: (MAXI J0158-744) — white dwarfs — X-rays: bursts1. Introduction
Supersoft sources (hereafter SSS) are a class of luminous X-ray sources, so-called because of their very soft ( 100 eV) X-ray spectrum, which can reach luminosities up to erg s-1). Initially discovered in the Magellanic Clouds, as a result of their low interstellar absorption in that direction (Long et al., 1981), they have subsequently been found in the Milky Way and in nearby galaxies (Di Stefano & Kong, 2003, 2004; Kong et al., 2004; Kong & Di Stefano, 2005). Key to understanding the nature of the SSS is that their effective blackbody radii are comparable to those of a white dwarf (WD). In fact, many hot WDs and pre-WDs have now been observed as SSS including several recent novae, symbiotic systems, and a planetary nebula, in all of which the WD nature of the compact object is well established (see the SSS catalog from Greiner (2000)). This led to van den Heuvel et al. (1992) establishing what is now considered as the SSS paradigm, wherein they are WDs in close binary systems, accreting at very high rates, which leads to (quasi-)stable thermonuclear burning of hydrogen on the WD surface (see also Rappaport et al. (1994); Hachisu et al. (1996); Di Stefano & Nelson (1996)). Furthermore, this requires a massive WD for the most luminous of the class, and so SSS are considered to be strong candidates as progenitors of Type Ia supernovae in the single-degenerate scenario (Di Stefano, 2010; Kahabka, 2006). SSS are therefore very important for enhancing our understanding of close binary interactions and the late stages of stellar evolution. It also appears that, under rare circumstances, SSS can exhibit “ultraluminous” (or ULX) levels, which are difficult to explain through a simple application of the steady nuclear burning model (Liu & Di Stefano, 2008).
While the RXTE monitoring programs of the Small Magellanic Cloud (SMC) have revealed an extensive population of Be X-ray pulsars (and hence are neutron star (NS) systems, see Galache et al. (2008)), the detection of their WD cousins is hampered by the luminosity of the Be companion and the lack of continuous soft X-ray monitoring of these regions. To date, only two Be+WD systems (the first, XMMU J052016.0-692505, in the LMC (Kahabka et al., 2006); the second, XMMU J010147.5-715550, in the SMC (Sturm et al., 2012)) have been detected in the Magellanic Clouds.
In late 2011, MAXI J0158-744, a new X-ray transient, detectable only at soft (4 keV) energies, was discovered with the MAXI/GSC as a very brief (90 minutes) X-ray flare, in the direction of the Wing of the SMC, but with poor () location accuracy (Kimura et al., 2011). This X-ray flare (denoted XRF 111111A) exhibited a very unusual spectrum in that all the X-ray flux was confined to the lowest GSC energy channel (2–4 keV), inferring a luminosity at these energies of erg s-1(Kimura et al., 2011) at the distance of the SMC. This was substantially higher than any known Galactic/Magellanic Cloud SSS, and approaching the luminosities seen in some extragalactic SSS (Greiner, 2000).
A Swift X-ray and UV/optical observation (Kennea et al., 2011; Li et al., 2011) was performed within 10 hr of the MAXI trigger, revealing that MAXI J0158-744 was undergoing a supersoft phase of emission ( erg s-1 (0.2–2 keV)), and with an accurate (3.6 arcsec) location of :59:25.6, 74:15:28, J2000.0). The X-ray spectra were compatible with a low-temperature blackbody (100 eV) that is typical of the SSS. Swift/UVOT UV/optical images plus archival OGLE-IV I band photometry show that the optical counterpart is a bright (13th magnitude in the U band) blue star that increased in brightness by at least 0.5 mag at the time of the MAXI/GSC X-ray flash, and declined on the same timescale as the Swift/XRT light curve.
Ultraluminous X-ray sources (ULXs) are non-nuclear X-ray sources with erg s-1, whose physical properties are still controversial (Swartz et al., 2004). Short-term variability indicates that they must be accreting compact objects, where the mass transfer rate is close to or exceeding the Eddington Limit. Once strong candidates for the long-sought intermediate-mass black holes (IMBHs), they are now considered likely to be extreme examples of stellar-mass black holes (see e.g., Zampieri & Roberts (2009)). It is thus of considerable current interest as to how accreting WDs can even come close to having properties that appear to overlap with the ULX.
In this paper, we present a time-resolved, multi-wavelength follow-up of the MAXI J0158-744 X-ray flare and its subsequent decline over the next few months, using Swift XRT/UVOT, Galaxy Evolution Explorer GALEX, SAAO 1.9 m, ESO NTT, Wide-field Infrared Survey Explorer (WISE), and ATCA radio observations to reveal some of the detailed properties of this remarkable object.
2. Observations
2.1. X-Ray: MAXI
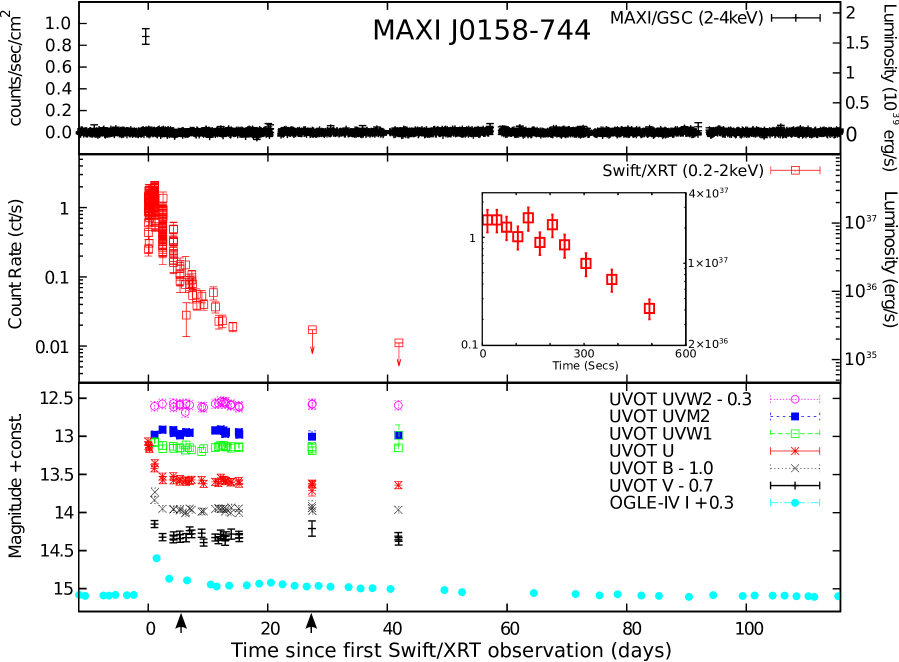
The MAXI X-ray camera monitors the 0.5–30keV X-ray sky from the International Space Station, providing source alerts and making its data immediately publicly available.111http://maxi.riken.jp/mxondem/ MAXI J0158-744 was detected by the MAXI/GSC on 2011 November 11 as a bright, but short-lived (less than a single 92 minute orbit) soft X-ray flare (for details, see Kimura et al. (2011)). Using the on-line processed data products provided by the MAXI team (i.e., light curve and spectrum) we show in Figure 1 (top panel) the MAXI/GSC light curve (at the highest temporal resolution of orbit by orbit) in the lowest energy band provided (2–4 keV). Remarkably, apart from the clear X-ray flare that was detected from 2011 November 11 03:34 to 05:06 UTC with a count rate of counts cm-2 s-1 (Figure 1), the source is virtually undetectable at all other times in this 4 month interval.
The MAXI X-ray spectrum corresponding to the X-ray flare indicates only that it was soft (confined to the lowest energy channel) and so we fitted it with an absorbed blackbody model, and with the column density () fixed to the galactic value of cm-2 (Dickey & Lockman, 1990). The best-fit temperature is eV, which is consistent with the preliminary result from Kimura et al. (2011). The low temperature shows that it is a soft X-ray source (but not soft enough to be able to claim that it was in the SSS phase from the outset.) Given its location (in the direction of the SMC, and confirmed by our optical spectra below which show it to be at the velocity of the SMC) we assume a distance of 60.6 kpc (Hilditch et al., 2005), which leads to an unabsorbed luminosity in the flare of erg s-1 (2–4 keV). (We noted that the difference between the estimated luminosities from this paper () and Kimura et al. (2011; 400 mCrab or erg s-1) is probably due to different estimation methods used, i.e. we estimated the unabsorbed luminosity from X-ray spectral fitting while they estimated it from the source count rate222http://maxi.riken.jp/top/index.php?cid=000000000036 ). This immediately established great interest in MAXI J0158-744 as potentially the most luminous SSS in the Magellanic Clouds ever reported (see Greiner (2000) for a compilation of known SSS). Furthermore, this extremely high luminosity places MAXI J0158-744 into the ULX regime, bearing comparison with sources usually interpreted as high-mass transfer black hole (BH) systems (see Hodges-Kluck et al. (2012); Soria et al. (2012)).
For comparison with the blackbody model, we also fitted a Raymond–Smith thermal plasma model. This gave a similar unabsorbed luminosity, and with a best-fit temperature of keV. The signal-to-noise ratio (S/N) of the MAXI spectrum does not allow a distinction between the models (there are only six pulse-height analyzer bins within the 2–4 keV range).
2.2. X-Ray: Swift/XRT
| Obs Id | Date333All observations were taken in 2011. | Exp(XRT) | Exp(UVOT) | Mode444PC: photon-counting; WT: window-timing. |
| (m/d) (MJD) | (s) | (s) | (PC/WT) | |
| 32181001 | Nov 11 (55876) | 682 | 867 | PC |
| 32182001 | Nov 11 (55876) | 735 | 912 | PC |
| 32187001 | Nov 12 (55877) | 1994 | 1950 | WT |
| 32187002 | Nov 14 (55879) | 1994 | 1956 | WT |
| 32187004 | Nov 15 (55880) | 2024 | 1966 | WT |
| 32187005 | Nov 16 (55881) | 2169 | 2111 | WT |
| 32187006 | Nov 17 (55882) | 1724 | 1676 | WT |
| 32187007 | Nov 18 (55883) | 2146 | 2097 | PC |
| 32190001 | Nov 19 (55884) | 4351 | 4316 | PC |
| 32190002 | Nov 19 (55884) | 707 | 667 | PC |
| 32187008 | Nov 20 (55885) | 2567 | 2517 | PC |
| 32187010 | Nov 22 (55887) | 2292 | 1570 | PC |
| 32187011 | Nov 23 (55888) | 2337 | 2286 | PC |
| 32187012 | Nov 24 (55889) | 2339 | 2262 | PC |
| 32187013 | Nov 25 (55890) | 1354 | 1316 | PC |
| 32187014 | Nov 26 (55891) | 2448 | 2398 | PC |
| 32187015 | Dec 09 (55904) | 1983 | 1925 | PC |
| 32187016 | Dec 23 (55918) | 3677 | 2481 | PC |
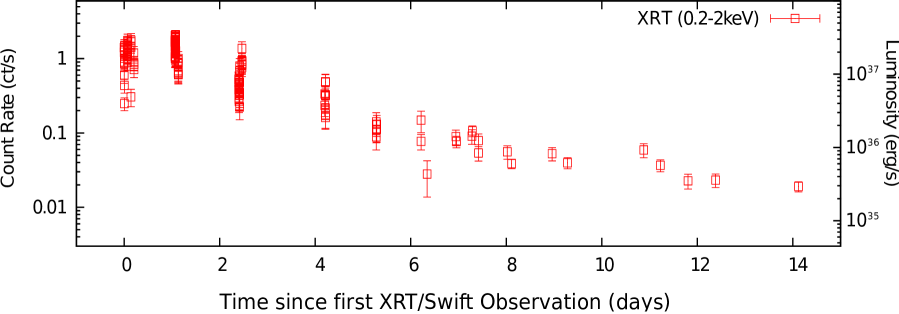
MAXI J0158-744 was observed by Swift between 2011 November and December (see Table 1). The first two observations were taken in photon counting (PC) mode in order to accurately locate the source, since the MAXI all-sky camera only provides 0∘.42 plus 0∘.1 (systematic uncertainty) positional information (Kimura et al., 2011). Subsequent observations were taken in window timing (WT) mode, in order to reduce pile-up effects due to the high initial count rate (0.6 counts s-1), and then returned to PC mode for the last 11 observations. Data calibration, extraction, and event filtering were performed according to standard procedures outlined in the Swift/XRT data reduction guide (Capalbi et al., 2005).
In contrast with the behavior of the well-known class of Galactic soft X-ray transients/X-ray novae (which are all BH/NS systems, see Charles & Coe (2006)), the outburst of this source lasted barely two weeks. Within a month it was below the Swift detection limit, indicating a two orders of magnitude drop in intensity (Figure 1). In order to search for any periodicities in the data, we performed a Fourier analysis of the MAXI and Swift data on all relevant timescales. However, no significant signal was present in the power spectra.
We then established different time intervals for analysis based on the flux levels in the overall light curve, producing summed spectra for each time period of interest. As the first two observations in Table 1 are essentially a single observation, we merged them to form a combined spectrum. In the following three observations (November 12–15), the X-ray source was still strong, and therefore we grouped them individually. We combined the remaining observations as follows in order to increase the S/N: November 16–17; November 18–20,22–26. The final two observations were not used, as the source, while marginally detected, was too weak to produce useable spectra.
2.2.1 XRT Spectral Fitting
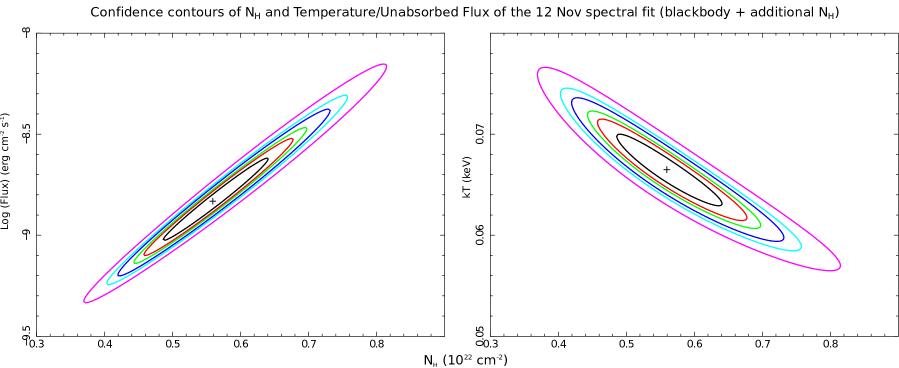
The X-ray spectra were fitted with XSPEC (Arnaud, 1996) using mostly blackbody models, but we also tried the Tübingen WD model atmospheres (Rauch & Deetjen, 2003; Werner & Dreizler, 1999; Werner et al., 2003) which can be used in XSPEC as a tabular grid of models for fitting. Nevertheless, all the temperatures relevant here are low (100eV), which makes the results (especially the implied luminosity) extremely sensitive to the values of the fit, if the latter become high. This is demonstrated in Figure 2, which shows contour maps of the November 12 spectral fit (blackbody + additional ), indicating how the (, unabsorbed flux) and (, ) correlate with each other, leading to potentially large systematic errors in the unabsorbed flux. This is clear in the results summarized in Table 2. Accordingly, we assumed the presence of a Galactic value of cm-2(Dickey & Lockman, 1990) in all models, so as to avoid overestimating the unabsorbed flux or underestimating the temperature. All the XRT spectra give temperatures in the range 80–120 eV (see top half of Table 2). The inferred luminosities decrease exponentially from the initial peak, and the source drops below the Swift detection limit about a month later (Figure 1). However, it should be noted that the source and its spectrum varied dramatically from early in the outburst (as demonstrated by the hardness ratio (HR) and X-ray flux plots (Figure 4 and the inset in Fig 1). Hence a blackbody may not be appropriate to account for all phases of the outburst. Higher resolution observations (e.g., CXO (Weisskopf et al., 2000)) do indicate the importance of using more physically relevant models, even though Swift/XRT’s limited sensitivity, spectral and temporal resolution cannot directly distinguish among them. Nonetheless, the fit parameters are still useful for comparison with the behavior of other SSS.
In addition to the fixed blackbody fitting, we tried adding an additional absorbing component to see if there is any intrinsic absorption in the system. This extra absorption had abundances set to those appropriate for the SMC (i.e. He=0.83; C=0.13, N=0.05; O=0.15; Ne=0.19; Na=0.41; Mg=0.24; Al=0.79 Si=0.28; S=0.21; Cl=0.28; Ar=0.16; Ca=0.21; Cr=0.26; Fe=0.20; Co=0.20; and Ni=0.40, relative to solar) (Russell & Dopita, 1992). Except for the last spectrum (that required no additional absorption), the fits to all other spectra were significantly improved. However, many of the parameters are not then well constrained, especially the normalization factors (i.e., where is the source radius in km, and, is the distance to the source in units of 10 kpc555https://heasarc.gsfc.nasa.gov/xanadu/xspec/manual/XSmodelBbodyrad.html), and so these are given as upper limits in Table 2.
We also attempted to find a better model by trying various model combinations. We found that an absorption edge at 0.9 keV and an emission line at 0.7 keV666It has been suggested that the 0.7 keV excess could be explained by an overabundance of oxygen and neon along the line of sight (Juett et al., 2001). can ameliorate the fits of November 11 and 12, respectively. To estimate the significances of these spectral features, we performed F-tests777See the Appendix of Orlandini et al. (2012) for details. on the fits, which give about 85% confidence for the edge and 99% confidence (close to ) for the emission line. The best fit parameters for these models are shown in parentheses in Table 2, and all the models plotted in Figure 3.
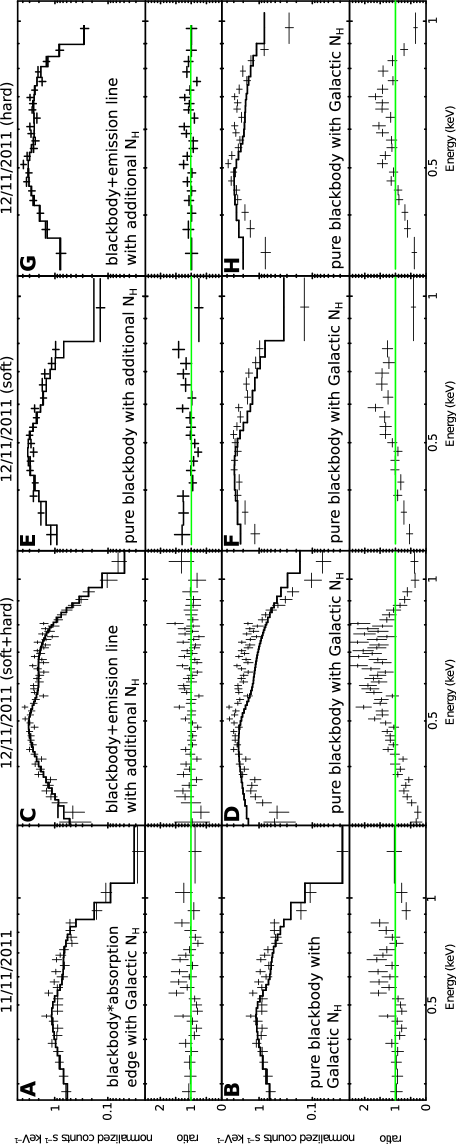

Left column: (A) November 11 spectrum with blackbody + absorption edge at 0.89keV (and fixed Galactic ), and (B) pure blackbody with fixed Galactic of cm-2;
Second column: (C) November 12 spectrum with blackbody plus an emission line with additional , and (D) pure blackbody with fixed Galactic of cm-2.
Right two columns show the spectra and fits when dividing the November 12 spectrum to be before (soft) and after (hard) the HR jump seen in Figure 4. The “hard” spectrum (G and H) includes a broad emission feature at 0.7keV. Note that the absorption and emission features are visible in the residuals to the simple fits.
Lower panel: late outburst Swift/XRT spectra (after November 12) of MAXI J0158-744 with their best-fit blackbody models (with or without additional ). No valid fits have been obtained by using a blackbody with additional for the November 16–17 and November 18–26 Nov spectra.

In addition to the detailed spectral analysis, we investigated both short and long timescale spectral variability in MAXI J0158-744 by plotting the spectral HR (defined as ) against the X-ray lightcurve. The soft (S) and medium bands (M) cover 0.2–0.5 keV and 0.5–2.0 keV, respectively. We find (Figure 4) that HR varied throughout most of the observations, especially in the early and late times of the outburst, when the changes are correlated with the X-ray flux (i.e., a lower count rate gives a harder spectrum). Furthermore, we noted a jump in HR on 2011 November 12 at 17:16 UTC from to which is clearly visible in the middle panel of Figure 4. We divided the spectra accordingly and found that the jump was associated with the sudden appearance of the 0.7 keV emission feature required by the fits (Figure 3).
| Date | (Additional) | Unabsorbed | Blackbody | Radius | Notes | |
| (0.2–2keV)11footnotemark: 1 | Temperature | |||||
| ( cm-2) | ( erg s-1) | () | () | /dof | ||
| Blackbody + fixed of cm-2(wabs*bbodyrad) | ||||||
| 2011 Nov 11 | 40/26 | |||||
| 2011 Nov 12 | 457/56 | |||||
| 2011 Nov 12 (soft) | 184/34 | |||||
| 2011 Nov 12 (hard) | 306/44 | |||||
| 2011 Nov 14 | 40/18 | |||||
| 2011 Nov 15 | 12/7 | |||||
| 2011 Nov 16–17 | 39/10 | |||||
| 2011 Nov 18–26 | 44/14 | |||||
| Blackbody + additional (phabs*vphabs*bbodyrad)44footnotemark: 4 | ||||||
| 2011 Nov 1155footnotemark: 5 | () | () | () | () | 38/25 (23/23) | (+edge at keV) |
| 2011 Nov 1266footnotemark: 6 | () | () | () | () | 62/55 (47/52) | (+line at keV) |
| 2011 Nov 12 (soft) | 50/33 | |||||
| 2011 Nov 12 (hard)66footnotemark: 6 | () | () | () | () | 49/43 (34/40) | (+line at 0.7 keV (fixed)) |
| 2011 Nov 14 | 13/17 | |||||
| 2011 Nov 15 | 9/6 | |||||
| 2011 Nov 16–17777Uncertainties of the unabsorbed luminosities are estimated by approximating //. | ||||||
| 2011 Nov 18–26777Uncertainties of the unabsorbed luminosities are estimated by approximating //. | ||||||
| WD atmosphere model + fixed of cm-2(wabs*tmap)88footnotemark: 8 | ||||||
| 2011 Nov 11 | (max) | 212/26 | ||||
| 2011 Nov 12 | (max) | 698/56 | ||||
| 2011 Nov 12 (soft) | (max) | 194/34 | ||||
| 2011 Nov 12 (hard) | (max) | 557/44 | ||||
| 2011 Nov 14 | (max) | 21/18 | ||||
| 2011 Nov 15 | (max) | 12/7 | ||||
| 2011 Nov 16–17 | (max) | 57/10 | ||||
| 2011 Nov 18–26 | (max) | 63/14 | ||||
| WD atmosphere model + additional (phabs*vphabs*tmap)88footnotemark: 8 | ||||||
| 2011 Nov 11 | (max) | 173/25 | ||||
| 2011 Nov 12 | (max) | 139/55 | ||||
| 2011 Nov 12 (soft) | (max) | 62/33 | ||||
| 2011 Nov 12 (hard) | (max) | 109/43 | ||||
| 2011 Nov 14 | (max) | 18/17 | ||||
| 2011 Nov 15777Uncertainties of the unabsorbed luminosities are estimated by approximating //. | ||||||
| 2011 Nov 16–17777Uncertainties of the unabsorbed luminosities are estimated by approximating //. | ||||||
| 2011 Nov 18–26777Uncertainties of the unabsorbed luminosities are estimated by approximating //. | ||||||
2.3. UV/Optical: Swift/UVOT
Simultaneously with the Swift/XRT observations, UVOT images in six UV to optical filters were obtained, with s per exposure (except for the very first observation, that was U-band only). We performed aperture photometry on these data, using standard UVOT procedures (Roming et al., 2005) to obtain lightcurves. To optimize the S/N, we used an aperture radius of 3″as recommended by HEASARC (Burrows et al., 2005) and a source-free background region that minimizes contamination from nearby sources.
We also obtained a single 5000 s UVOT optical spectrum (2800–5200 Å) on 2011 November 19. This was processed using standard UVOT procedures and background subtracted. Wavelength calibration is limited by the extended shape of the zeroth-order image to an accuracy Å, and a systematic offset of up to 66 Å (see Bufano et al. (2009) for details). There are no obvious emission/absorption features present, but it is brighter at shorter wavelengths, as indicated by the photometry.
2.3.1 UVOT Results
In the early part of the MAXI J0158-744 outburst, our UVW1, U, B, and V images show significant brightening, by up to 0.5 mag, followed by a rapid decline (within days) to a stable level (Figure 1). In contrast, the UVM2 and UVW2 levels stayed almost constant, at and (with uncertainty 0.05 mag during the entire Swift campaign). Assuming the Galactic column of cm-2, we estimated the V-band extinction to MAXI J0158-744 as using /= cm-2 mag-1 (Güver & Özel, 2009). We then used the extinction curve in Cardelli et al. (1989) to estimate the extinction values for the other bands: , , , , and . (Some data were excluded from this analysis as a result of spacecraft pointing drifts, which clearly produced spurious results.)
2.4. Optical: OGLE-IV Monitoring
MAXI J0158-744 is located in a region of the SMC that is monitored by the OGLE-IV project (Udalski, 2008). Consequently, this provides us with close to nightly monitoring of the source, both before and during the interval covered by the Swift observations. As expected, there is a bright optical source present in the Optical Gravitational Lensing Experiment (OGLE) images, at :59:25.87, 74:15:28.0 (J2000.0), which is well within the Swift/XRT error circle. The OGLE data are restricted to the I-band, and are plotted as the bottom curve of Figure 1. A major I-band flare (reaching ) is clearly seen at the time of the X-ray flash. In fact, this point was obtained 1–2 days after the X-ray flash, which means that the peak I-band magnitude could be even higher.
From the OGLE monitoring prior to the data plotted here, we find that from 500 days to 320 days before the X-ray flash. At this point, the optical light increased to a new quasi-quiescent magnitude (), which persisted up to the major flare.
Besides the major flare, we also note a secondary peak almost exactly 20 days after the main outburst. Curiously, there is a small-scale “blip” in the MAXI/GSC lightcurve at the same time (Figure 1). However, the S/N of the MAXI/GSC data here is so weak (), that we cannot claim this is a real signal. Unfortunately, no Swift XRT/UVOT observations were carried out during that period. The I-band flux finally returned to the pre-outburst level 60 days after the X-ray flash.
2.5. Optical Spectroscopy: SAAO/1.9m
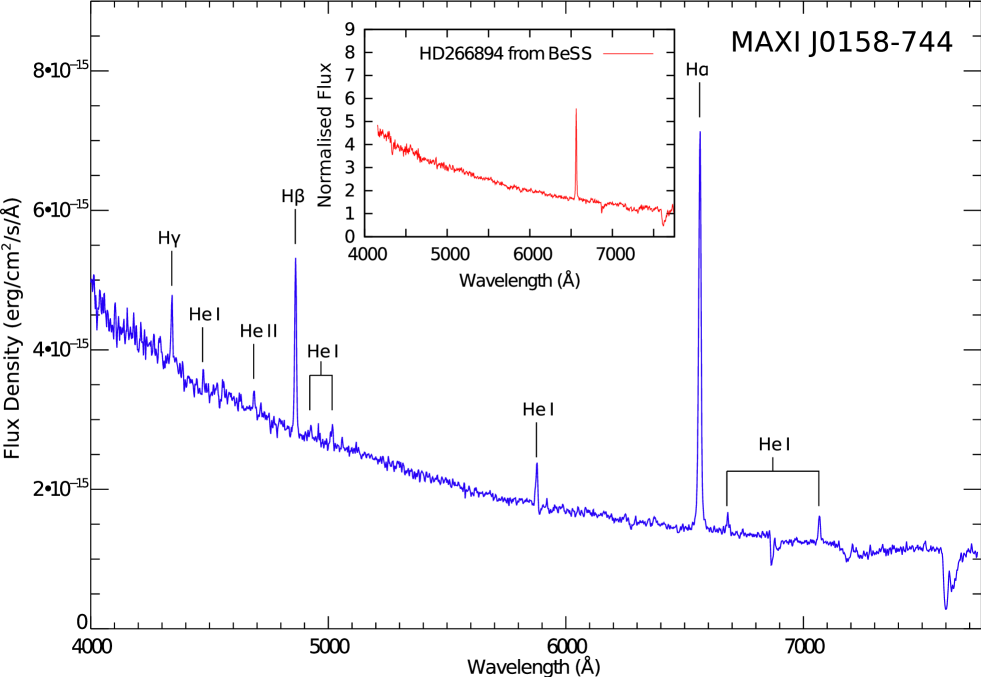
A low resolution, wide wavelength (4000–7700) optical spectrum of MAXI J0158-744 was obtained with the SAAO 1.9 m telescope and CCD spectrograph at Sutherland, South Africa on 2011 November 16, beginning at 22:23UT, approximately 5 days after the initial X-ray flash. Two 1800s exposures using the SITe CCD camera and 300 grating (giving 7Å resolution) were obtained within a timespan of 2 hours, and the average of these is plotted in Figure 5. It is dominated by very strong Balmer emission, but also exhibits strong He i emission at 5876 and 6678, and weaker He ii4686 emission. He ii4686 is usually present in SSS systems (e.g., CAL83; Crampton et al. 1987 and V407 Cyg; Nelson et al. 2012), therefore such emission provides further confirmation of the identification of this object with the X-ray outburst. While the spectrum has characteristics of SSS, it does contrast with that of the prototype SSS, CAL83, where He ii4686 is by far the dominant emission feature in the spectrum (Crampton et al., 1987).
2.6. Optical Spectroscopy: ESO/FOS
Optical spectra were taken on 2011 December 8 (almost 1 month after the initial X-ray flash) with the ESO Faint Object Spectrograph (EFOSC2) mounted at the Nasmyth B focus of the 3.6m NTT. A slit width of 1″.5 was employed, together with a 600 lines mm-1 grating that yielded 1 Å pixel-1 dispersion over a wavelength range of – Å. The resulting spectra were recorded on a Loral/Lesser, thinned, AR-coated, UV-flooded, MPP CCD with 20482048 pixels, at a spectral resolution of Å. The data were reduced using the standard packages available in the Image Reduction and Analysis Facility (IRAF). Wavelength calibration was achieved with helium and argon arc lamps, and the data were reduced using IRAF. The resulting spectrum of MAX J0158-744 was normalized to remove the continuum and then redshift corrected for an assumed SMC recession velocity of 158 km s-1.
2.6.1 Spectral Classification
OB stars in the Milky Way are classified using certain metal and helium line ratios (Walborn & Fitzpatrick, 1990), but this cannot be applied in lower metallicity environments, such as the SMC, due to the weakness or the absence of the metal lines. Accordingly, we classified the spectrum of MAXI J0158-744 using the method of Lennon (1997) for B-type stars in the SMC.
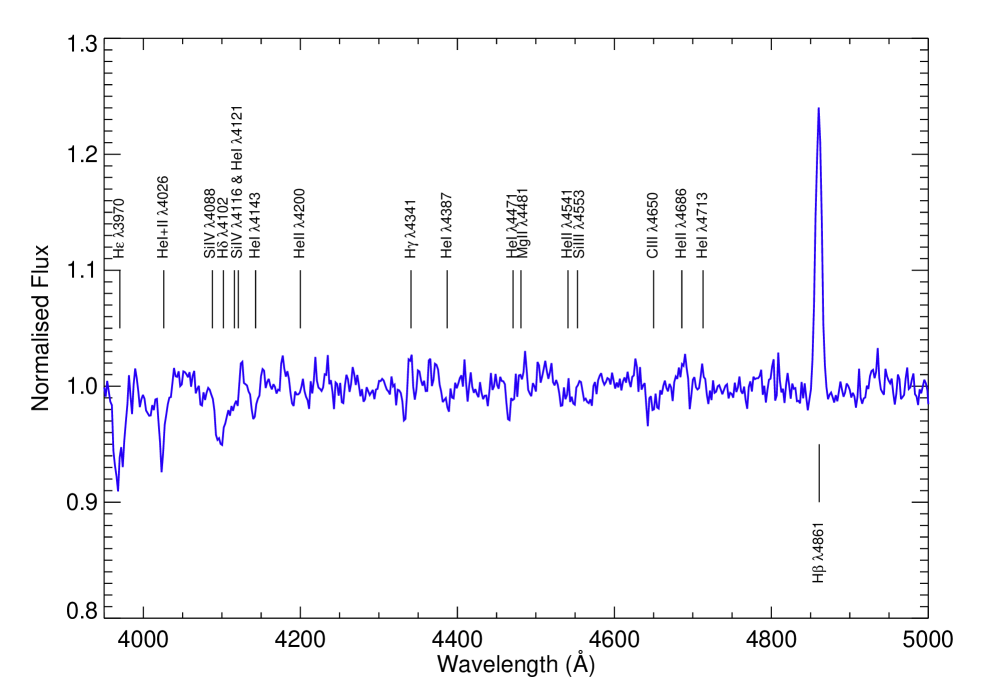
Figure 6 shows the unsmoothed optical spectrum of MAXI J0158-744, which is dominated by the Balmer and neutral helium lines. The He ii 4200, 4143 lines are either too weak or absent, which makes the optical counterpart later than O9. The Si iii4553 line is stronger than Mg ii 4481, implying a spectral classification earlier than B2.5. There does appear to be some evidence for the Si iv 4116 line, however the rotationally broadened H line in close proximity makes it difficult to distinguish. As such we classify the optical counterpart of MAXI J0158-744 as a B1-2 star. We also compared our SAAO optical spectrum with those of classical Be stars obtained from the Be Stars Spectra Database (BeSS; Neiner et al. 2011), and MAXI J0158-744 is very similar to several of them (e.g., HD 277707 and HD 266894, see inset in Figure 5). This further confirms the nature of the optical counterpart of MAXI J0158-744. However, it is worth noting that there are no strong P-Cygni profiles observed in the emission lines, which might be expected for a major outburst event, but this could be attributed to the dominant continuum emission from the Be giant, thereby greatly diluting any such effect. As to its luminosity class, a B1-2 main-sequence star would have of to . However, the lowest V measurement in Figure 1 is 14.9 (corrected for the Galactic extinction), which corresponds to =-4.0 (for =60.6kpc), which is closer to that of a giant and the other two known Be+WD systems in the MCs, (XMMU J052016.0−692505 (LMC): =-3.70, (Kahabka et al., 2006) with mag, (Schaefer, 2008); and XMMU J010147.5-715550 (SMC): =-4.44, (Sturm et al., 2012)). This is also typical of many other BeX systems in the SMC, which are in the range of to (Bird et al., 2012). We caution that the luminosity classification is very tentative as the reddening as well as the contribution of the circumstellar disk to the optical counterpart are poorly known.
2.7. ATCA Observations
MAXI J0158-744 was observed by ATCA on 2011 December 23. The observations were performed simultaneously at frequencies 5.5 GHz and 9 GHz with configuration 6A (with the baseline ranging from 337 m to 6 km) and the upgraded Compact Array Broadband Backend. The data were taken with the CFB 1M-0.5k correlator configuration with 2 GHz bandwidth and 2048 channels, each with 1 MHz resolution. The primary calibrator used was 1934-638, while the phase calibrator was 0230-790. At the start of each observation, we observed 1934-638 for 10 minutes, and the phase calibrator every 25 minutes. We used MIRIAD (Sault et al., 1995) to analyze the data with standard procedures. We then performed standard data reduction steps, including bandpass, phase and amplitude calibrations. When producing the dirty maps, we used the multi-frequency synthesis method (Sault & Conway, 1999) and natural weighting to suppress the noise. The effective on-source integration time of MAXI J0158-744 was 3.8 and 3.4 hr at 5.5 GHz and 9 GHz, respectively. The field of view of ATCA with configuration 6A is 10′ and 5′ for 5.5 GHz and 9 GHz, respectively, and with spatial resolution that can reach 1′′– 2′′.
2.7.1 ATCA Results
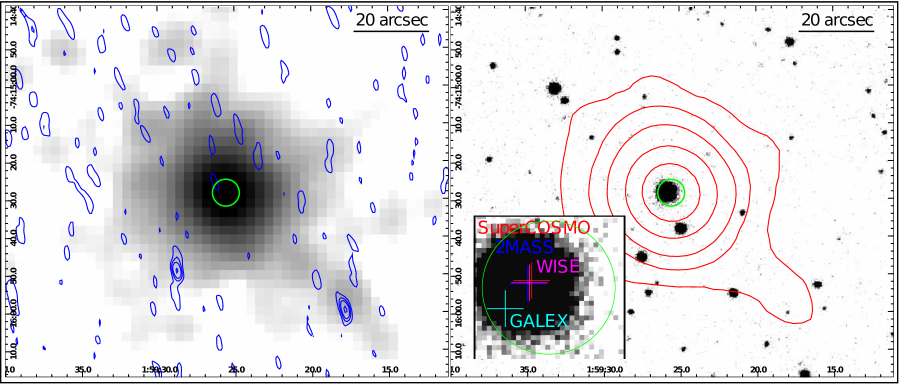
Figure 7 shows the Swift X-ray images overlaid with ATCA radio map contours of MAXI J0158-744. Besides background quasars, we did not detect any significant (3) radio sources at the MAXI J0158-744 location. However, there is a very marginal signal (2) detected within the XRT error circle, which will require deeper exposures to confirm. In naturally weighted maps, the rms noise level for MAXI J0158-744 is 16 (5.5 GHz) and 25 (9 GHz) Jy beam-1. We combined the observations from different frequencies in order to reduce the rms noise level at 6.8 GHz, but the improvement is not significant due to the short integration time. As a result, the observations reached an rms noise level of 15 Jy beam-1, giving a 3 upper limit of 45 Jy beam-1 for MAXI J0158-744. Although we did not find any statistically significant radio emission at the X-ray position, there is a 9.3 detection (150Jy beam-1) at 5.5 GHz approximately 25 away, while this source was not detected at 9 GHz. We further calculated a lower limit of 0.54 to its spectral index () by using the flux density at 5.5 GHz and the rms at 9 GHz. This is consistent with a background active galactic nucleus (Nandra et al., 2005; Tozzi et al., 2006).
2.8. Archival Measurements
There is an optical/IR source listed in the SuperCOSMOS (Hambly et al., 2001) and Two Micro All Sky Survey (2MASS; Skrutskie et al. 2006) catalogs that has been associated with MAXI J0158-744. Quoted magnitudes are , ,888For -band photometry, we used in preference to since the former has higher signal to noise and better calibration. ,, , and . The B-band value is consistent with our UVOT low-state measurements. The 2MASS values are consistent with measurements from a quite separate IR study of the Magellanic Bridge, where the quoted values are , , and = (Nishiyama et al., 2007). Furthermore, we also found counterparts of MAXI J0158-744 in the GALEX catalog (GR6) (FUV: 14.660.02 and NUV: 14.640.01) and the WISE catalog (, , , and ).
2.8.1 Spectral Energy Distribution
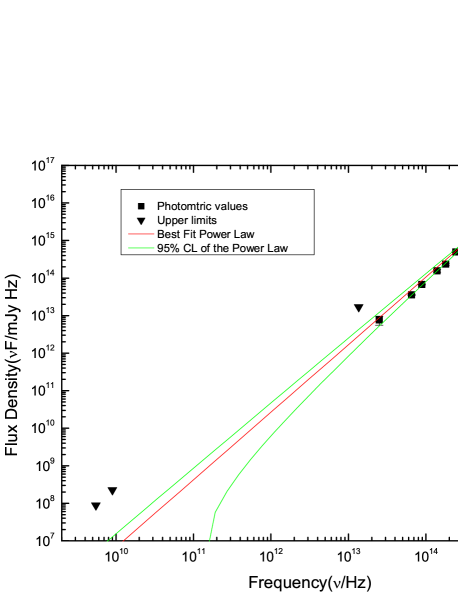
Using all the quiescent photometric measurements plus the two ATCA upper limits, we produced a spectral energy distribution (SED) from 5.5 GHz (5.45 cm) to 155 PHz (1928 Å) (Figure 8). After applying extinction corrections, the SED can be represented as a power law of index . According to Panagia & Felli (1975), the low frequency spectrum of the free–free radiation from a highly evolved star’s extended envelope can be described as (or ), which is consistent with the spectral index of our SED. Although Panagia & Felli (1975) derived the relation for radio frequencies, they also stated that the relation holds over a wider range of frequencies as long as the radius of the envelope is sufficiently large. Furthermore, it is known that the mid-IR spectra of many Be stars are dominated by free–free emission (Rinehart et al., 1999), and this might explain the quiescent SED of MAXI J0158-744. However, we caution that the extinction corrections may not be fully applicable in this region (we used the SMC Bar extinction curves), and hence the SED shape is only approximate.
3. Discussion
3.1. Nature of the Compact Object and Mass Donor in MAXI J0158-744
The sequence of Swift/XRT spectra obtained throughout the outburst of MAXI J0158-744 have properties that are typical of classical SSS in the Magellanic Clouds, principally low-temperature (100eV) thermal X-ray emission (after the initial flash) that is likely the consequence of thermonuclear burning of hydrogen on the surface of a WD, in stark contrast to the properties of BH/NS systems, where the inferred radii and temperatures are 10–100 km and 1 keV. Furthermore, our optical spectra are at velocities consistent with MAXI J0158-744 being located in the Magellanic Bridge; and the spectral absorption features later in the decline identify the mass donor as an early-type star, likely B1-2IIIe. Classical SSS like Cal83 and Cal87 are “persistent” sources while MAXI J0158-744 is transient, and with a very short duration in both X-rays and optical. It also produced a strong “hard” X-ray flash before entering the SSS phase, which makes it a very special case that cannot be explained easily within the standard SSS model. Combined with the inferred blackbody radius of the SSS component (about – ), we therefore conclude that MAXI J0158-744 is a WD orbiting a Be star.
There is now a consensus on the accretion rate regimes and masses in which persistent and transient SSS occur, and this has recently been reviewed by Kato (2010). This can be summarized briefly as follows:
-
•
–yr-1, in this relatively narrow range of mass transfer rates, accreting WDs (of mass 0.7–1.2 ) burn hydrogen on their surfaces steadily without driving substantial outflows, and are seen as persistent SSS;
-
•
below yr-1, the hydrogen burning is triggered sporadically, which is normally seen as a nova explosion (either classical or recurrent). During the later phases of the nova outburst, the system will enter an SSS phase, the duration of which is a strong function of the WD mass, with the highest masses producing the shortest durations (see Kato (2010), and references therein);
-
•
above yr-1, the hydrogen burning drives substantial outflows which is seen as an optically thick wind. However, this wind can interact with the low mass donor in ways that can temporarily stop the Roche lobe overflow, which will then cause the SSS to switch off. Subsequently, the mass transfer onto the WD restarts and the process is repeated. The prototype of this behavior is RXJ0513.9-6951 (Southwell et al., 1996).
Based on this interpretation, MAXI J0158-744 fits the second (low-mass transfer rate) explanation extremely well, and so we can constrain the mass accretion rate onto the WD in MAXI J0158-744 to be less than a few times yr-1. But what about the nova explosion that should have been associated with this event? In fact, typical novae in the SMC have peak magnitudes in the range 11–13.6,999See http://www.mpe.mpg.de/m31novae/opt/smc/index.php. but these are all classical or recurrent novae, where the mass donor is a low-mass star (and hence intrinsically faint). In the case of MAXI J0158-744, the donor is intrinsically a luminous star in its own right, and so the approximately 0.5–1mag increase observed here (Figure 1) is entirely consistent with a classical or recurrent nova event taking place in the company of an early-type star.
That there are multiple emitting components in this system is clear from the different temporal behavior that is a strong function of wavelength. The X-ray/optical lightcurves (Figure 1) do show a clear positive correlation, where the X-ray emission drops exponentially for about two weeks and the U-band light drops even faster (at a rate of 0.5 mag in 2.4 days). More significantly, the duration of the optical outburst is about six times shorter than that of the X-ray outburst. MAXI J0158-744 also shows significant excess (0.1–0.5 mag) in the other three longer wavelength (B, V, UW1), yet no significant excess can be found at shorter wavelengths (UM2, UW2). This break in behavior at UV wavelengths, and the huge difference in the outburst durations indicates that the X-ray origin is intrinsically distinct from the optical, and hence infers the presence of multiple emitting regions.
Radio detection should also be expected for such a nova-like scenario. However, such radio emission would be much too weak at the distance of the SMC for our ATCA observation (10 Jy rms noise level). For examples, V Sge radiated 70 Jy at 1.2–2.75 kpc, equivalent to 6Jy at 60 kpc) (Lockley et al., 1997), and SS Cyg with an accretion rate of around yr-1 radiated 0.2 mJy at 100 pc (equivalent to 0.15 Jy at 60 kpc) (Körding et al., 2011). Also, the ATCA observation occurred 1 month after the outburst, when the expected radio emission would have been even fainter.
It is instructive to compare the X-ray light curves of MAXI J0158-744 and the recurrent nova RS Oph (Osborne et al., 2011), as both systems showed dramatic variations (up to one order of magnitude) on short timescales (– s). RS Oph showed a general trend that the X-rays are softer when the flux is stronger, which was also present in MAXI J0158-744 (Figure 4). We also compared MAXI J0158-744 with a classical nova (V2491 Cyg) that was well studied in X-ray and optical during its SSS phase (Page et al., 2010). Both SSS have similar lightcurves in X-ray and optical that decay exponentially following outburst. However, the optical amplitudes (6–7 mag) and durations (150 days) of V2491 Cyg are much higher and longer than those of MAXI J0158-744 (0.5 mag in 1–2 days). However, the fundamental difference between MAXI J0158-744 and classical/recurrent novae is the nature of the mass donor. Accordingly, we argue that the optical decline phase of MAXI J0158-744 is largely hidden by glare of the Be primary, otherwise the magnitude change and duration would have been much higher and longer. A similar effect has been observed in the case of the Fermi-detected nova V407 Cyg (Nelson et al., 2012). It is also very likely that the optical peak of MAXI J0158-744 was missed, so that we have underestimated the maximum brightness of MAXI J0158-744. Moreover, the I-band flux (OGLE-IV) of MAXI J0158-744 was above the quiescent level for at least 60 days after the major flare. This means a much higher V-band duration is highly possible but just hidden by the limitations of Swift/UVOT.
The brevity of the SSS phase (15 days), together with the high temperatures (90-110eV) from both blackbody and WD atmosphere models, provides an indication that the WD in MAXI J0158-744 is massive. According to Nomoto et al. (2007) such temperatures are only reached in white dwarfs exceeding 1.3 . Furthermore, the SSS light curve of MAXI J0158-744 is very similar to that of the very fast classical nova V2491 Cyg, whose SSS phase was only 10 days. This led Hachisu & Kato (2009) to infer a WD mass of 1.3 .
3.2. Origin of the X-Ray Spectral Features
Early in the outburst, the Swift/XRT spectra (Figure 3) required additional spectral features (a broad emission line at keV and an absorption edge at keV). These could be associated with O, Fe, and Ne features, where the broad 0.7 keV emission is a combination of O viii Ly (650 eV), Fe L (700–720 eV), and Ne K (850 eV) lines; and the 0.89 keV absorption edge could be associated with the K-edge of O viii(0.88 keV). A similar absorption edge has been observed in another SSS, RXJ0925.7-4758, which is undergoing steady nuclear burning on the WD surface (Ebisawa et al., 1996). Consequently, the K-edge and 0.7 keV broad emission features also support the interpretation of MAXI J0158-744 as an accreting WD system. Their origin is likely to be in the ejected shell from the WD surface at the beginning of the strong outburst, following which the WD enters a luminous supersoft phase (King et al., 2003). This provides further support for MAXI J0158-744 containing a massive (1.3) WD. If it is true, the accreting WD in the system could be O-rich.
3.3. Origin of the Initial X-Ray Flash
So far we have concentrated on the analysis and interpretation of the Swift/XRT and UV/optical observations of MAXI J0158-744. However, perhaps the most remarkable feature of this outburst is the initial X-ray flash detected by the MAXI/GSC. Having established now that MAXI J0158-744 is in the SMC, then the luminosity of this flash, assuming a 1 keV thermal (Raymond-Smith) plasma model, is erg s-1 (2–4 keV). During that single orbit, MAXI J0158-744 outshone the luminous NS X-ray binary, SMC X-1, in the MAXI/GSC 2–4 keV energy band. Even more remarkably, the flash was very short-lived, rising and falling in 92 minutes by at least a factor of 20, as MAXI detected no source at that location in the orbits before and after the X-ray flash.
The first Swift observation was approximately 10 hr later, and revealed the lower temperature SSS component, which we believe is quite distinct from the harder X-ray flash. That is because, even though the SSS flux declined over subsequent days, the timescale for this was much longer than the dramatic drop of the X-ray flash. Consequently, we should consider alternative emission mechanisms for the X-ray flash.
First, we have now argued that many of the MAXI J0158-744 properties are accountable as a nova explosion, and these can lead to hard X-ray components being present, as well as a short-lived SSS phase (see e.g., Mukai et al. (2008), and references therein). An excellent example of this is the recurrent nova, RS Oph, that underwent a well-studied outburst in 2006 (Sokoloski et al., 2006), reaching a hard X-ray luminosity of 1036 erg s-1, which included Fe K emission. This was explained as the result of a 3500 km s-1 ejected nova shell hitting the wind of the M giant donor star, essentially a “mini-SNR” as the subsequent X-ray decline followed a typical Sedov light curve. However, in some cases, the X-ray properties imply that the emission originates internal to the nova ejecta, and so internal shock models have been developed (Mukai & Ishida, 2001). Nevertheless, the X-ray luminosities attained are usually 1035 erg s-1.
But much higher luminosities are possible in special circumstances. The 1998 X-ray transient, XTE J0421+560, was associated with the bright B[e] star, CI Cam, and initially interpreted as the periastron passage of an NS or a BH compact object through the dense equatorial outflow from the B[e] star (Hynes et al., 2002), producing a peak X-ray luminosity of erg s-1 (3–20 keV). However, CI Cam has properties that did not fit well with other high-mass X-ray binaries or soft X-ray transients, and this led Filippova et al. (2008) to propose that XTE J0421+560 was actually a nova explosion on an accreting WD in its 19 days, eccentric orbit. While this interpretation, and the nature of the compact object in CI Cam, remains controversial, the detailed analysis by Filippova et al. (2008) of a nova explosion in the surroundings of an early-type star remain directly applicable to MAXI J0158-744. The large increase in luminosity compared to RS Oph they explain as due to the much denser medium that surrounds the B[e] star. The ejected nova shell interacts with and shocks the B[e] wind creating a hot (1–10 keV) thermal plasma that both heats and cools rapidly. In the case of XTE J0421+650 there was sufficient coverage to follow the rise and fall of this flux by a factor of 10 in 1 day (Filippova et al., 2008). This is possible given a dense B[e] wind (1010cm-3), which the shock will increase by a factor of four, and will radiatively cool on the observed timescale.
We therefore consider whether the detailed calculations of Filippova et al. (2008) can be applied to MAXI J0158-744, and what the implied parameters of the system would be. They give the timescale for radiative cooling as s, where is the emissivity of a hot gas, and is 10-24erg cm3s-1 in the 2–20keV band for 1keV. The MAXI J0158-744 X-ray flash cooled in 4000s, and this requires 51011cm-3. Allowing for the factor of four increase by the shock, this is only a factor of 10 higher than that inferred for CI Cam by Filippova et al. (2008), and entirely reasonable for the enhanced density in the equatorial outflow of a rapidly rotating Be star.
Unfortunately, we do not yet know the orbital period of the MAXI J0158-744 system, but we assume 10d in order to make it more compact, and hence a higher density circumbinary medium. Taking the B1/2IIIe donor as 10 and a massive (1.3) WD, then a 10 days period gives an orbital separation, 1.51013cm. We can then use the order of magnitude calculation of the resulting shocked X-ray luminosity, , from Itoh & Hachisu (1990):
| (1) |
where refers to “circumbinary medium”, and is the radius of the shock wave. Taking both and , and 10 (at least this much is normally ejected in a nova explosion), then 1039 erg s-1. This is an order of magnitude or so above that of CI Cam, but the BeX in the SMC have well established, dense equatorial outflows as a result of their rapid rotation (Coe et al., 2005; Madura et al., 2007) and so these parameters are by no means extreme. In addition to accounting for the X-ray flash luminosity, the model also predicts that the SSS turn-on can be seen almost instantly, as the X-ray flash ionizes the ejected shell. Furthermore, if the compact object is a massive O–Ne–Mg WD, then enhanced X-ray emission features at the energies seen in our Swift/XRT spectra would be expected.
3.4. Be+WD Systems in the Magellanic Clouds
There have already been two SSS discovered that appear to be associated with Be mass donors, the first, XMMU J052016.0-692505, in the LMC (Kahabka et al., 2006), the second, XMMU J010147.5-715550, in the SMC (Sturm et al., 2012). The LMC SSS has 1034 erg s-1, whereas the SMC SSS is weaker, at 31034 erg s-1. Both are optically identified with Be systems, and appear to be persistent SSS and variable. Consequently, they are both likely in the steady hydrogen burning phase, and neither have exhibited nova eruptions comparable to MAXI J0158-744. Interestingly, both have reported very long periodicities in their OGLE light curves (510 or 1020 days, and 1264 days for the LMC and SMC sources, respectively), although these are not well constrained due to the limited monitoring timescale. However, such long-term periodicities are now a well-established feature in SMC BeX sources (Rajoelimanana et al., 2011), in many of which the much shorter orbital periods are already well known. Consequently, we dismiss the long periods in these new SSS from being orbital in nature. And in any case, the orbital periods will have to be very much shorter in order to sustain the mass accretion necessary for steady hydrogen burning, as calculated in the previous section.
3.5. Comparison with QSS/SSS in Nearby Galaxies
Over the last decade, many large extragalactic surveys have been undertaken by Chandra and XMM-Newton in order to search for SSS and possibly related systems (so-called quasi-soft sources, or QSS) in nearby galaxies of the Local Group (Di Stefano & Kong, 2003, 2004; Di Stefano et al., 2004; Kong & Di Stefano, 2005). Some of the candidates discovered in these surveys have also reached “ultraluminous” levels, as well as displaying transient behavior. One of the best examples is ULX-1 in M101 (Kong & Di Stefano, 2005). Apart from the much higher implied luminosity, MAXI J0158-744 is quite similar to M101 ULX-1 in many aspects (i.e., temperature, variability). Interestingly, M101 ULX-1 also has a massive companion, a B supergiant counterpart (Kuntz et al., 2005), close to a star formation region. Consequently, it is worth considering whether these are all examples of the same phenomenon.
A popular, but controversial, interpretation of extragalactic QSS and SSS is that they are extreme versions of the stellar-mass BH systems in our Galaxy, wherein the compact object is a much higher, IMBH, 50 in a soft/high accretion state (Di Stefano et al., 2010). However, by considering the similarities between these candidate IMBHs and MAXI J0158-744, we propose that some of the IMBH candidates could instead be a MAXI J0158-744-like object, consisting of a WD accreting from a high-mass donor and undergoing what are essentially classical or recurrent nova outbursts in a high-density environment. According to the work of Di Stefano & Kong (2004), some QSS/SSS may have high-mass companions, based on their association with their host galaxy’s spiral arms. Unfortunately, the main focus of this work was still on the IMBH scenario and the nature of the high-mass companion was not considered in detail.
In fact, more than 40 QSS/SSS candidates have been discovered in M31 by Chandra (Di Stefano et al., 2004). All of them have low blackbody temperatures, and some of them exhibit a harder power-law component in their spectra. After comparing them with our QSS/SSS candidate MAXI J0158-744, we propose that this kind of spectrum could be fully explained by our Be+WD binary model, where the low-temperature blackbody is indeed an accreting WD and the hard power-law component can be attributed to the shock interaction of the nova shell/ejection with the hot stellar wind (or Be equatorial, outflowing disc). Unfortunately, the even greater distances of this population of QSS/SSS make it very difficult to distinguish between various combinations of spectral models. It is therefore essential to obtain much higher quality spectra of these extragalactic systems, so as to probe the true nature of these supposedly IMBH systems.
4. Conclusions
By considering its WD-like radius inferred from the Swift/XRT X-ray spectra (– ) and its B1/2IIIe spectral type deduced from the ESO optical spectrum, we believe that MAXI J0158-744 is a member of the long-sought population of Be–WD binaries, and the first example to possibly enter ULX territory. To account for its properties (very short SSS phase of 15 days) we deduce that MAXI J0158-744 is a heavy (1.35 ) O–Ne WD which is slowly accreting material from the wind of its early-type companion until it undergoes unstable hydrogen burning on the WD surface, in what is essentially a classical nova explosion.
Furthermore, with its location in the SMC, MAXI J0158-744 is a key example of the extreme behavior (apparently ultra-luminous X-ray flash followed by SSS phase) that a nova explosion can lead to if it is in the appropriate environment. It has pointed us in a new direction for understanding the QSS/SSS in external galaxies that have been proposed as IMBH associated with massive companions. If confirmed, it reveals an entirely new sub-class of SSS, showing once again that WDs are capable of mimicking BHs, and possibly even (some) transient ULXs.
References
- Anders & Ebihara (1982) Anders, E., & Ebihara, M. 1982, Geochim. Cosmochim. Acta, 46, 2363
- Arnaud (1996) Arnaud, K. A. 1996, in ASP Conf. Ser. 101, Astronomical Data Analysis Software and Systems V, ed. G. H. Jacoby & J. Barnes (San Francisco, CA: ASP), 17
- Bird et al. (2012) Bird, A. J., Coe, M. J., McBride, V. A., & Udalski, A. 2012, MNRAS, 423, 3663
- Bufano et al. (2009) Bufano, F., Immler, S., Turatto, M., et al. 2009, ApJ, 700, 1456
- Burrows et al. (2005) Burrows, D. N., Hill, J. E., Nousek, J. A., et al. 2005, Space Sci. Rev., 120, 165
- Capalbi et al. (2005) Capalbi, M., Perri, M., Saijia, B., Tamburelli, F., & Angelini, L. 2005, Swift XRT Data Reduction Guide, Version 1.2
- Cardelli et al. (1989) Cardelli, J. A., Clayton, G. C., & Mathis, J. S. 1989, ApJ, 345, 245
- Charles & Coe (2006) Charles, P. A., & Coe, M. J. 2006, in Compact Stellar X-ray Sources, ed. W. Lewin & M. van der Klis (Cambridge: Cambridge Univ. Press), 215
- Coe et al. (2005) Coe, M. J., Edge, W. R. T., Galache, J. L., & McBride, V. A. 2005, MNRAS, 356, 502
- Crampton et al. (1987) Crampton, D., Cowley, A. P., Hutchings, J. B., et al. 1987, ApJ, 321, 745
- Dickey & Lockman (1990) Dickey, J. M., & Lockman, F. J. 1990, ARA&A, 28, 215
- Di Stefano (2010) Di Stefano, R. 2010, ApJ, 712, 728
- Di Stefano & Kong (2003) Di Stefano, R., & Kong, A. K. H. 2003, ApJ, 592, 884
- Di Stefano & Kong (2004) Di Stefano, R., & Kong, A. K. H. 2004, ApJ, 609, 710
- Di Stefano et al. (2004) Di Stefano, R., Kong, A. K. H., Greiner, J., et al. 2004, ApJ, 610, 247
- Di Stefano & Nelson (1996) Di Stefano, R., & Nelson, L. A. 1996, in Supersoft X-Ray Sources, ed. J. Greiner (Lecture Notes in Physics, Vol. 472; Berlin: Springer), 3
- Di Stefano et al. (2010) Di Stefano, R., Primini, F. A., Liu, J., Kong, A., & Patel, B. 2010, Astron. Nachr., 331, 205
- Ebisawa et al. (1996) Ebisawa, K., Asai, K., Mukai, K., et al. 1996, in Supersoft X-Ray Sources, ed. J. Greiner (Lecture Notes in Physics, Vol. 472; Berlin: Springer), 91
- Filippova et al. (2008) Filippova, E. V., Revnivtsev, M. G., & Lutovinov, A. A. 2008, Astron. Lett., 34, 797
- Galache et al. (2008) Galache, J. L., Corbet, R. H. D., Coe, M. J., et al. 2008, ApJS, 177, 189
- Greiner (2000) Greiner, J. 2000, New Astron., 5, 137
- Güver & Özel (2009) Güver, T., & Özel, F. 2009, MNRAS, 400, 2050
- Hachisu & Kato (2009) Hachisu, I., & Kato, M. 2009, ApJ, 694, L103
- Hachisu et al. (1996) Hachisu, I., Kato, M., & Nomoto, K. 1996, ApJ, 470, L97
- Hambly et al. (2001) Hambly, N. C., Irwin, M. J., & MacGillivray, H. T. 2001, MNRAS, 326, 1295
- Hilditch et al. (2005) Hilditch, R. W., Howarth, I. D., & Harries, T. J. 2005, MNRAS, 357, 304
- Hodges-Kluck et al. (2012) Hodges-Kluck, E. J., Bregman, J. N., Miller, J. M., & Pellegrini, E. 2012, ApJ, 747, L39
- Hynes et al. (2002) Hynes, R. I., Clark, J. S., Barsukova, E. A., et al. 2002, A&A, 392, 991
- Itoh & Hachisu (1990) Itoh, H., & Hachisu, I. 1990, ApJ, 358, 551
- Juett et al. (2001) Juett, A. M., Psaltis, D., & Chakrabarty, D. 2001, ApJ, 560, L59
- Kahabka et al. (2006) Kahabka, P., Haberl, F., Payne, J. L., & Filipović, M. D. 2006, A&A, 458, 285
- Kahabka (2006) Kahabka, P., & van den Heuval, E.P.J. 2006, in Compact Stellar X-ray Sources, ed. W. H. G. Lewin & M. van der Klis (Cambridge: Cambridge Univ. Press), 461
- Kato (2010) Kato, M. 2010, Astron. Nachr., 331, 140
- Kennea et al. (2011) Kennea, J. A., Hoversten, E. A., Curran, P., et al. 2011, Atel, 3758, 1
- Kimura et al. (2011) Kimura, M., Tomida, H., Sootome, T., et al. 2011, Atel, 3756. 1
- King et al. (2003) King, A. R., Rolfe, D. J., & Schenker, K. 2003, MNRAS, 341, L35
- Kong & Di Stefano (2005) Kong, A. K. H., & Di Stefano, R. 2005, ApJ, 632, L107
- Kong et al. (2004) Kong, A. K. H., Di Stefano, R., & Yuan, F. 2004, ApJ, 617, L49
- Körding et al. (2011) Körding, E. G., Knigge, C., Tzioumis, T., & Fender, R. 2011, MNRAS, 418, L129
- Kuntz et al. (2005) Kuntz, K. D., Gruendl, R. A., Chu, Y.-H., et al. 2005, ApJ, 620, L31
- Lennon (1997) Lennon, D. J. 1997, A&A, 317, 871
- Li et al. (2011) Li, K.L., Kong, A. K. H., Tam, P.H.T. & Wu, J.H.K. 2011, Atel, 3759, 1
- Liu & Di Stefano (2008) Liu, J., & Di Stefano, R. 2008, ApJ, 674, L73
- Lockley et al. (1997) Lockley, J. J., Eyres, S. P. S., & Wood, J. H. 1997, MNRAS, 287, L14
- Long et al. (1981) Long, K. S., Helfand, D. J., & Grabelsky, D. A. 1981, ApJ, 248, 925
- Madura et al. (2007) Madura, T. I., Owocki, S. P., & Feldmeier, A. 2007, ApJ, 660, 687
- Mukai & Ishida (2001) Mukai, K., & Ishida, M. 2001, ApJ, 551, 1024
- Mukai et al. (2008) Mukai, K., Orio, M., & Della Valle, M. 2008, in AIP Conf. Proc. 1010, A Population Explosion: The Nature & Evolution of X-ray Binaries in Diverse Environments, ed. R. M. Bandyopadhyay, S. Wachter, D. Gelino & C. R. Gelino (Melville, NY: AIP), 143
- Nandra et al. (2005) Nandra, K., Laird, E. S., Adelberger, K., et al. 2005, MNRAS, 356, 568
- Neiner et al. (2011) Neiner, C., de Batz, B., Cochard, F., et al. 2011, AJ, 142, 149
- Nelson et al. (2012) Nelson, T., Donato, D., Mukai, K., Sokoloski, J., & Chomiuk, L. 2012, ApJ, 748, 43
- Nishiyama et al. (2007) Nishiyama, S., Haba, Y., Kato, D., et al. 2007, ApJ, 658, 358
- Nomoto et al. (2007) Nomoto, K., Saio, H., Kato, M., & Hachisu, I. 2007, ApJ, 663, 1269
- Orlandini et al. (2012) Orlandini, M., Frontera, F., Masetti, N., Sguera, V., & Sidoli, L. 2012, ApJ, 748, 86
- Osborne et al. (2011) Osborne, J. P., Page, K. L., Beardmore, A. P., et al. 2011, ApJ, 727, 124
- Page et al. (2010) Page, K. L., Osborne, J. P., Evans, P. A., et al. 2010, MNRAS, 401, 121
- Panagia & Felli (1975) Panagia, N., & Felli, M. 1975, A&A, 39, 1
- Rajoelimanana et al. (2011) Rajoelimanana, A. F., Charles, P. A., & Udalski, A. 2011, MNRAS, 413, 1600
- Rappaport et al. (1994) Rappaport, S., Di Stefano, R., & Smith, J. D. 1994, ApJ, 426, 692
- Rinehart et al. (1999) Rinehart, S. A., Houck, J. R., & Smith, J. D. 1999, AJ, 118, 2974
- Rauch & Deetjen (2003) Rauch, T., & Deetjen, J. L. 2003, in ASP Conf. Ser. 288, Stellar Atmosphere Modeling, ed. I. Hubeny, D. Mihalas, & K. Werner (San Francisco, CA: ASP), 103
- Roming et al. (2005) Roming, P. W. A., Kennedy, T. E., Mason, K. O., et al. 2005, Space Sci. Rev., 120, 95
- Russell & Dopita (1992) Russell, S. C., & Dopita, M. A. 1992, ApJ, 384, 508
- Schaefer (2008) Schaefer, B. E. 2008, AJ, 135, 112
- Sokoloski et al. (2006) Sokoloski, J. L., Luna, G. J. M., Mukai, K., & Kenyon, S. J. 2006, Nature, 442, 276
- Soria et al. (2012) Soria, R., Kuntz, K. D., Winkler, P. F., et al. 2012, ApJ, 750, 152
- Sault & Conway (1999) Sault, R. J., & Conway, J. E. 1999, in ASP Conf. Ser. 180, Synthesis Imaging in Radio Astronomy II, ed. G. B. Taylor, C. L. Carilli, & R. A. Perley 180(San Francisco, CA: ASP), 419
- Sault et al. (1995) Sault, R. J., Teuben, P. J., & Wright, M. C. H. 1995, in ASP Conf. Ser. 77, Astronomical Data Analysis Software and Systems IV, ed. R. A. Shaw, H. E. Payne, & J. J. E. Hayes77 (San Francisco, CA: ASP), 433
- Skrutskie et al. (2006) Skrutskie, M. F., Cutri, R. M., Stiening, R., et al. 2006, AJ, 131, 1163
- Southwell et al. (1996) Southwell, K. A., Livio, M., Charles, P. A., O’Donoghue, D., & Sutherland, W. J. 1996, ApJ, 470, 1065
- Sturm et al. (2012) Sturm, R., Haberl, F., Pietsch, W., et al. 2012, A&A, 537, A76
- Swartz et al. (2004) Swartz, D. A., Ghosh, K. K., Tennant, A. F., & Wu, K. 2004, ApJS, 154, 519
- Tozzi et al. (2006) Tozzi, P., Gilli, R., Mainieri, V., et al. 2006, A&A, 451, 457
- Udalski (2008) Udalski, A. 2008, Acta Astron., 58, 187
- van den Heuvel et al. (1992) van den Heuvel, E. P. J., Bhattacharya, D., Nomoto, K., & Rappaport, S. A. 1992, A&A, 262, 97
- Walborn & Fitzpatrick (1990) Walborn, N. R., & Fitzpatrick, E. L. 1990, PASP, 102, 379
- Weisskopf et al. (2000) Weisskopf, M. C., Tananbaum, H. D., Van Speybroeck, L. P., & O’Dell, S. L. 2000, Proc. SPIE, 4012, 2
- Werner et al. (2003) Werner, K., Deetjen, J. L., Dreizler, S., et al. 2003, in ASP Conf Ser. 288, Stellar Atmosphere Modeling, ed. I. Hubeny, D. Mihalas, & K. Werner (San Francisco, CA: ASP), 31
- Werner & Dreizler (1999) Werner, K., & Dreizler, S. 1999, J. Comput. Appl. Math., 109, 65
- Zampieri & Roberts (2009) Zampieri, L., & Roberts, T. P. 2009, MNRAS, 400, 677