11email: [luciana.federici, carla.cacciari, michele.bellazzini, flavio.fusipecci, silvia.galleti, sibilla.perina] at oabo.inaf.it
The Horizontal Branch luminosity vs metallicity in M31 globular clusters.††thanks: Based on observations made with the NASA/ESA Hubble Space Telescope, obtained from the Hubble Legacy Archive, which is a collaboration between the Space Telescope Science Institute (STScI/NASA), the Space Telescope European Coordinating Facility (ST-ECF/ESA) and the Canadian Astronomy Data Centre (CADC/NRC/CSA). STScI is operated by the Association of Universities for Research in Astronomy, Inc., under NASA contract NAS 5-26555., ††thanks: Photometric catalogs are available at the CDS via anonymous ftp to cdsarc.u-strasbg.fr (130.79.128.5) or via http://cdsarc.u-strasbg.fr/viz-bin/qcat?J/A+A/ and at http://www.bo.astro.it/M31/hstcatalog/
Abstract
Context. Thanks to the outstanding capabilites of the , our current knowledge about the M31 globular clusters (GCs) is similar to our knowledge of the Milky Way GCs in the 1960s-1970s, which set the basis for studying the halo and galaxy formation using these objects as tracers, and established their importance in defining the cosmic distance scale.
Aims. We intend to derive a new calibration of the MV(HB)-[Fe/H] relation by exploiting the large photometric database of old GCs in M31 in the archive.
Methods. We collected the BVI data for 48 old GCs in M31 and analysed them by applying the same methods and procedures to all objects. We obtained a set of homogeneous colour-magnitude diagrams (CMDs) that were best-fitted with the fiducial CMD ridge lines of selected Milky Way template GCs. Reddening, metallicity, Horizontal Branch (HB) luminosity and distance were determined self-consistently for each cluster.
Results. There are three main results of this study: i) the relation MV(HB)=0.25(0.02)[Fe/H]+0.89(0.03), which is obtained from the above parameters and is calibrated on the distances of the template Galactic GCs; ii) the distance modulus to M31 of (m-M)0=24.420.06 mag, obtained by normalising this relation at the reference value of [Fe/H]=–1.5 to a similar relation using V0(HB). This is the first determination of the distance to M31 based on the characteristics of its GC system which is calibrated on Galactic GCs; iii) the distance to the Large Magellanic Cloud (LMC), which is estimated to be 18.540.07 mag as a consequence of the previous results. These values agree excellently with the most recent estimate based on parallaxes of Galactic Cepheid and RR Lyrae stars, as well as with recent methods.
Key Words.:
galaxies: individual: M31 – galaxies: star clusters – catalog – galaxies: Local Group – Techniques: photometric1 Introduction
The globular cluster (GC) system of a galaxy is an important tracer of its oldest stellar component, and hence gives information on the formation and evolution process primarily of the halo, and then of the galaxy as a whole. The systematic study of the Milky Way (MW) GCs, which had started in the ’50s, produced colour-magnitude diagrams (CMD) and metal abundances for 19 GCs that led Searle and Zinn (1978) to challenge the Galaxy formation model proposed by Eggen, Lynden-Bell and Sandage (1962), namely the rapid collapse of a primordial gas cloud probably some 10 billion yr ago. Instead, Searle and Zinn (1978) proposed an accretion model for the Galactic halo of ”transient protogalactic fragments that continued to fall into dynamical equilibrium with the Galaxy for some time after the collapse of its central regions had been completed.” The classic works by Morgan (1959) and Kinman (1959) showed that there are two distinct populations of GCs in the Galaxy. The properties of these two populations were derived by Zinn (1985), who continued and further refined his previous analysis with the addition of CMDs, kinematics and metallicities for 120 GC, and showed that they have a very heterogeneous structure, kinematics and metallicities: the halo population is metal poor ([Fe/H] –0.8) and slowly rotating with a roughly spherical distribution; the disk population is metal rich ([Fe/H] –0.8) and in rapid rotation. The past 20 years of observations have made a dramatic contribution to our knowledge not only of the MW GCs, but also of the GC systems in other galaxies (see Freeman and Bland-Hawthorn 2002 for a review of the first 10 yr of results), and the scenario is now much more detailed and complex.
In this paper we focus our attention on another characteristic of GCs, namely the very important role that they play for of the cosmic distance scale definition, because they host ‘standard candles’ such as RR Lyrae variables (Benedict et al. 2011; Caputo 2012), white dwarfs (Renzini et al. 1996; Hansen et al. 2007), and red giant stars at the very tip of the Red Giant Branch (TRGB) phase (Salaris 2012). Distances were derived for a dozen GCs by fitting their main-sequence with local subdwarfs of known parallaxes (Gratton et al. 2003), and in a few cases by using member eclipsing binaries (Thompson et al. 2010). In addition, the GC system as a whole can be regarded as a standard candle for early-type giant galaxies, because the integrated luminosity function of the metal-poor GC subpopulation peaks at a nearly constant value of MV = –7.660.09 mag (Brodie & Strader 2006; Rejkuba 2012).
The aim of the present study is to exploit the large photometric database of M31 GCs in the archive and use the horizontal branch (HB) luminosity level V(HB) of their individual CMDs to derive a new calibration of the MV(HB)-[Fe/H] relation by comparison with a reference grid of Galactic GCs. Despite of the great progress on distance determinations made in the last decade, there are still significant discrepancies among the results from various methods, also because our requirements have become more stringent in the meantime. Taking for example the Large Magellanic Cloud (LMC) as a reference place for comparing multiple distance indicators for consistency, we see that the individual distances span a range of about 0.10-0.20 mag, depending on the method (Walker 2011). Most of the discrepancies are now due to systematic/calibration effects, and for this reason it is very important to provide a new calibration for such a widely used distance determination tool, based on the established ground of the MW GC system.
The archive presently contains multiband photometric data for 52 old GCs in M31, which can be used to obtain CMDs. These CMDs are still not deep enough to reach the main-sequence turn off (TO) and allow a direct age determination, with the exception of cluster B379, which was observed for 120 orbits and reached about 1.5 mag fainter than the TO (Brown et al. 2004). However, for 48 of these GCs the upper parts of the CMD, namely the HB and the red giant branch (RGB), are clear and well defined, and are quite adequate for estimating important parameters such as metallicity, reddening and distance.111The four clusters not considered in this study lie in the bulge region. They are B109, B115 and B143, whose photometry does not reach the HB (Jablonka et al. 2000), and B112 which was observed only in the JK bands (Stephens et al. 2001). Therefore, the present situation for the GCs in M31 is not much different from the situation of the MW GCs in the 1960s-1970s that set the basis for studying the halo and galaxy formation using these tracers.
We have collected the BVI data for the 48 suitable M31 GCs and analysed them by applying the same methods and procedures throughout to obtain a set of homogeneous CMDs, from which we derive reddening, metallicity, distance, as well as luminosity level of the HB. Much information on reddening and metallicity is available in the literature, but there are large discrepancies between the studies because of different procedures, assumptions and approximations as well as observational errors. It is very important that these parameters are derived in a consistent and comparable way to minimise at least the systematics caused by different data treatment. From these parameters we derive the MV(HB)-[Fe/H] relation defined by the largest and most accurate sample of M31 GCs so far, and also the first determination of the distance to M31 based on the characteristics of its GC system calibrated on Galactic GCs.
This study is the continuation of a long-term programme on the M31 GC system that was started more than two decades ago by our group, which focused on the search for GC candidates (leading to the Revised Bologna Catalogue by Galleti et al. 2004, and web update222http://www.bo.astro.it/M31/, hereafter RBCV4.0), and on the analysis of the properties of as many individual GCs as possible using the outstanding imaging capabilities (Fusi-Pecci et al. 1996, hereafter FFP96; Rich et al. 2005, hereafter R05; Galleti et al. 2006, hereafter G06; Perina et al. 2009, hereafter P09; Perina et al. 2011, hereafter P11).
The data are presented in Sect. 2, the method to derive reddening, metallicity, HB luminosity level and distance is discussed and applied in Sect.3, the HB luminosity vs metallicity relation and its implication for the distance estimate are discussed in Sect. 4, a discussion on systematics is presented in Sect. 5, and the summary and conclusions are given in Sect. 6.
2 The data
2.1 The targets
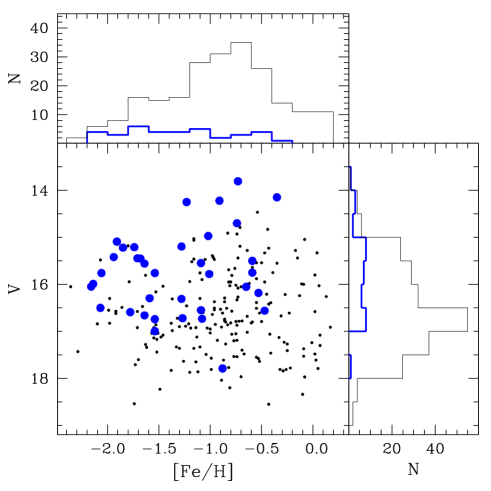
The present sample of 48 GCs, listed in Table 1, corresponds to about 7% of the total currently confirmed GC population in M31 (see RBCV4.0). They were originally selected for observation according to different purposes and criteria, e.g. brightness, colour, metallicity, and position. Therefore, the sample is somewhat biased towards brighter sources, except for those few faint objects that happened to fall into parallel fields. Moreover, the spatial sampling is not uniform, because targets were originally selected either to avoid crowding or because they lay in particularly interesting areas. On the other hand, the metallicity distribution of our targets is likely to be well-representative of the entire GC population, because several studies tried to sample the metallicity range as well as possible. The distribution of our sample is compared to the distribution of the whole catalogue of confirmed M31 GCs in the magnitude-metallicity space in Fig. 1. The values of integrated V cluster magnitude and metallicity (from narrow-band spectrophotometry) were taken from RBCV4.0.
However, none of these possible selection effects should affect our analysis in any significant way.
| GC ID | Ref. | V | X | Y | R | E(B–V) | [Fe/H] | V(HB) | (m-M)0 |
|---|---|---|---|---|---|---|---|---|---|
| (arcmin) | (arcmin) | (arcmin) | |||||||
| B006-G058 | R05 | 15.50 | -6.94 | 27.35 | 28.22 | 0.08 | -0.55 | 25.46 | 24.56 |
| B008-G060 | P09 | 16.56 | -15.45 | 19.89 | 25.18 | 0.07 | -1.00 | 25.26 | 24.45 |
| B010-G062 | P09 | 16.66 | -16.70 | 18.62 | 25.01 | 0.16 | -1.80 | 25.28 | 24.30 |
| B012-G064 | R05 | 15.09 | -10.77 | 22.98 | 25.38 | 0.11 | -1.80 | 25.05 | 24.31 |
| B023-G078 | P09 | 14.22 | -13.79 | 13.83 | 19.53 | 0.28: | -0.90: | 25.91: | 24.26: |
| B027-G087 | R05 | 15.56 | -26.42 | 0.88 | 26.43 | 0.18: | -1.66: | 25.53: | 24.52: |
| B045-G108 | R05 | 15.78 | 7.29 | 20.22 | 21.50 | 0.16 | -0.90 | 25.62 | 24.55 |
| B058-G119 | P11 | 14.97 | -28.82 | -10.19 | 30.57 | 0.11 | -1.40 | 25.25 | 24.35 |
| B088-G150 | P09 | 15.42 | 9.99 | 13.33 | 16.66 | 0.38 | -1.90 | 25.99 | 24.44 |
| B158-G213 | P09 | 14.70 | -3.44 | -9.88 | 10.47 | 0.09: | -0.90: | 25.44: | 24.42: |
| B220-G275 | P09 | 16.55 | 22.36 | -5.14 | 22.95 | 0.06 | -1.70 | 25.15 | 24.48 |
| B224-G279 | P09 | 15.45 | 21.87 | -7.34 | 23.07 | 0.07: | -1.80: | 25.14: | 24.45: |
| B225-G280 | P09 | 14.15 | 16.48 | -12.19 | 20.50 | 0.05: | -0.50: | 25.35: | 24.55: |
| B233-G287 | R05 | 15.76 | 35.45 | -0.20 | 35.45 | 0.10 | -1.53 | 25.25 | 24.43 |
| B240-G302 | R05 | 15.21 | 11.02 | -29.81 | 31.78 | 0.14 | -1.66 | 25.23 | 24.34 |
| B292-G010 | P11 | 16.99 | -58.48 | 47.17 | 75.13 | 0.15 | -1.90 | 25.39 | 24.50 |
| B293-G011 | R05 | 16.29 | -61.86 | 43.64 | 75.70 | 0.12 | -1.70 | 25.25 | 24.44 |
| B298-G021 | M07 | 16.59 | -58.25 | 22.80 | 62.55 | 0.09 | -1.80 | 25.17 | 24.49 |
| B311-G033 | R05 | 15.44 | -57.57 | 0.99 | 57.57 | 0.25 | -1.75 | 25.49 | 24.31 |
| B336-G067 | P11 | 17.81 | 28.13 | 49.44 | 56.88 | 0.10 | -1.90 | 25.28 | 24.50 |
| B337-G068 | P11 | 16.73 | 30.99 | 51.44 | 60.06 | 0.06 | -1.30 | 25.24 | 24.40 |
| B338-G076 | R05 | 14.25 | -44.09 | -9.05 | 45.01 | 0.04 | -1.20 | 25.01 | 24.32 |
| B343-G105 | R05 | 16.31 | -57.45 | -30.05 | 64.83 | 0.10 | -1.50 | 25.41 | 24.61 |
| B350-G162 | P11 | 16.74 | -42.29 | -29.21 | 51.40 | 0.11 | -1.80 | 25.25 | 24.45 |
| B358-G219 | R05 | 15.22 | -64.55 | -58.61 | 87.19 | 0.05 | -1.91 | 25.16 | 24.62 |
| B366-G291 | P09 | 15.99 | 51.62 | 11.50 | 52.88 | 0.09 | -1.80 | 25.30 | 24.53 |
| B379-G312 | R05 | 16.18 | -3.67 | -49.65 | 49.79 | 0.13 | -0.50 | 25.50 | 24.25 |
| B384-G319 | R05 | 15.75 | -20.90 | -69.01 | 72.10 | 0.04 | -0.50 | 25.33 | 24.46 |
| B386-G322 | R05 | 15.55 | 61.67 | -4.30 | 61.82 | 0.04 | -1.10 | 25.16 | 24.46 |
| B405-G351 | R05 | 15.19 | 63.69 | -48.84 | 80.26 | 0.08 | -1.55 | 25.38 | 24.60 |
| B407-G352 | P09 | 16.05 | 71.53 | -49.72 | 87.11 | 0.10 | -0.40 | 25.41 | 24.35 |
| B468 | R05 | 17.79 | -66.18 | -58.58 | 88.39 | 0.06 | -0.70 | 25.41 | 24.45 |
| B514-MCGC4 | G06 | 15.76 | -242.32 | -15.11 | 242.79 | 0.09 | -1.91 | 25.14 | 24.48 |
| B531 | P11 | 19.63 | -59.10 | 47.17 | 75.62 | 0.14 | -0.40 | 25.58 | 24.33 |
| B255D-D072 | P09 | 18.97 | 53.69 | 12.71 | 55.17 | 0.14 | -0.70 | 25.50 | 24.38 |
| MCGC1-B520 | M07 | 16.05 | -182.12 | 91.29 | 203.72 | 0.12 | -2.15 | 25.17 | 24.45 |
| MCGC2-H4 | M07 | 16.98 | -90.47 | 115.36 | 146.61 | 0.10 | -1.90 | 25.02 | 24.30 |
| MCGC3-H5 | M07 | 16.31 | -67.02 | 122.53 | 139.67 | 0.10 | -1.90 | 25.05 | 24.35 |
| MCGC5-H10 | M07 | 16.09 | -315.17 | -141.46 | 345.46 | 0.11 | -1.90 | 25.26 | 24.50 |
| MCGC7-H14 | M07 | 18.27 | 25.99 | 75.37 | 79.73 | 0.06 | -0.70 | 25.18 | 24.20 |
| MCGC8-H23 | M07 | 16.72 | 11.26 | -162.31 | 162.70 | 0.09 | -1.53 | 25.30 | 24.53 |
| MCGC9-H24 | M07 | 17.78 | 161.35 | -55.63 | 170.67 | 0.16 | -1.40 | 25.38 | 24.25 |
| MCGC10-H27 | M07 | 16.50 | -66.57 | -435.83 | 440.88 | 0.09 | -1.90 | 25.15 | 24.50 |
| G001-MII | R05 | 13.81 | -149.69 | 29.32 | 152.54 | 0.04 | -0.90 | 25.23 | 24.56 |
| MCEC1-HEC5 | M06 | 17.60 | -5.64 | 58.24 | 58.51 | 0.10 | -1.91 | 25.17 | 24.48 |
| MCEC2-HEC71 | M06 | 17.10 | 128.39 | 97.87 | 161.44 | 0.13 | -1.75 | 25.31 | 24.51 |
| MCEC3-HEC41 | M06 | 17.60 | -57.17 | 22.57 | 61.47 | 0.09 | -1.91 | 25.08 | 24.42 |
| MCEC4-HEC12 | M06 | 18.84 | -36.22 | -261.42 | 263.92 | 0.11 | -1.78 | 25.14 | 24.33 |
2.2 The colour-magnitude diagrams
The CMDs of the 48 GCs considered in this paper were all obtained by our research group, using data taken with the Faint Object Camera (FOC, one cluster only, B405), Wide Field Planetary Camera 2 (WFPC2) and Advanced Camera for Surveys (ACS) from our own observing programs, or extracted from the archive if observed by other programs.444The photometric data were converted to the BVI magnitudes of the Johnson standard system according to FFP96 for the FOC F430W (B) and F480LP (V) filters, Holtzman et al. (1995) for the WFPC2 F555W (V) and F814W (I) filters, and Sirianni et al. (2005) for the ACS F606W (V) and F814W (I) filters. They can be divided into two subsets: i) those that were observed and processed by us using the data reduction photometric package ROMAFOT (18 clusters from R05); ii) those that were processed by us using DOLPHOT (one external cluster from G06; 11 clusters from P09; 5 clusters from P11, 4 extended clusters from Mackey et al. 2006, hereafter M06; 9 clusters in the external regions of M31 from Mackey et al. 2007, hereafter M07).
The CMDs of the clusters can be considered as homogeneous within the errors even though they were processed with different packages and somewhat different procedures. A special case is G011, the only cluster that has been observed twice with the WFPC2 V and I bands. The first set of data, obtained in 1999 to study its CMD, was processed with ROMAFOT and the resulting CMD, presented by R05, is the one used in the present analysis. The second set of data, obtained in 2007 to study the variable stars, was processed with HSTPHOT and the resulting CMD will be presented by Contreras et al. (2012). These two CMDs are entirely equivalent despite the different photometric accuracy and scatter around the ridge lines, and support our previous claim that all CMDs processed by our group can be considered as homogeneous within the errors, irrespective of the packages and procedures applied in the data reduction and analysis.
The CMDs of the 13 clusters observed and studied by M06 and M07 were re-derived in the present study by applying the same data reduction and analysis criteria and procedures as described e.g. by P09 to the archive data. The resulting CMDs are, as expected, very similar to those obtained by M06 and M07, and hence our values for the metallicity, distance modulus and extinction are comparable to the M06 and M07 results. The re-reduction step was nevertheless necessary to ensure the complete homogeneity of our database.
The different procedures in the original determination of the respective V(HB) level are superseded by the homogeneous procedure applied to all clusters in this study (see Sect. 3.4).
The CMDs were all decontaminated from the field contribution, except seven (MCGC1, MCGC2, MCGC3, B514, MCGC5, MCGC9, MCGC10) for which the field contamination is negligible, and three (B158, B220 and B224) for which the decontamination procedure is statistically unreliable because of the strong difference in completeness between the very crowded cluster and the field. In several clusters, blended stars in the innermost regions were also eliminated. The cleaned CMDs are shown in Fig. 2. The original observed CMDs have been published in the quoted papers.


3 Reddening, metallicity and distance from the CMD
3.1 The method
As described in detail e.g. in R05, M07, P09 and P11, estimates of reddening, metallicity and distance are obtained simultaneously by comparing the observed CMDs of the M31 GCs with the CMD ridge lines of a set of reference Galactic GCs that are selected to sample a wide range of metallicity. We briefly recall here the basic steps of this procedure, and refer the reader to P09 for a more detailed description and discussion.
| ID | [Fe/H]ZW | E(B–V) | Phot. | |
|---|---|---|---|---|
| dex | mag | |||
| NGC6341 (M92) | -2.24 | 0.031 | 14.84 | VI |
| NGC7078 (M15) | -2.15 | 0.084 | 15.51 | BV,VI |
| NGC4147 | -1.80 | 0.018 | 16.48 | BV |
| NGC5272 (M3) | -1.66 | 0.018 | 15.11 | VI |
| NGC6205 (M13) | -1.65 | 0.019 | 14.50 | BV |
| NGC5904 (M5) | -1.40 | 0.034 | 14.43 | BV,VI |
| NGC6723 | -1.12 | 0.044 | 14.73 | BV |
| NGC104 (47Tuc) | -0.71 | 0.023 | 13.33 | BV,VI |
| NGC5927 | -0.30 | 0.399 | 15.81 | BV,VI |
-
•
The reference Galactic GCs (GGC) used in the present study are listed in Table 2. They sample a metallicity range of [Fe/H]= –0.30 to –2.24 dex where the values of metallicity are taken from Zinn (1985) in the Zinn and West (1984, hereafter ZW84) metallicity scale for homogeneity with the previous studies. The CMD ridge lines of the template clusters are transferred to the MV vs. intrinsic colour plane by using the reddening values and the distance moduli in Table 2, which were taken from Dotter et al. (2010). The reasons for choosing this database rather than Harris’ (1996) database of MW GCs properties is discussed in detail in Sect. 5.1.
-
•
We searched for the set of parameters (distance, reddening and metallicity) for each M31 GC leading to the best match between its observed RGB and HB and the corresponding ridge lines of the reference clusters, according to the relations: AV = 3.1E(B – V), AI = 1.94E(B – V) and E(V – I) = 1.375E(B – V) (Schlegel et al. 1998). Colour and magnitude shifts are applied iteratively to the observed RGB and HB until a satisfactory match with a template is found.
-
•
From these shifts we simultaneously estimated reddening and distance, while the metallicity was estimated by interpolation between the two RGB template lines that bracket the observed RGB. The best fit with the HB ridge lines leads also to an estimate of V(HB), as described in more detail in Sect. 3.4.
The best fit (by eye) of the observed and template CMDs, which implies a shift in magnitude (due to distance and absorption) and a shift in colour (due to reddening and metallicity) is not quite trivial and requires a careful evaluation and a number of iterations. However, in most cases, where the various branches of the CMD are well populated and defined, the pairs of reddening and metallicity values can be derived with a good degree of confidence and reliability. The values obtained with this procedure are listed in Table 1. Typical errors are about 0.04 mag for reddening, 0.25 dex for metallicity and 0.10 mag for V(HB), except for the clusters B023, B027, B158, B224 and B225 where the HBs are not well defined and hence these estimates, in particular V(HB), are more uncertain. These clusters were not used in the analysis described in Sect. 4, but are shown for comparison along with the results obtained for the remaining 43 clusters.
Estimates of reddening and metallicity were derived in previous studies with spectroscopic and photometric techniques, and we compare them with our results in the following subsections.
3.2 Reddening
A detailed description of previous reddening estimates for individual GCs in M31 is given in R05. More recent studies are those by i) Fan et al. (2008), based on correlations between optical and infrared colours and metallicity, combined with the use of various reddening-free parameters (as in Barmby et al. 2000); ii) Montalto et al (2009), based on a multiwavelength (far UV to IR) photometric study of dust properties; and iii) Caldwell et al. (2011), based on 5Å resolution spectra of target clusters compared to flux-calibrated spectra of reference clusters with similar metallicity that were dereddened using the Barmby et al. (2000) values.
The comparison of our results with these studies as a function of metallicity is shown in Fig. 3. The values estimated by Fan et al. (2008) and Caldwell et al. (2011) do not show any trend with respect to ours, and are offset by 0.040.05 and 0.060.05 mag, respectively, reproducing the general pattern of Barmby et al. (2000) results, which were used as calibrating reference frame in both these studies. The Montalto et al. (2009) results, which are based on an entirely independent study of dust properties, show a larger scatter and overestimate the reddening with respect to ours by 0.040.11 mag. This might suggest that the dust properties considered by Montalto et al. (2009) are not well represented by the photometric and spectroscopic properties of the cluster integrated light.
The impact of systematics in the reddening determination on the results of the present analysis is discussed in Sect. 5.2.

3.3 Metallicity
Previous estimates of metallicity have been described and discussed in detail by R05. Additional metallicity values have been obtained more recently, by Galleti et al. (2009), Colucci et al. (2009), and Caldwell et al. (2011). The Galleti et al. (2009) and Caldwell et al. (2011) estimates have been obtained from spectro-photometric Lick indices calibrated on well-studied Galactic GCs. We show in Figure 4 the comparison of these values with our estimates from CMD fitting, which appear to be systematically underestimated by 0.09-0.12 dex, well within the r.m.s. error of 0.25 dex of these estimates.

On the other hand, Colucci et al. (2009) obtained high-resolution spectra of five M31 GCs and derived metallicities from FeI and FeII lines, as well as other elements. Four of these five clusters are included in our database, and we show in Fig. 4 that the results based on FeI are virtually identical to ours ([Fe/H]=0.020.22 dex). Moreover, there is a systematic difference of 0.2 dex between the estimates based on FeI and FeII lines. This is an interesting piece of information, because the metallicites based on FeI lines are considered to be more robust because of the larger number of lines and the lower dependence on gravity. It also stresses the importance of using homogenous values for the parameters involved in global comparisons, in particular for the metallicity scale.
The impact of systematics in the metallicity determination on the results of the present analysis is discussed in Sect. 5.3.
3.4 The HB magnitude level V(HB)
The HB is particularly important in a GC CMD, because it gives information on two fundamental subjects: i) the characteristics and evolution of the stellar component(s), via the HB morphology; and ii) the cluster distance, via the HB luminosity. The matter of the HB morphology and its implications will be treated in a forthcoming paper (Perina et al. 2012, in preparation), here we only deal with the HB luminosity level as a distance indicator.
In the present study as in P09, we estimated the value of V(HB) using the magnitude level of the best-fitting template HB ridge line at (V–I)0=0.5 or (B–V)0=0.3, corresponding to the middle of the instability strip, for the intermediate and metal-poor clusters. The reasons for applying this procedure are that in several clusters the HB population is quite low and a running box procedure (which we used e.g. in R05) is less reliable, and that we aim at deriving all quantities (reddening, metallicity, distance) from the application of the same self-consistent CMD best-fitting method.
In the metal-rich clusters the HB is only populated on the red clump (RC), which is easily identifiable on the RGB luminosity function. According to stellar evolution theory (e.g. Lee et al. 1994), the RC is slightly brighter than the average HB luminosity within the instability strip, if RR Lyrae variables were present in these metal-rich clusters. For consistency with the intermediate and metal-poor clusters discussed above, we need to correct the V(RC) mag to transfer it to the level of the corresponding theoretical instability strip. The size of this correction ranges from 0.05 to 0.12 mag according to different Zero Age Horizontal Branch (ZAHB) models (see FFP96 for more details), and we adopted a correction of +0.08 mag for the clusters with [Fe/H]–1.0 dex, for consistency with most previous studies (Sarajedini et al. 1995; Ajhar et al. 1996; Catelan & de Freitas Pacheco 1996) as well as with our own studies (FFP96, R05, P09). We note, however, that in some cases (e.g. Harris 1996, 2010 edition of his GGC online Catalogue)666http://www.physics.mcmaster.ca/Globular.html this correction is not applied, and what appears as V(HB) in the metal-rich clusters is actually the mean V(RC).
The values of V(HB) estimated and adopted for the present analysis are listed in Table 1.
In conclusion, our estimates of reddening and metallicity obtained with the CMD-fitting method described above generally agree well with most previous estimates based on different methods. Since the aim of the present work is to ensure the homogeneity of our data set, we adopt in the following analysis the self-consistent set of values of reddening, metallicity and distance obtained from our CMD fitting method, which are listed in Table 1.
4 The HB luminosity-metallicity relation
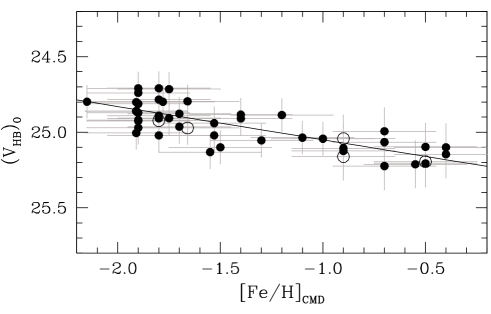
We show in Fig. 5 the distribution of the V(HB)0 values as a function of [Fe/H] for our 48 target clusters using the data in Table 1. Because there are errors in both V(HB)0 and [Fe/H], we have applied an orthogonal least-squares program to determine the linear regression, and jackknife resampling simulations for the error analysis of the relation (Feigelson & Babu 1992). The five GCs mentioned in Sect. 3.1 were not used in this fitting procedure, and are shown as open symbols for completeness and comparison. We find:
| (1) |
This relation does not change significantly when the five GCs that were left out are included, therefore our procedure and results appear to be sufficiently reliable and accurate, within the errors, even in those cases where the CMD is less well defined. In this relation the individual cluster distances are not taken into account, therefore in addition to the errors on photometry and metallicity determination, the scatter of the distribution is partly due to line-of-sigth depth effects, because some of the most discrepant clusters may be located significantly far away in the background or foreground with respect to the main M31 cluster population (see e.g. M07). The reddening also contributes to the scatter, especially when the CMD is not defined sufficiently well to break the reddening-metallicity degeneracy.
By considering the individual cluster distance moduli derived from the CMD fitting procedure that are listed in Table 1, and using the same statistical procedure as for eq. (1), we obtain the relation:
| (2) |
which is shown in Fig. 6.
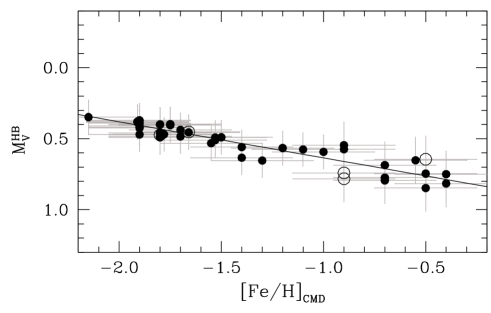
Eq. (2) is obviously better defined than eq. (1) because the scatter due to line-of-sight depth effects has been corrected for. This shows and confirms that the method we used for our analysis is able to estimate the individual cluster distances sufficiently well to significantly reduce the scatter in the distribution of a collective sample property. The different slopes of eq.s (1) and (2) are well compatible within the errors. It is worth noting here that without the correction of 0.08 mag applied to the observed V(HB) in metal-rich GCs (see Sect. 3.4) the slope of eq.s (1) and (2) would be flatter ( 0.15-0.19, respectively).
By normalising eq.s (1) and (2) near the middle of the metallicity range, i.e. at [Fe/H]=–1.5 for convenience, where =24.940.05 mag from eq.(1) and (HB)=0.520.04 mag from eq.(2), we derive a distance modulus of 24.420.06 mag for M31. This result can be regarded as an independent distance determination to M31 based on the distance scale set by the Milky Way GCs. It agrees excellently with the average value of the distances to M31 derived during the past two decades using Cepheids, carbon-rich stars, TRGB and RC stars, and eclipsing binaries (cf. Vilardell et al. 2006; 2010, and references therein), and in particular with the Riess et al. (2012) result based on 68 classical Cepheids.
We therefore propose eq. (2) as a reliable result of our analysis, which leads to a distance modulus for the LMC of 18.540.07 mag based on the Clementini et al. (2003) RR Lyrae data ( = 19.064 0.064 mag at [Fe/H] = –1.5). This result agrees very well with the most recent calibration of the (RR)-[Fe/H] relation (Benedict et al. 2011), which is based on trigonometric parallaxes for a few classical Cepheids and RR Lyrae variables in the MW as well as on other distance estimates, and yields a distance modulus for the LMC of 18.550.05 mag.
A review by Clementini (2009) of the distance determinations to the LMC obtained during the past decade using pulsating variable stars lists values of (m-M)0 ranging from 18.39 to 18.58 mag with a mean value of 18.52 0.01 mag (internal rms error only). Quasi-geometric distances from detached eclipsing binary systems (Fitzpatrick et al. 2003; Pietrzynski et al. 2009; Bonanos et al. 2011) lead to a mean distance modulus of 18.49 0.04 mag. Several of these individual studies quote internal errors of less than 0.05 mag, so we are presently in a situation where systematic (calibration) errors dominate.
A more accurate and robust determination of the distance to M31 (as well as to the LMC) is expected to be possible in the near future from ongoing developments, e.g. the study of Cepheids in the IR to minimise the effects of metallicity and reddening (Freedman et al. 2011), and direct water maser observations (Darling 2011). Significant improvement is also expected from all other distance determination methods thanks to better observations and calibrations, and eventually from Gaia parallaxes (for the LMC) and proper motions of point-like sources brighter than V20 combined with a galaxy rotation model (for M31).
5 The impact of systematics on the relation
5.1 The relation of the reference GGCs
To report the observed CMDs of the MW reference GCs to the absolute luminosity plane , we used in previous studies the distance moduli from the Harris (1996) 2003 edition of his GGC online Catalogue, which were obtained by assuming the GGCs HB luminosity-metallicity relation MV(HB)=0.16[Fe/H]+0.84 calibrated on several different distance determination methods. In the present study we instead used the Dotter et al. (2010) distances, which were obtained from the best fit of the GGC main sequences with theoretical isochrones. We preferred to use this set of data because of the better accuracy of the observed CMDs (from /ACS photometry), the homogeneity of the analysis and the independence of the distance determination from the HB luminosity. The HB luminosity-metallicity relation found by Dotter et al. (2010)777See their eq.(1) and its transformation to =0.235([Fe/H]+1.6)+0.53 is derived as a result of an independent analysis, and provides a consistency check to their procedure. The fact that the Dotter et al. relation is quite compatible with ours within the errors confirms that the M31 and MW GCs are indeed of a similar nature and share similar evolutionary properties, as we assumed at the beginning of our work. The only way to break the dependence on this assumption can be provided by individual M31 GC distance determinations based on geometric or trigonometric methods, whenever they will be available.
5.2 The assumed reddening
The reddening can play an important role by affecting the value of , and hence increasing the scatter and mimicking a distance effect.
The comparison with other reddening estimates, presented and discussed in Sect. 3.2, shows that our E(B–V) estimates are on average about 0.03, 0.04 and 0.06 mag smaller than those by Barmby et al (2000), Fan et al. (2008) and Caldwell et al. (2011), respectively. The differences are within the combined errors of the quoted estimates with ours, and hence are hardly significant, but for the sake of completeness we can estimate how an offset of -0.05 mag in our reddening values would affect our results: the correction for such an offset would make our colours bluer by the same amount and our values brighter by 0.15 mag, thus shifting the overall metallicity distribution towards lower metallicities. This would lead to a worse (and in most cases very poor or impossible) match between the observed and the template RGBs because of the dependence of the RGB shape on metallicity.
5.3 The assumed metallicity
Using a different metallicity scale, for example the scale derived by Carretta et al. (2009), leads to the relation
| (3) |
which is basically identical to eq. (2) within the errors.
With respect to other metallicity estimates of the target clusters (see Sect. 3.3 and Fig. 4), our results agrees very well with high-resolution spectroscopy (Colucci et al. 2009), but seem to underestimate the metallicity by about 0.1 dex with respect to spectro-photometric studies (Galleti et al. 2009; Caldwell et al. 2011). Again, this discrepancy is hardly significant, because it is well within the 1 error of 0.25 dex. In addition, a metallicity underestimate is at odds with the systematics on reddening (if significant) discussed in the previous section, which would rather require the metallicity to be overestimated.
Therefore, the method of CMD best fitting, which simultaneously constrains reddening and metallicity, should ensure that systematic biases in our estimates, if any, are minimised within the quoted errors for these determinations.
5.4 Comparison with other relationships
5.4.1 From empirical methods
Various empirical methods have been applied during the past decades to estimate the absolute magnitude of the HB (or of the RR Lyrae) stars and its dependence on metallicity. The most widely used methods include the Baade-Wesselink (B-W) analysis of field RR Lyraes, statistical and trigonometric parallaxes of RR Lyrae and BHB field stars, GC distance determination via main-sequence fitting and hence luminosities for RR Lyrae and BHB members. We refer the interested reader to Cacciari & Clementini (2003) for a review.
From the observational point of view, the mean magnitude level of the HB in any given cluster, as defined in Sect. 3.4, is equivalent to the mean magnitude of the RR Lyrae stars in that cluster, i.e. V(HB)=V(RR).
The dependence of this luminosity on metallicity ranged from a slope 0.27-0.37 mag dex-1 (Sandage 1993; McNamara 1997; Feast 1997; Reid 1997) to 0.13-0.23 mag dex-1 (Fernley et al. 1998 and references therein; Chaboyer 1999; Gratton et al. 2004; R05). A fairly accurate and widely quoted result is the slope of 0.214 0.047 from the photometric and spectroscopic study of about 100 RR Lyrae stars in the bar of the LMC by Clementini et al. (2003), who found that a unique linear relation over the entire considered metallicity range was adequate to fit the data. The slope of our eq. (3) agrees excellently with this estimate.
The zero-point of this relation was determined according to the various methods applied, and varied significantly (0.2 mag) from one study to another, as shown by its impact on the LMC distance estimates (cf. Sect. 4). In this respect, one also has to consider the intrinsic dispersion in MV due to evolutionary effects (see next section 5.4.2). The width of the HB as a function of metallicity was estimated empirically from the inspection of 14 GGCs by Sandage (1993), who expressed it as . This contributes to the error associated to the mean estimated values of V(HB) or V(RR), especially when relatively few stars are considered.
5.4.2 From evolution and pulsation models
Evolutionary models of Zero-Age Horizontal Branch (ZAHB) stars as well as pulsation models of RR Lyrae variables can provide an estimate of or , respectively, as a function of metallicity (Caputo 2011). In this case, however, and are not equivalent, because the ZAHB represents the lower envelope of the HB locus, where the stars spend less than 10% of their total HB lifetime, the remaining time being spent off the ZAHB at 0.1-0.2 mag brighter luminosities. Therefore, the observed mean HB (including the RR Lyrae stars) is represented by the main body ( 90%) of the stellar population, which is in a more advanced stage of evolution, and hence brighter than the ZAHB. This is usually taken into account by correcting the theoretical by a constant offset (0.10 mag) or by a linear function of metallicity, such as that derived empirically by Sandage (1993), which we quoted in Sect. 5.4.1.
Some theoretical studies of stellar evolution and pulsation have derived linear relationships between or and metallicity, with slopes that in general agree well with the empirical results described above (Caloi et al. 1997; Demarque et al. 2000; Marconi & Clementini 2005). The zero-point of these theoretical relations can differ by as much as 0.15 mag owing to the different assumptions that affect the absolute calibration.
These studies did not find any clear evidence for a change in slope at [Fe/H] = –1.5. However, other studies have suggested that the relation could be better approximated by a non-linear function. The non-linearity can be expressed as two linear relations changing slope at the breaking point [Fe/H] –1.5, as proposed by McNamara (1999) based on RR Lyrae empirical data, and by Caputo et al. (2000) based on stellar pulsation models. Both studies found that the metal-poor part of this relation was less steep (nearly flat according to McNamara) than the metal-rich part. Alternatively, a quadratic relation between and metallicity was supported by several HB stellar evolution models (Dorman 1992; Cassisi et al. 1999; VandenBerg et al. 2000; Catelan et al. 2004; Pietrinferni et al. 2006) and pulsation models (Bono et al. 2007), and was confirmed by empirical HB data for 61 Galactic GCs (Ferraro et al. 1999).
Our data do not show any significant deviation from a linear trend. The error bars are clearly larger than those of MW field or GC data, nevertheless the relation is well defined.
6 Summary and Conclusions
We have collected a homogeneous and uniform set of CMDs for 48 old GCs in M31 obtained from BVI data, to investigate the global characteristics of population II stars in this galaxy and compare them with those of the Milky Way.
Of these CMDs, 35 were originally produced by our team during more than a decade using basically the same criteria and procedures, and 13 were obtained by another group and re-derived by us to ensure the best possible homogeneity of the entire CMD set.
These CMDs were compared with template CMD ridge lines of selected Galactic GCs, and the best fit led to the simultaneous determination of reddening, metallicity, luminosity level of the horizontal branch and distance for each cluster.
This set of parameters allowed us to derive the relation
, where [Fe/H] is the cluster metallicity in the ZW84 scale.
By normalising this relation at the reference value of [Fe/H]=–1.5 to a similar relation using the apparent dereddened HB magnitude (HB), we derived the distance modulus (M31)=24.420.06 mag. This result agrees excellently with previous estimates from various distance indicators, and we consider it a robust and reliable estimate.
This is the first determination of the distance to M31 based on the characteristics of its GC system calibrated on Galactic GC analogues.
The above relation also leads to a distance to the LMC of 18.540.07 mag, which excellently agrees with the value found by Benedict et al. (2011) using the parallaxes of classical Cepheids and RR Lyrae stars in the MW, as well as other distance determinations.
Acknowledgements.
We acknowledge the support by INAF through the PRIN-INAF 2009 grant CRA 1.06.12.10 (PI: R. Gratton) and by ASI through contracts COFIS ASI-INAF I/016/07/0 and ASI-INAF I/009/10/0.References
- (1) Ajhar, E. A., Grillmair, C. J., Lauer, T. R., Baum, W. A., Faber, S. M., Holtzman, J. A., Lynds, C. R., & O’Neil, E. J., Jr. 1996, AJ, 111, 1110
- (2) Barmby, P., Huchra, J.P., Brodie, J.P., Forbes, D.A., Schroder, L.L., & Grillmair, C.J 2000, AJ, 119, 727
- (3) Benedict, G.F., McArthur, B.E., Feast, M.W. et al. 2011, AJ, 142, 187
- (4) Bonanos, A.Z., Castro, N., Macri, L.M. & Kudritzki, R.P 2011, ApJ, 729, L9
- (5) Bono, G., Caputo, F. and Di Criscienzo, M. 2007, A&A, 476, 779
- (6) Brodie, J.P., & Strader, J. 2006, ARA&A, 44, 193
- (7) Brown, T.M., Ferguson, H.C., Smith, E. et al. 2004, ApJ, 613, L125
- (8) Cacciari, C. & Clementini, G. 2003, in Stellar Candles for the Extragalactic Distance Scale, Ed.s D. Alloin and W. Gieren, Lecture Notes in Physics, Vol. 635, p.105
- (9) Caldwell, N., Schiavon, R., Morrison, H., Rose, J.A. and Harding, P. 2011 AJ, 141, 61
- (10) Caloi, V., D’Antona, F. and Mazzitelli, I. 1997, A&A, 320, 823
- (11) Caputo, F. 2012, Ap&SS, in press (Online First)
- (12) Caputo, F., Castellani, V., Marconi, M. and Ripepi, V. 2000, MNRAS, 316, 819
- [ (2009) Carretta, E., Bragaglia, A., Gratton, R., D’Orazi, V. and Lucatello, S. 2009, A&A, 508, 695
- (14) Cassisi, S., Castellani, V., Degl’Innocenti, S., Salaris, M. and Weiss, A. 1999, A&AS, 134, 103
- (15) Catelan, M. & de Freitas Pacheco, J.A. 1996, PASP, 108, 166
- (16) Catelan, M., Pritzl, B.J. & Smith, H.A. 2004, ApJS, 154, 633
- (17) Chaboyer, B. 1999, Astrophysics & Space Science, 237, 111
- (18) Clementini, G., Gratton, R., Bragaglia, A., Carretta, E., Di Fabrizio, L. and Maio, M. 2003, AJ, 125, 1309
- (19) Clementini, G. 2009, in The Magellanic System: Stars, Gas, and Galaxies, IAU Symp. Vol. 256, p. 373 (arXiv:0906.1674)
- (20) Colucci, J.E., Bernstein, R.A., Cameron, S., McWilliam, A. & Cohen, J.G. 2009, ApJ, 704, 385
- (21) Contreras Ramos, R., Clementini, G., Federici, L. et al. 2012, in preparation
- (22) Darling, J. 2011, ApJ, 732, L2
- (23) Demarque, P., Zinn, R., Lee, Y-W. and Yi, S. 2000, AJ, 119, 1398
- (24) Dorman, B. 1992, ApJS, 81, 221
- (25) Dotter, A., Sarajedini, A., Anderson, J. et al. 2010, ApJ, 708, 698
- (26) Eggen, O.J., Lynden-Bell, D. & Sandage, A.R. 1962, ApJ, 136, 748
- (27) Fan, Z., Ma, J., de Grijs, R. and Zhou, X. 2008, MNRAS, 385, 1973
- (28) Feast, M.W. 1997, MNRAS, 284, 761
- (29) Feigelson, E.D., & Babu, G.J. 1992, ApJ, 397, 55
- (30) Fernley, J., Carney, B.W., Skillen, I., Cacciari, C. and Janes, K. 1998, MNRAS, 293, L61
- (31) Ferraro, F.R., Messineo, M., Fusi Pecci, F. et al. 1999, AJ, 118, 1738
- (32) Fitzpatrick, E.L., Ribas, I., Guinan, E.F., Maloney, F.P. & Claret, A. 2003, ApJ, 587, 685
- (33) Freedman, W.L., Madore, B.F., Scowcroft, V., et al. 2011, AJ, 142, 192
- (34) Freeman, K.C. & Bland-Hawthorn, J. 2002, ARA&A, 40, 487
- (35) Fusi Pecci, F., Buonanno, R., Cacciari, C., et al. 1996, AJ, 112, 1461 [FFP96]
- (36) Galleti, S., Federici, L., Bellazzini, M., Fusi Pecci, F. and Macrina, S. 2004, A&A, 416, 917 [RBCV4.0]
- (37) Galleti, S., Federici, L., Bellazzini, M., Buzzoni, A. and Fusi Pecci, F. 2006, ApJ, 650, L107 [G06]
- (38) Galleti, S., Bellazzini, M., Buzzoni, A., Federici, L. and Fusi Pecci, F. 2009, A&A, 508, 1285
- (39) Gratton, R.G., Bragaglia, A., Carretta, E. et al. 2003, A&A, 408, 529
- (40) Gratton, R.G., Bragaglia, A., Clementini, G. et al. 2004, A&A, 421, 937
- (41) Hansen, B.M.S., Anderson, J., Brewer, J. et al. 2007, ApJ, 671, 380
- (42) Harris, W.E. 1991 ARA&A, 29, 543
- (43) Harris, W.E. 1996, AJ, 112, 1487
- (44) Holtzman, J.A., Burrows, C.J., Casertano, S. et al. 1995, PASP, 107, 1065
- (45) Jablonka, P., Courbin, F., Meylan, G. et al. 2000, A&A, 359, 131
- (46) Kinman, T.D. 1959, MNRAS, 119, 538
- (47) Lee, Y.-W., Demarque, P., & Zinn, R. 1994, ApJ, 423, 248
- (48) Mackey, A.D., Huxor, A.P., Ferguson, A.M.N. et al. 2006, ApJ, 653, L105 [M06]
- (49) Mackey, A.D., Huxor, A.P., Ferguson, A.M.N. et al. 2007, ApJ, 655, L85 [M07]
- (50) Marconi, M. and Clementini, G. 2005, AJ, 129, 2257
- (51) McNamara, D.H. 1997, PASP, 109, 857
- (52) McNamara, D.H. 1999, PASP, 111, 489
- (53) Montalto, M., Seitz, S., Riffeser, A., Hopp, U., Lee, C.-H. and Schoenrich, R. 2009, A&A, 507, 283
- (54) Morgan, W.W. 1959, AJ, 64, 432
- (55) Perina, S., Federici, L., Bellazzini, M. et al. 2009, A&A, 507, 1375 [P09]
- (56) Perina, S., Galleti, S., Fusi Pecci, F., Bellazzini, M., Federici, L., & Buzzoni, A. 2011, A&A, 531, 155 [P11]
- (57) Pietrinferni, A., Cassisi, S., Salaris, M. and Castelli, F. 2006, ApJ, 642, 797
- (58) Pietrzyński, G., Thompson, I.B., Graczyk, D. et al. 2009, ApJ, 697, 862
- (59) Piotto, G., et al. 2002, A&A, 391, 945
- (60) Reid, I.N. 1997, AJ, 114, 161
- (61) Rejkuba, M. 2012, Ap&SS, in press (Online First), arXiv:1201.3936
- (62) Renzini, A., Bragaglia, A., Ferraro, F.R. et al. 1996, ApJ, 465, L23
- (63) Rich, R.M., Corsi, C.E., Cacciari, C. et al. 2005, AJ, 129, 2670 [R05]
- (64) Riess, A.G., Fliri, J., & Valls-Gabaud, D. 2012, ApJ, 745, 156
- (65) Rosenberg, A., Piotto, G., Saviane, I. & Aparicio, A. 2000a, A&AS, 144, 5
- (66) Rosenberg, A., Aparicio, A., Saviane, I. & Piotto, G. 2000b, A&AS, 145, 451
- (67) Salaris, M. 2012, Ap&SS, in press (Online First)
- (68) Sandage, A. 1993, AJ, 106, 703
- (69) Sarajedini, A., Lee, Y.-W. and Lee, D.H. 1995, ApJ, 450, 712
- (70) Schlegel, D. J., Finkbeiner, D. P., & Davis, M. 1998, ApJ, 500, 525
- (71) Searle, L. & Zinn, R. 1978, ApJ, 225, 357
- (72) Sirianni, M., Jee, M.J., Benítez, N. et al. 2005, PASP, 117, 1049
- (73) Stephens, A.W., Frogel, J.A., Freedman, W. et al. 2001, AJ, 121, 2597
- (74) Thompson, I.B., Kaluzny, J., Rucinski, S.M., Krzeminsky, W., Rych, W., Dotter, A., & Burley, G.S. 2010, AJ, 139, 329
- (75) VandenBerg, D.A., Swenson, F.J., Rogers, F.J., Iglesias, C.A. and Alexander, D.R. 2000, ApJ, 532, 430
- (76) Vilardell, F.,Ribas, I., Jordi, C. 2006, A&A, 459, 321
- (77) Vilardell, F., Ribas, I., Jordi, C., Fitzpatrick, E. L. & Guinan, E. F. 2010, A&A, 509, 70
- (78) Walker, A.R. 2011, Ap&SS, in press (Online First), arXiv:1112.3171
- (79) Zinn, R. and West, M.J. 1984, ApJS, 55, 45 [ZW84]
- (80) Zinn, R. 1985, ApJ, 293, 424