INTERFACE FERROMAGNETISM IN A SUPERLATTICE
Abstract
Resonant soft x-ray absorption measurements at the O edge on a superlattice show a shoulder at the energy of doped holes, which corresponds to the main peak of resonant scattering from the modulation in the doped hole density. Scattering line shape at the Mn edges has a strong variation below the ferromagnetic transition temperature. This variation has a period equal to half the superlattice superperiod and follows the development of the ferromagnetic moment, pointing to a ferromagnetic phase developing at the interfaces. It occurs at the resonant energies for and valences. A model for these observations is presented, which includes a double-exchange two-site orbital and the variation with temperature of the hopping frequency between the two sites.
I Introduction
Doped (LSMO) has multiple FM, AFM and canted magnetic orders as a function of doping and temperature 1955Wollan ; 1955Goodenough ; 1960deGennes from superexchange 1950Anderson and double-exchange 1951Zener ; 1955Anderson interactions, which favor an antiferromagnetic (AFM) insulating phase and a ferromagnetic (FM) metallic phase, respectively. The FM phase at low temperatures is near the doping, at which the closely related manganite shows very large (“colossal”) magnetoresistance (CMR) 1994Jin .
The wave vectors of AFM and orbital orders in bulk manganites can be accessed with soft x-ray scattering at the Mn edges. For instance, studies were made for (Ref. 2004Thomas, ), (Refs. 2003Wilkins-b, ; 2004Dhesi, ; 2005Wilkins, ) and (Ref. 2006Wilkins, ) manganites. More recent measurements showed that magnetic and orbital scattering amplitudes are similar 2009Staub , studied the doping dependence 2010GF , confirmed the separation in energy of Ref. 2009Staub, between the magnetic and orbital scattering resonances, 2011Zhou and studied their evolution after photoexcitation 2011Ehrke . The broader features of the measurements are obtained in calculations of line shapes at the Mn edges with atomic multiplet models of magnetic 2005Stojic and orbital 2000Castleton scattering, and more recently, with a finite-difference method 2010OBthesis . However, the investigation of the bulk FM phase near the doping is not possible with soft x-ray scattering at the Mn edges, due to lack of contrast for this order.
The FM phase can be studied with soft x-ray scattering in superlattices (SL), in which the Sr and La atoms are ordered in (SMO) and (LMO) layers. External magnetic fields are not necessary. The SL growth sequence can be used to define the period and symmetry of a reflection along the -axis. This was demonstrated for a SL, in which the scattering wave vector was decreased to a range accessible at the O edge resonance and a higher symmetry of a reflection used to probe interface scattering. 2007S
In this work, we have applied these ideas to SL reflections at the O and Mn edges and studied the development of the FM moment in a shorter superperiod SL with soft x-ray absorption and scattering. Measurements at the O edge showed modulated hole doping at oxygen sites. We have observed scattering at the Mn edges from the SL interfaces at SL reflection , following the temperature dependence of the FM moment. The symmetry of the SL reflection allowed us to probe all Mn valences in the interface layers. In addition to valence resonances of bulk AFM order measurements 2004Thomas ; 2003Wilkins-b ; 2004Dhesi ; 2005Wilkins ; 2006Wilkins ; 2009Staub ; 2010GF ; 2011Zhou ; 2011Ehrke , a peak in the resonant line shape, which has not been observed before, is aligned with the fluorescence yield edge for the valence. We present a model of the x-ray scattering from the SL interfaces, which includes the temperature dependence of the double-exchange hopping frequency and the change in the configurations of the Mn ions in the FM state.
II Experiments
II.1 Structure
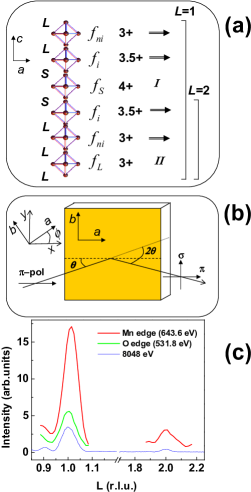
The SL was grown on the (001) surface of (STO) at Argonne National Laboratory at in a ozone pressure, followed by cooling to and pump down. The structure was with [Fig. 1(a)]. SMO (, Ref. 2001Chmaissem, ) and LMO (, Ref. 1998Rodriguez-Carvajal, ) layers on the STO substrate () are under tensile and compressive strain. The surface RMS roughness, measured with an atomic force microscope, was . From hard and soft x-ray reflectivity measurements, the SL superperiod was and the average -axis parameter for 1 ML (a coverage of one formula unit of SMO or LMO over a area) was .
II.2 X-ray absorption
X-ray absorption spectroscopy (XAS) measurements in fluorescence (FY) and electron yield (EY) modes were made at undulator beamline X1B at the National Synchrotron Light Source. The incident light was -polarized and the incidence and detector angles were and [Fig. 1(b)]. The calculated energy resolution was and at O (520 eV) and Mn (640 eV) edges, respectively.
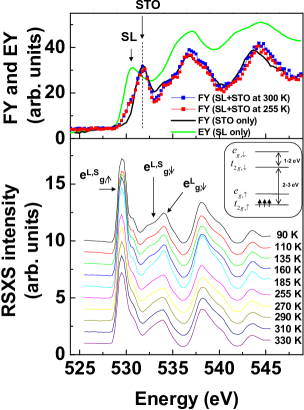
SL FY and EY measurements at the O edge show doped holes on the oxygen sites (Fig. 2). Because the probing depth exceeds the total SL thickness, FY has contributions from both the SL and the substrate. In contrast, because of the short electron escape depth, EY measurements are from the SL top layers only. The shoulder in FY measurements at 530.3 eV is aligned with the first peak in EY and is not present in FY measurements of the bare STO substrate. This shoulder corresponds to doped holes in LSMO (Ref. 1997Ju, ) and to the scattering peak at 529.6 eV. The peak at 531.8 eV is from the STO substrate. The SL FY and EY measurements at the O edge show no discernible variation with temperature between 300 K and 255 K.
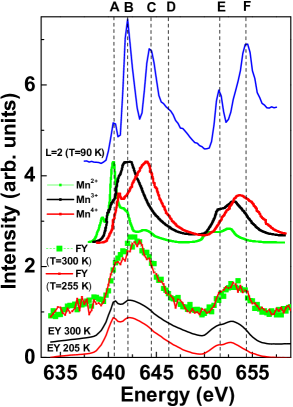
SL FY and EY measurements at the Mn edges are compared to FY measurements on bulk samples with different Mn valences (Refs. 1991Cramer, ; 2004Morales, ; 2009Lee, ) in Fig. 3. SL FY does not have the sharp peak at the lower energies characteristic of the valence, which shows that the SL has only the and valences. The SL FY measurement was aligned in energy with the average of bulk FY for the and valences, according to the number of SMO ( valence) and LMO ( valence) layers in one superperiod. No discernible variation was observed in FY or EY between 300 K and 255 K.
XAS measurements probe the average valence of O and Mn atoms in the SL. To discern a variation with temperature in different SL layers it is necessary to turn to scattering.
II.3 Resonant soft x-ray scattering
Resonant soft x-ray scattering (RSXS) measurements were made at the same beamline with an ultra-high vacuum diffractometer. For other RSXS experiments on bulk and SL at this endstation see Refs. 2005Abbamonte, ; 2007S, ; 2009S, ; 2011Lee, ; 2011S, ; 2012S, . Detection was for both and channels. The scattering momentum in the reflectivity geometry is indexed with respect to the SL superperiod . The energy resolution was and at O (520 eV) and Mn (640 eV) edges, respectively. The sample was cooled in zero magnetic field and scattering measurements for at the O edge and for at the Mn edges [Fig. 1(c)] were made at different temperatures (Figs. 2 and 4).
FM order in metallic films has been studied with x-ray resonant magnetic scattering of linearly 1990Kao and circularly 1994Kao polarized light at the Fe and Co edges. The FM order in a Ag/Ni SL has been investigated with circularly polarized light 1995Tonnerre . However, unlike previous studies, where an external magnetic field was applied to separate the magnetic and charge scattering, the SL FM order is accessed here at SL reflections with no applied magnetic fields.
II.3.1 O edge line shape
The spatial modulation in the density of holes doped on the oxygen sites can be observed with RSXS. Specifically, the O edge line shape for scattering shows a peak close to the energy of the shoulder in FY measurements (Fig. 2).
Since the order of levels in the RSXS line shape at the O edge follows that of the ground state, the RSXS line shape can be analyzed using the hybridization between O and Mn levels in the ground state. XAS experiments and calculations at the Mn edge (Ref. 1992Abbate, ) give a crystal field splitting between the and levels of 1.5 eV for bulk LMO and 2.4 eV for SMO. Fig. 2 (inset) shows the unoccupied , and levels in SMO. The scattering line shape at the O edge is described well by O states hybrids with the Mn levels in the SMO and LMO layers, shown with arrows in Fig. 2, followed at higher energy by hybrids with La and Sr states. Two levels (3.5 eV and 5 eV above ) are present in LMO and only one for SMO (3.5 eV above ) (Ref. 1995Saitoh, ) because the electron in the level in LMO splits the unoccupied levels by Coulomb interaction, even in the absence of any Jahn-Teller distortion.
However, no variation across the FM transition is observed within the error bars. To access T-dependent interface states (Sec. III A), it is necessary to reach the reflection, for which the O edge energy is too low. In contrast, is accessible at the Mn edges.
II.3.2 Mn edge valences
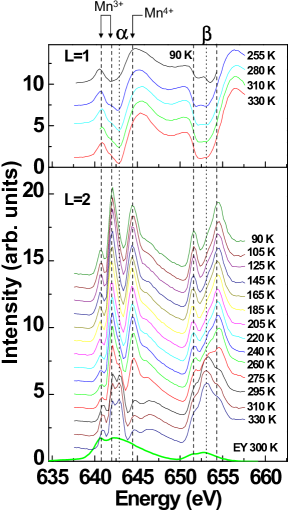
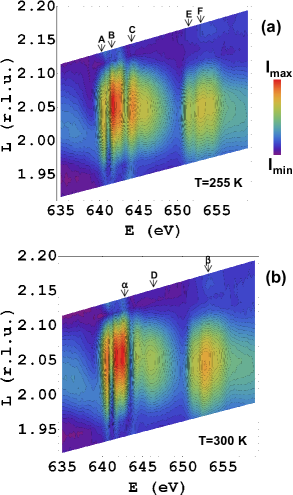
There is no discernible variation in the line shape at at the Mn edges across the FM transition temperature (Fig. 4). However, a pronounced variation is visible for . From under the relatively broad XAS at the Mn edge, T-dependent RSXS at selects those states that are sensitive to the temperature variation. Specifically, an increased intensity of the , and peaks at lower T, and a decreased intensity of the peak is observed at the edge (Fig. 4). Parallel variations occur at the edge for peaks , and . Similar results were obtained for azimuthal angle (Fig. 5), consistent with the azimuthal dependence of magnetic scattering. The temperature dependence of height and width of peak are shown in Fig. 6.
Coulomb and exchange interactions for ground and RSXS excited states are different at the Mn edges. An analysis of the RSXS line shapes based on ground state calculations, similar to that at the O edge, cannot be made. However, both FY and RSXS measurements probe excited states and FY measurements on bulk samples for different Mn valences will be used to identify the valence of scatterers for different resonances in the RSXS line shapes. This approach is supported by the relatively small difference in energy between RSXS resonances for scatterers of the same valence and different specific scattering contrasts ( between magnetic and orbital scattering for bulk measurements 2009Staub ; 2011Zhou ) compared to the separation in energy between the main FY features for different valences (Fig. 3).
FY measurements in Sec. II B showed that the valence is absent in the SL. The and resonances in the RSXS line shape for correspond to the valence, while resonance lines up at the energy of FY edge for a valence. More T-dependent measurements on SL with different superperiods are needed before a quantitative discussion of peak .
III Discussion
The model of Sec. III A relates the variation with temperature of the scattering contrast for and the absence of variation for to changes in the form factor of interface layers and interface ferromagnetism.
The variation of with the transition from the PM to the FM state for specific interface magnetic and orbital x-ray scattering models is discussed in Sec. III B.
III.1 Interface ferromagnetism
The line shape and structure factor at the Mn edge at (Fig. 4) are made of two parts. The T-independent structure factor is given by the SL structure, to which a T-dependent contribution is added with the transition to the FM state [Fig. 6(a)].
The scattering intensity follows the evolution with temperature of the FM moment [Fig. 6(a)]. The possibility that the transition to the FM state gives exclusively non-magnetic scattering contrast is not supported by an analysis of the line shapes (Sec. III B). The T-dependent scattering is, at least partially, magnetic in origin and, for simplicity, we discuss only x-ray resonant magnetic scattering in this section. Orbital contributions to temperature variations in line shapes are addressed in Sec. III B.
The scattering intensity is . The scattering form factors and are tensors, which are multiplied with the final () and initial () light polarization vectors. This gives an overall factor which, for charge () and magnetic () scattering, is
| (1) | |||
| (2) |
where is the direction of the local moment at site (Refs. 1990Kao, ; 1995Tonnerre, ). The sum over the in-plane sites for each layer is proportional to the magnetization of the layer. and are scalar functions.
RSXS peaks that persist above the FM transition temperature are due to scattering contrast defined by the SL structure, which is held constant by the internal field between and ions arranged in the SL layers. With the form factors shown Fig. 1(a) for “interface” (), “near-interface” (), “middle SMO” () and “middle LMO” () layers, and neglecting inter-diffusion roughness and structural differences between SMO/LMO and LMO/SMO interfaces, the T-independent structure factors at are
| (3) | |||
| (4) |
The origin has been chosen so that an arbitrary phase factor between and is zero.
Higher momenta are not accessible at the Mn edges. However, the absence of a variation with temperature in the scattering intensity at [] and the variation at [] strongly suggests that the unit cell of the T-dependent contribution to the structure factor () is half the SL superperiod or 3 ML. The middle of the SMO and LMO layers (separated by 3 ML) are the most dissimilar parts of the SL structure, while the SMO/LMO and LMO/SMO interfaces (with two interfaces every superperiod, also separated by 3 ML) are similar. In the following, we consider a scattering component that develops at the SL interfaces.
These conditions are contrary to those expected for scattering from crystal field effects or structural differences in a SL, from either differences in the -axis lattice constant or Jahn-Teller distortions, which do not have a 3 ML unit cell. In addition, no discernible variation was observed for scattering at the La edges for or between 300 K and 225 K (data not shown). This shows that the change in the line shape is due to a variation with temperature in the resonant form factors of the SL layers (), not of structural factors ().
In addition, these symmetry conditions on set more stringent constraints on the variation of in the SL, beyond the experimental observation . To obtain a 3 ML unit cell, the variation in the middle of the LMO and SMO layers must be equal, . In addition, the variation in the interface and near-interface layers must be equal, [Fig. 1(a)].
FM order in the and layers is consistent with estimates of the average Mn valence in a plane based on the type ( or ) of neighboring planes [Fig. 1(a)]. Specifically, a comparison to magnetic orders of equivalent bulk LSMO doping shows that and valences are near the FM dome for bulk LSMO. The magnitude of the FM moment depends on the Mn valence and implicitly on the SL interface roughness, with structural imperfections in a SL correlating with the average interface FM moment. 2008May However, the FM moment distribution is more symmetrical in the smaller superperiod SL (Ref. 2008Bhattacharya, ), consistent with the symmetric FM moment distribution in Fig. 1(a).
The 3 ML unit cell of T-dependent scattering shows that there must be two regions within a superperiod which are different from the FM and layers. With one the middle of the SMO layers (), the other must be the middle of the LMO layers (). The x-ray scattering measurements imply that the magnetic scattering in these two layers is the same . Therefore, these layers have either the same magnetization or no magnetization at low temperatures. The different hole doping of these layers does not support the possibility of an equal magnetization. The remaining possibility is that, as the SL is cooled and becomes FM in zero applied field, there is no magnetization in both these layers, or . Therefore, for the SL, the variation in magnetic scattering and FM phase are localized at the SL interfaces.
A model of the magnetic state for the FM SL is shown in Fig. 1(a), where and represent magnetic phases of the and layers in no applied field (in contrast, the polarized neutron reflectivity measurements in Refs. 2008May, ; 2011Santos, were made in applied fields). Since the average magnetization is zero for both and phases, the magnetic scattering has a 3 ML period. There are several different possible and phases: a PM phase, an ordered AFM phase (for instance, a C-type or a G-type), or an irregular phase with canted moments 2011Santos pointing in different directions in the sample regions with slight variations in local doping 1960deGennes , even though the moments in the and layers are always parallel.
The valences of the and layers are close to and , which correspond to A-type and G-type AFM magnetic orders in bulk LMO and SMO, with transition temperatures of (Ref. 1997Topfer, ) and (Ref. 2001Chmaissem, ), respectively. This suggests PM or phases, at least for the higher temperature range, below the SL FM transition temperature of [Fig. 6(a)]. However, the SL saturation FM moment of at (Ref. BNC, ) gives the extent along the -axis of the FM region in high fields of for each superperiod, where is the maximum FM moment of the alloy 2008Bhattacharya . This value is too high for both and phases to remain PM at the lowest temperatures. Therefore, at least one magnetic transition, other than the FM transition, occurs in the SL.
The RSXS measurements are consistent with transitions in the and layers from a PM phase at higher temperatures to either a G-type or C-type AFM phase (near the doping of bulk LSMO) and to an irregular canted phase (near the the doping 1960deGennes ) at lower temperatures, respectively. However, since there is no average layer magnetization in all these cases, the RSXS intensity does not vary at these transitions, in contrast to the FM transition in the and layers.
With these constraints on , the change in the structure factor at the FM transition and from Eqs. (3)-(4) is
| (5) | |||
| (6) |
Eq. (6) relates the changes with temperature in the line shape at to variations of form factor of interface and near-interface layers in the SL.
The reflection is allowed in this SL for all Mn sites in the FM layers. However, similar to AFM orders in bulk LSMO, scattering from a valence was not observed at for a SL (Ref. 2007S, ) [it was observed in a SL at (data not shown)]. The symmetry that very effectively forbids reflections from the ions at for the SL is not known and surprising, given inherent small imperfections of a SL structure. More measurements are needed for different SL to answer this question.
III.2 Interface x-ray scattering
We now discuss the temperature variation of the RSXS line shape at and Mn edges.
The width of resonance , corresponding to the valence and to interface and near-interface layers, has an sharp increase at the FM transition temperature [Fig. 6(b)]. The increase in the scattering intensity in the FM state is also taking place below the charge order resonance that corresponds to the valence in the PM state (at in Fig. 4).
In general, the line shape of resonant magnetic scattering is related to variations in the occupation of orbitals induced by a magnetic field 1988Hannon near the FY edges for Mn ions of different ( and ) valences. However, the magnetic scattering is slightly shifted to lower energies compared to orbital scattering for AFM bulk orders. 2009Staub ; 2011Zhou We cannot resolve two peaks at in the SL line shapes at low T, but this suggests that, with the increase of the FM moment at lower T, a T-dependent magnetic scattering contribution is added below the charge scattering resonance. This addition to of a temperature dependent explains the observed variation in line shape at . The charge scattering resonance might also increase at lower T, concomitantly with magnetic scattering and variations in orbital scattering with T are discussed briefly at the end of this Section.
A more gradual increase in width is observed at lower T [Fig. 6(b)]. For x-ray scattering in the FM phase, it is necessary to consider a double-exchange two-site orbital, which suggests that this width increase is related to the T dependence of the double-exchange frequency between the two Mn sites. Both resonant magnetic and orbital scattering are ultimately scattering off orbitals, and the consideration of two-site orbitals in the FM state applies to both cases.
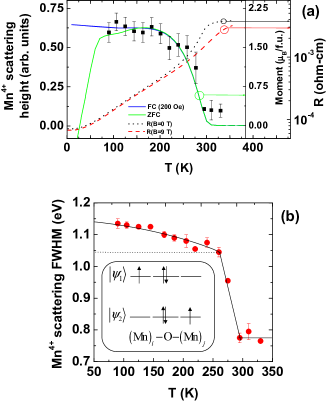
The double-exchange process involves two coordinated jumps from the Mn to the O atoms [Fig. 6(b), inset]. It is useful to consider the simpler process of one jump first, which is sometimes included in XAS calculations of complex oxides. In this case, inter-site charge transfer between -states of a transition metal and a neighboring (ligand, ) O ion 2005Groot and consideration of multiple configurations (for instance, and for and valences) change the scattering form factor at the transition metal edge. In particular, satellite peaks develop in XAS (and, implicitly, in RSXS) at additional Cu valences. 1998Hu
In the double-exchange process, specific to FM complex oxides, charge transfer takes place between transition metal sites, beyond the neighboring O atoms. Specifically, the and configurations are coupled in a two-site ground state wave function [Fig. 6(b), inset], which for this FM manganite is
| (7) | |||
with Mn valences in FM layers in a superposition of and . In the ground state (without an x-ray photon absorbed), the charge transfer splits the two levels by the exchange energy (Ref. 1951Zener, ), where the double-exchange hopping between sites and is , with a constant and the spins orientations on the two sites (Ref. 1955Anderson, ).
To account for the double-exchange process in x-ray scattering, the orbitals are replaced with the two-site orbitals . Similar to the case of ligand holes on oxygen atoms, the charge transfer between Mn sites beyond the neighboring O atoms changes the scattering factor at satellite peaks in RSXS, which correspond to the and valences.
In addition, the splitting by of the states results, for our relatively large energy resolution and core hole width, in an increase of the measured width by . More precisely, the the bandwidth of electrons depends on the hopping frequency between the and sites as 1997Topfer
| (8) |
where is the angle between the Mn-O-Mn bonds. A width increase at lower T in the ground state is transferred to a increase of the RSXS line width.
The hopping frequency increases with increased FM order of spins at lower T, and broadens the scattering form factors and the line width. In this model, the XAS and therefore, the RSXS peaks, should become broader at lower temperatures. The width increase at lower temperatures of peak [Fig. 6(b)] is consistent with this model and for each of the states, and contributions from experimental resolution ( at the Mn edge) and core-hole width (, Ref. 2004Thomas, ).
In addition to the double-exchange processes in the FM state, lattice distortions are also relevant to the CMR transition 1995Hwang ; 1996Millis . In bulk manganites, they may depend on T, changing the bond alignment and bandwidth [Eq. (8)]. However, the average angle between the Mn-O-Mn bonds for SL samples is fixed by the substrate.
Orbital scattering at the Mn edges has a comparable amplitude to magnetic scattering for bulk AFM orders. 2009Staub ; 2011Zhou It can come from occupation contrast or polarization contrast from different atomic orbital orientations in the anomalous scattering tensor. The analogous occupation contrast in SL FM is a T-dependent charge transfer across SL interfaces (which includes the electronic reconstruction of Ref. 2007S, ), in addition to the T-independent part defined by the SL structure. The T-dependent polarization contrast in the SL may also be substantial; for instance, on closely related SL (Ref. 2009Aruta, ), in-plane occupation and FM near LMO interfaces and out-of-plane orbital occupation and AFM in the middle of LMO layers was inferred from XMLD and XMCD measurements. Polarization-resolved scattering measurements in a magnetic field with and incident light and scattered beam polarization analysis are necessary to separate different magnetic and orbital contributions to scattering at the Mn edges.
We discuss the O edge briefly. Oxygen doping is consistent with our observations (Fig. 2), other measurements 1997Ju and certain models 2010GF . The interface FM state of this SL is the metallic state observed in a SL (Ref. 2007S, ). The reflection at (Fig. 2) is not sensitive to T-dependent scattering because, as for the Mn edges, . The intensity of the reflection in Ref. 2007S, corresponds to the reflection for this SL. In particular, to determine whether T-dependent scattering occurs at the O edge in this SL, it would be necessary to measure at , a momentum which is not accessible at the O edge.
IV Conclusion
X-ray absorption measurements at the O edge in a superlattice showed a shoulder, corresponding to holes doped on oxygen sites. The shoulder is aligned with the main resonant peak of soft x-ray scattering from the spatial modulation in the density of doped holes.
A large variation in the Mn line shapes at , but not at , was observed across the FM transition, pointing to scattering from ferromagnetic interfaces.
Comparison to fluorescence yield edge energies for different Mn valences showed the presence of scattering contrast at both and valences. An x-ray scattering model, which includes double-exchange orbitals in the FM state, explains the observed line broadening at lower temperatures.
Measurements on bulk 113 (Ref. 2004Thomas, ), 214 (Ref. 2003Wilkins-b, ; 2004Dhesi, ; 2005Wilkins, ) and 327 (Ref. 2006Wilkins, ) manganites in the AFM state observe two main resonances only at the Mn edge, at and . Scattering from ions (corresponding to resonance ) has the symmetry of a forbidden reflection. Specifically, it has a spatial periodicity of 2 u.c. and is not allowed at the bulk in-plane orbital order reflection wave vector of 4 u.c. along the tetragonal axes (Ref. 2003Wilkins-b, ; 2004Thomas, ). Having to rely on measurements of the resonances only, different methods to determine the charge disproportionation for bulk AFM orders are controversial, with both small and large charge disproportionation obtained. Our RSXS line shapes, for a SL structure with a large intrinsic charge disproportionation, add an experimental constraint on these competing models.
The development of the SL FM order was accessed with x-ray resonant magnetic scattering and no applied magnetic fields. An open question is the trace [FC or ZFC in Fig. 6(a)] that the height of resonance would follow on further cooling.
We would like to contrast our measurements to polarized neutron reflectivity (PNR) data on SMO/LMO superlattices (Refs. 2008May, ; 2011Santos, ), where a magnetic modulation was measured with a period equal to the SL superperiod (magnetization strongly suppressed in SMO, high in LMO). In contrast, the RSXS measurements presented here show an ordering of magnetic moments with a period equal to half the SL superperiod. Several factors may be at the origin of this difference. First, the experimental conditions of the PNR and RSXS measurements were different. Specifically, PNR measurements were made in relatively high fields ( and in Ref. 2008May, and 2011Santos, , respectively), while the RSXS measurements were made with no applied fields. Second, the samples measured in this work have a lower SL superperiod () compared to the samples of PNR measurements ( and ). Thus, a complete mapping of the magnetic structure of SMO/LMO superlattices as a function of deposition sequence, magnetic field and temperature requires more measurements.
V Acknowledgments
This work was supported by the Department of Energy Office of Basic Energy Science: RSXS measurements by grant DE-FG02-06ER46285, NSLS facilities by DE-AC02-98CH10886, and MRL facilities by DE-FG02-07ER46453 and DE-FG02-07ER46471. Work at Argonne National Laboratory, including use of facilities at the Center for Nanoscale Materials, was supported by the U.S. Department of Energy, Office of Basic Energy Sciences under contract No. DE-AC02-06CH11357.
References
- (1) E.O. Wollan and W.C. Koehler, Phys. Rev. 100, 545 (1955).
- (2) J.B. Goodenough, Phys. Rev. 100, 564 (1955).
- (3) P.-G. de Gennes, Phys. Rev. 118, 141 (1960).
- (4) C. Zener, Phys. Rev. 82, 403 (1951).
- (5) P.W. Anderson and H. Hasegawa, Phys. Rev. 100, 675 (1955).
- (6) P.W. Anderson, Phys. Rev. 79, 350 (1950).
- (7) S. Jin, T.H. Tiefel, M. McCormack, R.A. Fastnacht, R. Ramesh, and L.H. Chen, Science 264, 413 (1994).
- (8) K.J. Thomas et al., Phys. Rev. Lett. 92, 237204 (2004).
- (9) S.B. Wilkins et al., Phys. Rev. Lett. 91, 167205 (2003).
- (10) S.S. Dhesi et al., Phys. Rev. Lett. 92, 056403 (2004).
- (11) S.B. Wilkins et al., Phys. Rev. B 71, 245102 (2005).
- (12) S.B. Wilkins et al., J. Phys.: Condens. Matter 18, L323 (2006).
- (13) U. Staub et al., Phys. Rev. B 79, 224419 (2009).
- (14) M. Garcia-Fernandez et al., Phys. Rev. B 82, 235108 (2010).
- (15) S.Y. Zhou et al., Phys. Rev. Lett. 106, 186404 (2011).
- (16) H. Ehrke et al., Phys. Rev. Lett. 106, 217401 (2011).
- (17) N. Stojic, N. Binggeli, and M. Altarelli, Phys. Rev. B 72, 104108 (2005).
- (18) C.W.M. Castleton and M. Altarelli, Phys. Rev. B 62, 1033 (2000).
- (19) O. Bunau, PhD thesis, University of Grenoble (2010).
- (20) S. Smadici et al., Phys. Rev. Lett. 99, 196404 (2007).
- (21) O. Chmaissem et al., Phys. Rev. B 64, 134412 (2001).
- (22) J. Rodriguez-Carvajal et al., Phys. Rev. B 57, R3189 (1998).
- (23) S. Smadici, J.C.T. Lee, J. Morales, G. Logvenov, O. Pelleg, I. Bozovic, Y. Zhu and P. Abbamonte, Phys. Rev. B 84, 155411 (2011).
- (24) H.L. Ju, H-C. Sohn, and K.M. Krishnan, Phys. Rev. Lett. 79, 3230 (1997).
- (25) S. P. Cramer et al., J. Am. Chem. Soc. 113, 7937 (1991).
- (26) F. Morales et al., J. Phys. Chem. B 108, 16201 (2004).
- (27) J. Lee et al., Phys. Rev. B 80, 205112 (2009).
- (28) P. Abbamonte, A. Rusydi, S. Smadici, G.D. Gu, G.A. Sawatzky, and D.L. Feng, Nature Physics 1, 155-158 (2005).
- (29) J.-S. Lee, C.-C. Kao, C.S. Nelson, H. Jang, K.-T. Ko, S.B. Kim, Y.J. Choi, S.-W. Cheong, S. Smadici, P. Abbamonte, and J.-H. Park, Phys. Rev. Lett. 107, 037206 (2011).
- (30) S. Smadici, J.C.T. Lee, S. Wang, P. Abbamonte, G. Logvenov, A. Gozar, C. Deville Cavellin, and I. Bozovic, Phys. Rev. Lett. 102, 107004 (2009).
- (31) S. Smadici, J.C.T. Lee, A. Rusydi, G. Logvenov, I. Bozovic, and P. Abbamonte, Phys. Rev. B 85, 094519 (2012).
- (32) C.C. Kao et al., Phys. Rev. Lett. 65, 373 (1990).
- (33) C.C. Kao et al., Phys. Rev. B 50, 9599 (1994).
- (34) J.M. Tonnerre et al., Phys. Rev. Lett. 75, 740 (1995).
- (35) M. Abbate et al., Phys. Rev. B 46, 4511 (1992).
- (36) T. Saitoh et al., Phys. Rev. B 51, 13942 (1995).
- (37) J. Topfer et al., J. of Solid State Chemistry 130, 117 (1997).
- (38) S. May et al., Phys. Rev. B 77, 174409 (2008).
- (39) A. Bhattacharya et al., Phys. Rev. Lett. 100, 257203 (2008).
- (40) B.B. Nelson-Cheeseman et al. (unpublished).
- (41) T. Santos et al., Phys. Rev. Lett. 107, 167202 (2011).
- (42) J.P. Hannon, G.T. Trammell, M. Blume, and D. Gibbs, Phys. Rev. Lett. 61, 1245 (1988).
- (43) F. de Groot, Coordination Chemistry Reviews 249, 31 (2005).
- (44) Z. Hu et al., Chemical Physics 232, 63 (1998).
- (45) H.Y. Hwang, S.W. Cheong, P.G. Radaelli, M. Marezio, and B. Batlogg, Phys. Rev. Lett. 75, 914 (1995).
- (46) A.J. Millis, R. Mueller, and B.I. Shraiman, Phys. Rev. B 54, 5405 (1996).
- (47) C. Aruta et al., Phys. Rev. B 80, 140405(R) (2009).