Spin and charge distribution symmetry dependence of stripe phases in two-dimensional electron systems confined to wide quantum wells
Abstract
Measurements in clean two-dimensional electron systems confined to wide GaAs quantum wells in which two electric subbands are occupied reveal an unexpected rotation of the orientation of the stripe phase observed at a half-filled Landau level. Remarkably, the reorientation is sensitive to the spin of the half-filled Landau level and the symmetry of the charge distribution in the quantum well.
A low-disorder two-dimensional electron system (2DES) subjected to a strong perpendicular magnetic field () displays a variety of novel quantum phases. At high , when the Fermi energy () resides in the lowest ( and 1) Landau levels (LLs), electrons typically condense into incompressible liquid states and exhibit the fractional quantum Hall effect Tsui et al. (1982). At lower , when lies in the higher LLs (), phases with non-uniform density are predicted to be the ground states. More specifically, when a spin-split LL is half filled, the 2DES breaks the rotational symmetry by forming a unidirectional charge density wave, the so-called stripe phase Koulakov et al. (1996); Moessner and Chalker (1996). Experimentally, strong anisotropy is seen in in-plane transport coefficients at LL filling factors , 11/2, 13/2, and 15/2: the longitudinal resistance commonly vanishes along the [110] crystal direction along which the stripes form (”easy” axis), but exhibits a strong peak along the [11̄0] direction (”hard” axis) Lilly et al. (1999a); Du et al. (1999). It is believed that a native symmetry-breaking field, which is still unidentified after more than a decade of research, is responsible for orienting the stripe phases along [110] Cooper et al. (2001); Willett et al. (2001). The associated anisotropy energy is estimated to be a few mK per electron Jungwirth et al. (1999); Stanescu et al. (2000) from the fact that an in-plane magnetic field of 1 T can overcome this energy and re-align the stripes to be perpendicular to the field direction Pan et al. (1999); Lilly et al. (1999b); Note (1). Even without any external symmetry-breaking field, the stripes are known to rotate from the ”normal” ([110]) direction to the ”abnormal” ([11̄0]) direction when the 2DES density is raised above a critical density cm-2 Zhu et al. (2002). The density-induced rotation occurs at very similar densities for 2DESs confined to either GaAs/AlGaAs hetero-junctions or GaAs quantum wells; also it does not depend on the LL spin orientation as it happens for both filling factors and 11/2 Zhu et al. (2002); Cooper et al. (2004).
Here we report a study of stripe phases in wide GaAs quantum wells (QWs) where two electric subbands are occupied. Our main focus is on the evolution of the orientation of stripe phases as we increase the density while keeping the QW charge distribution symmetric (balanced). More precisely, we monitor the magneto-resistance near LL filling factors and 15/2 when lies in the two, spin-split, LLs of the symmetric (S) subband (the S2 and S2 levels) while the LLs of the antisymmetric subband (A0 and A0 levels) are fully occupied. We find that when lies in S2 the stripes are always formed along the ”normal” ([110]) direction. But, when lies in the S2 level, the orientation of the stripes can rotate to be along the ”abnormal” ([11̄0]) direction at high densities. At a density where the stripe phase at is along the abnormal direction, we can rotate it back to the normal direction by making the QW charge distribution asymmetric while keeping the density fixed. Our observations therefore reveal that the symmetry-breaking mechanism that determines the direction of the stripe phases depends not only on the 2DES density but also on the orientation of the LL in which resides, and on the symmetry of the charge distribution in the QW.
Our samples were grown by molecular beam epitaxy, and each consist of a wide GaAs QW bounded on either side by undoped Al0.24Ga0.76As spacer layers and Si -doped layers. We report here data for two samples, with QW widths 42 and 51 nm, and as-grown densities of 3.1 and 2.5 cm-2, respectively. The low-temperature ( K) mobilities of these samples are 600 m2/Vs. The samples have a van der Pauw geometry and each is fitted with an evaporated Ti/Au front-gate and an In back-gate. We carefully control the density and the charge distribution symmetry in the QW by applying voltage biases to these gates Suen et al. (1994); Liu et al. (2011a). The measurements were carried out in a dilution refrigerator with base temperature 30 mK, and we used low-frequency ( Hz) lock-in techniques to measure the transport coefficients. Throughout this article, the longitudinal resistances measured along the [110] direction () are shown in red, and those measured along the [11̄0] direction () are shown in black. With this notation, a black trace showing a much larger resistance than a red trace corresponds to the ”normal” stripe orientation ([110]), i.e., the one that is commonly seen in standard, single-subband QWs at low densities. Conversely, a black trace showing a much smaller resistance than a red trace signals that the stripes are formed along [11̄0], which we refer to as the ”abnormal” orientation.
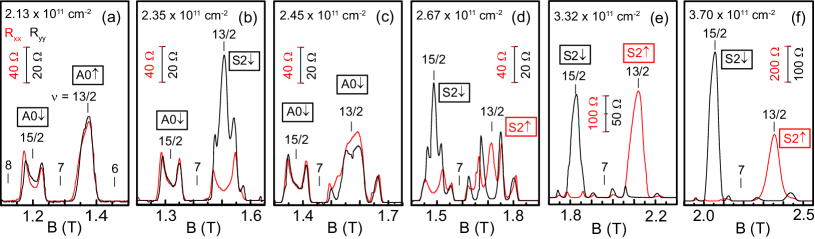
Figure 1 illustrates one of our main findings. It shows and traces, in the filling range , for a symmetric (balanced) 42-nm-wide QW at six different densities , 2.35, 2.45, 2.67 3.32, and cm-2. At , as a function of increasing , transport is first isotropic (Fig. 1(a)), shows a ”normal” anisotropy (Fig. 1(b)), becomes isotropic again (Fig. 1(c)), and then exhibits anisotropy but now along the ”abnormal” direction (Figs. 1(d-f)). The behavior at , however, is markedly different; it is isotropic in Figs. 1(a-c) and then shows a ”normal” anisotropy at higher (Figs. 1(d-f)). The traces shown in Figs. 1(d-f) are particularly noteworthy: transport is anisotropic at both and 15/2, but the orientation of the anisotropy in a is different at these two fillings.
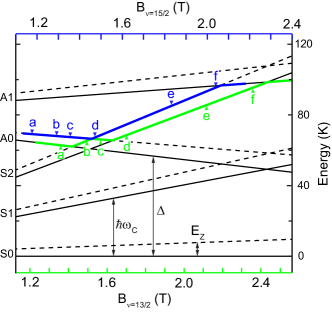
In order to understand the data of Fig. 1, we present in Fig. 2 a Landau level (LL) fan diagram for this 42-nm-wide QW sample as a function of , or equivalently the magnetic field position of (). We show the LLs for the symmetric (S) and antisymmetric (A) electric subbands. The index 0, 1, or 2 following S and A is the LL orbital quantum number (), and the up- () and down-spin () levels are represented by solid and dashed lines. The relevant energies are the subband separation (), the cyclotron energy (), and the Zeeman energy (). As we increase while keeping the QW balanced, and increase but decreases Suen et al. (1994); Shayegan et al. (1996), causing crossings of the S2 and A0 levels. As we discuss below, these crossings are consistent with the evolution seen in Fig. 1. We emphasize that the LL fan diagram shown in Fig. 2 is based on the parameters of our sample. For example, we measured from Fourier transforms of the Shubnikov-de Haas oscillations at low magnetic fields Suen et al. (1994). These measured are also consistent with all the parallel-spin LL crossings we observe in this sample Liu et al. (2011a); these crossings occur at where . We found that the expression , which we use in Fig. 2 plot, accurately describes the dependence of on in the range of densities reached in our experiments ( has units of K and is given in units of cm-2). For we used an effective g-factor of which is 8-fold enhanced relative to the GaAs band g-factor (0.44); this is consistent with all the observed crossings between LLs of antiparallel-spin, which are signaled by spikes in the longitudinal resistance Liu et al. (2011b).
Focusing first on , in Fig. 2 we show the position of the at this filling in green, and mark the densities (or ) corresponding to the data of Fig. 1 with up-pointing triangles. At the lowest density cm-2, lies in the A0 level at and the 2DES is isotropic as seen in Fig. 1(a). As we increase to cm-2, moves to the S2 level at . Strong anisotropy is seen in the data (Fig. 1(b)), consistent with now lying in an LL. The resistance peak in and minimum in indicate the stripe phase is along the ”normal” direction. Further increasing to cm-2, this stripe phase disappears and the 2DES becomes isotropic again (Fig. 1(c)) when moves back to an LL, namely the A0 level. The anisotropy reappears as soon as moves to the S2 level at cm-2 (Fig. 1(d)) and the 2DES remains anisotropic up to the highest achievable in this sample. Remarkably, however, in Figs. 1(d-f) at we observe a resistance in and a in , signaling that the stripe direction has rotated and is now along the ”abnormal” direction.
At , transport is isotropic at the lowest three (Figs. 1(a-c)). This is expected as lies in the A0 level; see the blue lines and the down-pointing triangles in Fig. 2. When is further increased, moves to the S2 level and the 2DES becomes anisotropic (Figs. 1(d-f)) at . In sharp contrast to the case, however, the stripe phase at is oriented along the ”normal” direction up to the highest achievable in the sample. It is clear that at a given fixed density (e.g., Fig. 1(e)), the stripes’ direction depends on the spin orientation of the LL where resides (S2 for and S2 for ).
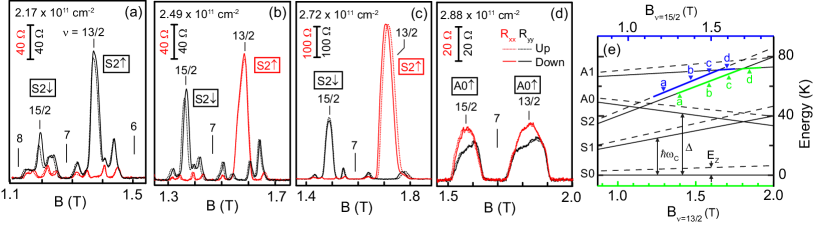
Data taken in a 51-nm-wide QW (Fig. 3) qualitatively confirm the spin-dependent reorientation of the stripe phase. As we increase , the stripe phase rotates from the normal to the abnormal direction if lies in the S2 level at , but it never rotates when lies in the S2 level at (Figs. 3(b,c)). However, the reorientation at is not seen at the lowest (Fig. 3(a)), suggesting that it depends on also. Figure 3(d) indicates that, as expected, the 2DES becomes isotropic at the highest cm-2 when moves to the A1 LLs (see Fig. 3(e)). Note also that in Figs. 3(a-d) we are showing data for different magnetic field sweep directions. In contrast to previous observations near the stripe phase reorientations in single-subband 2DESs Zhu et al. (2002); Cooper et al. (2004), we observe no hysteresis in our data 111To be more precise, our bidirectional field sweep data on the 51-nm-wide sample were taken at densities which are about 5% away from the transition density. We cannot rule out that hysteresis might exist closer to the transition density..
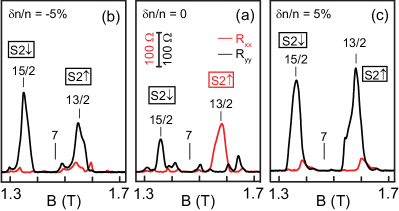
Figure 4 illustrates yet another remarkable property of the stripe phases in our samples. Here data are shown for the 51-nm-wide sample of Fig. 3 at a fixed density of cm-2 while we make the charge distribution in the QW asymmetric via applying front- and back-gate voltage biases with opposite polarity. When the charge distribution is symmetric (Fig. 4(a)) the stripe phase at is along the abnormal direction, but a small asymmetry in the charge distribution reorients the phase along the normal direction 222At a higher density of cm-2, the stripe phase at in the 51-nm-wide QW sample remains along the abnormal direction when 4%..
The data presented in Figs. 1-4 provide evidence for additional subtleties and twists in the physics of stripe phases in 2DESs. While we do not have an explanation for the behaviors revealed in our wide QW data, some implications are noteworthy. First, in both the 42- and 51-nm-wide QWs, the reorientation at occurs at a very similar density, cm-2 333Also, in a 65-nm-wide QW, we do not see any rotation of the stripe phase at up to the highest achievable density of cm-2.. Therefore, we cannot rule out the possibility that our observed reorientation is density-induced. However, in single-subband, narrow QWs, the stripe phases at and 11/2 both rotate above the same threshold density ( cm-2, see Zhu et al. (2002)), suggesting that the electron spin is not playing a role. In contrast, the rotation we report here in wide QWs appears to be spin-dependent: the stripe phase rotates at when lies in the S2 level, but never rotates at when is in the S2 level. Also, in our samples the stripe phase rotates at a density ( cm-2) which is smaller than the well-established critical density cm-2 in hetero-junctions and narrow QW samples Zhu et al. (2002); Cooper et al. (2004). Moreover, the filling factors in our study ( and 15/2) are larger than in previous reports (9/2 and 11/2). Together with the lower threshold densities, this implies that the transition fields in our experiment are much smaller compared to previous measurements ( 1.5 T vs. 2.8 T).
Second, as illustrated in Fig. 4, the rotated stripe phase can be switched back to the normal direction when the QW charge distribution is made asymmetric. This observation has important implications for the possible origins of the symmetry-breaking potential. For example, Koduvayur et al. Koduvayur et al. (2011) recently reported that the application of in-plane shear strain can alter the exchange potential and re-align the stripe direction in GaAs 2D hole systems. Thus they suggested that the residual strain due to surface charge induced fields is responsible for the symmetry-breaking potential of the stripe phases in both hole and electron 2D systems in GaAs. Our data of Fig. 4 do not agree with this conjecture as they show that the stripe phase can be made to lie along the same (normal) direction for electric fields of opposite polarity.
The experimental observations reported here point to additional intricacies that determine how a GaAs 2DES chooses the direction of its anisotropic (stripe) phases at half-filled LLs. Besides the 2DES density, the spin orientation of the LL where lies, as well as the symmetry of the charge distribution can both play roles in stabilizing the stripe phase direction. The spin-dependence is particularly puzzling because the energy of a stripe phase normally should not depend on the spin orientation of the carriers. It is possible that factors such as the mixing of the nearby LLs, particularly the A1 LLs, are responsible for the spin-dependence we observe. The details we preset here, namely, our samples’ parameters (well width, density, charge-distribution symmetry, and LL energy diagrams) should provide stimulus and quantitative input for future work aimed at understanding what determines the orientations of the stripe phases.
Acknowledgements.
We acknowledge support through the NSF (grants DMR-0904117 and MRSEC DMR-0819860), and the Moore and Keck Foundations. This work was performed at the National High Magnetic Field Laboratory, which is supported by the NSF Cooperative Agreement No. DMR-0654118, by the State of Florida, and by the DOE. We thank E. Palm, J. H. Park, T. P. Murphy and G. E. Jones for technical assistance.References
- Tsui et al. (1982) D. C. Tsui, H. L. Stormer, and A. C. Gossard, Phys. Rev. Lett. 48, 1559 (1982).
- Koulakov et al. (1996) A. A. Koulakov, M. M. Fogler, and B. I. Shklovskii, Phys. Rev. Lett. 76, 499 (1996).
- Moessner and Chalker (1996) R. Moessner and J. T. Chalker, Phys. Rev. B 54, 5006 (1996).
- Lilly et al. (1999a) M. P. Lilly, K. B. Cooper, J. P. Eisenstein, L. N. Pfeiffer, and K. W. West, Phys. Rev. Lett. 82, 394 (1999a).
- Du et al. (1999) R. R. Du, D. C. Tsui, H. L. Stormer, L. N. Pfeiffer, K. W. Baldwin, and K. W. West, Solid State Communications 109, 389 (1999).
- Cooper et al. (2001) K. Cooper, M. Lilly, J. Eisenstein, T. Jungwirth, L. Pfeiffer, and K. West, Solid State Communications 119, 89 (2001).
- Willett et al. (2001) R. L. Willett, J. W. P. Hsu, D. Natelson, K. W. West, and L. N. Pfeiffer, Phys. Rev. Lett. 87, 126803 (2001).
- Jungwirth et al. (1999) T. Jungwirth, A. H. MacDonald, L. Smrčka, and S. M. Girvin, Phys. Rev. B 60, 15574 (1999).
- Stanescu et al. (2000) T. D. Stanescu, I. Martin, and P. Phillips, Phys. Rev. Lett. 84, 1288 (2000).
- Pan et al. (1999) W. Pan, R. Du, H. L. Stormer, D. C. Tsui, L. N. Pfeiffer, K. W. Baldwin, and K. W. West, Phys. Rev. Lett. 83, 820 (1999).
- Lilly et al. (1999b) M. P. Lilly, K. B. Cooper, J. P. Eisenstein, L. N. Pfeiffer, and K. W. West, Phys. Rev. Lett. 83, 824 (1999b).
- Note (1) The reorientation of stripes in the presence of an in-plane magnetic field is more complicated in quantum well samples where a second electric subband is occupied [W. Pan, et. al. Phys. Rev. Lett. 85, 3257 (2000)].
- Zhu et al. (2002) J. Zhu, W. Pan, H. L. Stormer, L. N. Pfeiffer, and K. W. West, Phys. Rev. Lett. 88, 116803 (2002).
- Cooper et al. (2004) K. B. Cooper, J. P. Eisenstein, L. N. Pfeiffer, and K. W. West, Phys. Rev. Lett. 92, 026806 (2004).
- Suen et al. (1994) Y. W. Suen, H. C. Manoharan, X. Ying, M. B. Santos, and M. Shayegan, Phys. Rev. Lett. 72, 3405 (1994).
- Liu et al. (2011a) Y. Liu, J. Shabani, and M. Shayegan, Phys. Rev. B 84, 195303 (2011a).
- Shayegan et al. (1996) M. Shayegan, H. C. Manoharan, Y. W. Suen, T. S. Lay, and M. B. Santos, Semiconductor Science and Technology 11, 1539 (1996).
- Liu et al. (2011b) Y. Liu, J. Shabani, D. Kamburov, M. Shayegan, L. N. Pfeiffer, K. W. West, and K. W. Baldwin, Phys. Rev. Lett. 107, 266802 (2011b).
- Note (2) To be more precise, our bidirectional field sweep data on the 51-nm-wide sample were taken at densities which are about 5% away from the transition density. We cannot rule out that hysteresis might exist closer to the transition density.
- Note (3) At a higher density of cm-2, the stripe phase at in the 51-nm-wide QW sample remains along the abnormal direction when 4%.
- Note (4) Also, in a 65-nm-wide QW, we do not see any rotation of the stripe phase at up to the highest achievable density of cm-2.
- Koduvayur et al. (2011) S. P. Koduvayur, Y. Lyanda-Geller, S. Khlebnikov, G. Csathy, M. J. Manfra, L. N. Pfeiffer, K. W. West, and L. P. Rokhinson, Phys. Rev. Lett. 106, 016804 (2011).