-resonances in a buffered micrometric Rb cell: splitting in a strong magnetic field
Armen Sargsyan1, Rafayel Mirzoyan1,2, Aram Papoyan1∗, and David Sarkisyan1
1Institute for Physical Research, NAS of Armenia,
Ashtarak-2, 0203, Armenia
2Laboratoire Interdisciplinaire Carnot de Bourgogne, UMR CNRS 6303, Universite′ de Bourgogne,
21078 Dijon Cedex, France
∗Corresponding author: papoyan@ipr.sci.am
Abstract
-resonances excited in rubidium atoms confined in micrometric-thin cells with variable thickness from 1 m to 2 mm are studied experimentally for the cases of a pure Rb atomic vapor and of a vapor with neon buffer gas. Good contrast and narrow linewidth were obtained for thicknesses as low as 30 m. The higher amplitude and sharper profile of -resonances in the case of a buffered cell was exploited to study the splitting of the 85Rb D1 -resonance in a magnetic field of up to 2200 G. The results are fully consistent with the theory. The mechanism responsible for forming -resonances is discussed. Possible applications are addressed.
OCIS codes: 020.1335, 300.6360.
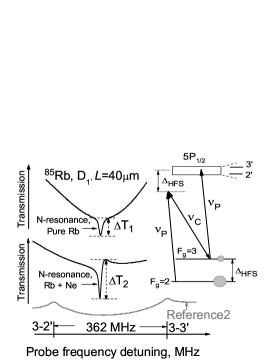
The formation of narrow optical resonances via coherent processes continues to be of high interest because its fascinating properties have potentially significant applications in quantum information, metrology, magnetometry, and other fields [1]. Though narrow resonances are predominantly formed by electromagnetically induced transparency (EIT) and the related phenomenon of coherent population trapping (CPT) in a -system, other schemes are exploited as well: EIT in a “ladder” system, electromagnetically induced absorption (EIA), etc. It was shown in [2] that a so-called -resonance that forms in a -system of the Rb D1,2 lines and manifests itself by an increase of the absorption (as it is for the EIA-resonance), can be competitive with the aforementioned resonances. The main advantage of this process is that it makes it technically easier to form a high-contrast, sub-natural resonance. In [3] it was demonstrated that better contrast could be attained for a D2 -resonance, while the linewidth was narrower for D1 -resonance. The possibility of light-shift cancellation, which might be important for atomic clock applications, was shown in [4]. The profile asymmetry of -resonances was studied in [5]. The parameters of -resonances can be improved by using laser radiation from three sources [6]. For applications in spectroscopy, metrology etc., it is important to reduce the dimensions of the atomic vapor cell in which optical resonances are formed while maintaining good resonance parameters [7, 8, 9, 10]. In this letter we report on -resonances observed with wedged micrometric-thin cells (MTC) filled with Rb vapor together with 150 Torr of neon gas in magnetic fields of up to 2.2 kG. The thicknesses L of the MTCs ranged from 1 m to 50 m and from 40 m to 2 mm. The design of the MTCs used was similar to that presented in [10]. The -resonance was formed in a -system by two lasers beams with 795 nm and 1 MHz linewidth: the probe beam, whose frequency could be tuned, and the coupling beam, whose frequency was fixed. The diagram presented in the inset of Fig. 2 shows the -system for the 85Rb atom, where Fg = 2,3 are the ground levels, and the combined upper level 5P1/2 consists of hyperfine levels Fe=2,3. The probe laser frequency was resonant with the 5S1/2, Fg=3 5P1/2 transition, and the coupling laser frequency was shifted by the value of the ground state hyperfine splitting (. The experimental arrangement is sketched in Fig. 1.
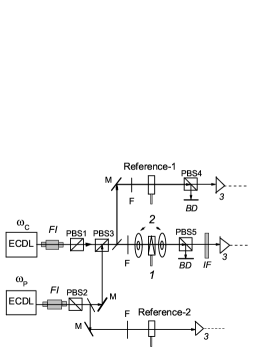
The beams of two single-frequency extended cavity diode lasers (ECDL) were carefully superimposed and directed by PBS3 onto the MTC. The coupling and probe beams were linearly polarized in orthogonal planes. The small thickness of MTC makes it possible to use a permanent ring magnet (PRM) in order to apply a strong magnetic field and still obtain a homogeneous field over the thickness of the cell: in the MTC, the variation of the -field inside the atomic vapor column is negligible compared to value of the applied magnetic field. The magnetic field was measured by a calibrated Hall gauge. To control the magnetic field value, one of the magnets was mounted on a micrometric translation stage that allowed longitudinal displacement.Portions of the coupling and probe beams were diverted to an auxiliary 40 m-long Rb cell filled with Ne gas to obtain an -resonance spectrum at = 0.
This spectrum served as frequency Reference-1. Furthermore, another portion of the probe beam was diverted to a Rb nano-cell with = to obtain a = 0 transmission spectrum, which served as frequency Reference 2 [11]. The optical radiation signals recorded by photodiodes (3) were amplified and recorded by a four-channel digital storage oscilloscope.
Although the best -resonance contrast and linewidth can be achieved for cells with thicknesses around 1 cm [2, 3, 4, 5, 6], using an MTC with a thickness as small as 30 to 40 m still allowed us to obtain good resonance parameters. The experimentally recorded -resonance spectra are presented in Fig. 2. The MTC side arm, whose temperature determines the density of Rb atoms, was maintained at C (Rb atomic vapor density 1013 cm-3). In the case of the pure Rb vapor (the upper curve) the change of the probe transmission over the -resonance was , and its lineshape was symmetric. For the buffered cell (the lower curve) the change was larger (), and the -resonance shape was asymmetric, consistent with the results reported in [5]. However, the sharp profile of the transmission signal in this case makes it convenient for studying the splitting of -resonances in a magnetic field.
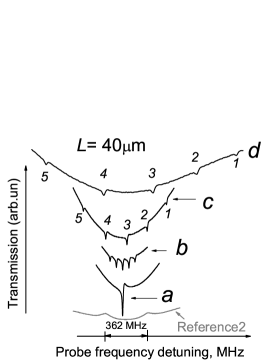
The -resonance was split into 5 components in a magnetic field. This splitting is shown in Fig. 3 for the -field range from 59 G to 460 G. The coupling and probe beam powers were 4 mW and 1 mW, with a beam diameter of 1.5 mm.
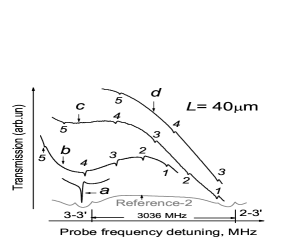
Spectra showing splitting for stronger -field values (808 - 1836 G) are presented in Fig. 4. Although the amplitudes of the -resonance components tended to decrease with , they were nevertheless easily observable up to = 2200 G. As can be seen from Fig. 3 and Fig. 4, the narrow linewidth of the -resonance makes it possible to achieve a spectral resolution that is higher by a factor of 5 as compared with the results obtained by the -Zeeman technique [9].
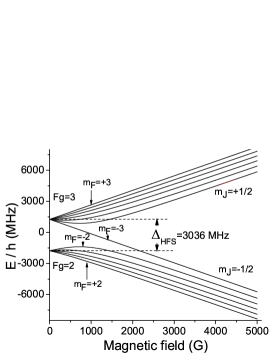
Figure 5 presents the dependence of the frequency of the magnetic sublevels of the 85Rb Fg=2,3 ground hyperfine states on the magnetic field, as calculated by a well-known model (see, for example, [11]). The system is described in the basis of F, mF in the low-field (Zeeman) regime, and in the basis of mJ, mI in the strong-field (hyperfine Paschen-Back [HPB]) regime, when B 700 G [9]. -resonance components are observed whenever the 2-photon resonance conditions are satisfied: (F=3, mF) (F=2, m.
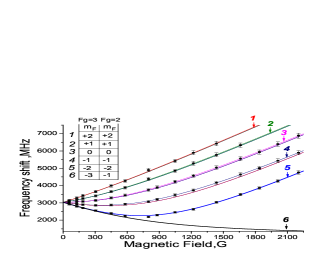
Figure 6 shows the magnetic field dependence of the frequency shift for the five observed -resonance components. Other -resonance components expected from the calculations and presented as thin solid lines in Fig. 6 are not observable in the experiment because at low fields ( 500 G) their separation from components 1-5 is unresolvably small (several MHz), while at high fields the atomic transition probabilities (line strengths) are reduced (either for the coupling or for the probe radiation) down to undetectable values (see component 6, undetectable at 500 G). Note that the slope of components 1-5 contains contributions from the -field shifts of the corresponding ground-state Zeeman sublevels Fg=2,3 (see Fig. 5). Thus, -resonance component 1 has the largest slope of 2.68 MHz/G in the region around 2 kG, that is, MHz/G from Fg=2, mF=+2, and MHz/G from Fg=3, mF=+2. For 1.5 kG an HPB regime becomes predominant. As a consequence, the slopes of components 1-5 tend to equalize at the same final value of 2.8 MHz/G .
The studies presented above indicate that Fg=2 is the initial, and Fg=3 is the final level for the -resonance. Based on these results, we believe the following physical mechanism is responsible for the origin of the -resonance.The probe radiation causes strong optical pumping, which transfers a large number of Rb atoms from the Fg=3 state to the Fg=2 state. The presence of buffer gas enhances efficiency of optical pumping, yet weakly influences the spectral broadening (at the given pressure). In consequence, an population condition is assured (where N2 and N3 are the populations of the Fg=2 and Fg=3 levels, respectively). This condition is schematically indicated by the large and small circles in the inset of Fig. 2. When the condition is satisfied, a strong two-photon absorption of the probe radiation Fg=2 Fg=3 occurs at the frequency , which results in the formation of an -resonance.
Note that the 30 m-thick Rb cell could be used to map strongly inhomogeneous magnetic fields with high spatial resolution. In particular, for a -field gradient of around 100 G/mm, the displacement of the MTC by 30 m results in a frequency shift of the -resonance component labeled 1 of around 8 MHz, which is easy to detect because of its sharp profile.
We thank F. Gahbauer for useful discussions.
References
- [1] M. Fleischhauer, A. Imamoglu, and J. P. Marangos, Rev. Mod. Phys. 77, 633–673 (2005).
- [2] A. S. Zibrov, C. Y. Ye, Y. V. Rostovtsev, A. B. Matsko, and M. O. Scully, Phys. Rev. A 65, 043817 (2002).
- [3] I. Novikova, D. F. Phillips, A. S. Zibrov, R. L. Walsworth, A. V. Taichenachev, and V. I. Yudin, Opt. Lett. 31, 2353–2355 (2006).
- [4] I. Novikova, D. F. Phillips, A. S. Zibrov, R. L. Walsworth, A. V. Taichenachev, and V. I. Yudin, Opt. Lett. 31, 622–624 (2006).
- [5] C. Hancox, M. Hohensee, M. Crescimanno, D. F. Phillips, and R. L. Walsworth, Opt. Lett. 33, 1536–1538 (2008).
- [6] I. Ben-Aroya, G. Eisenstein, Opt. Express 19, 9956 (2011).
- [7] S. Knappe, P. Schwindt, V. Shah, L. Hollberg, J. Kitching, L. Liew, J. Moreland, Opt. Express 13, 1249 (2005).
- [8] T. Baluktsian, C. Urban, T. Bublat, H. Giessen, R. Löw, T. Pfau, Opt. Lett. 35, 1950–1952 (2010).
- [9] A. Sargsyan, G. Hakhumyan, C. Leroy, Y. Pashayan-Leroy, A. Papoyan, D. Sarkisyan, Opt. Lett. 37, 1379 (2012).
- [10] G. Hakhumyan, A. Sargsyan, C.Leroy, Y. Pashayan-Leroy, A. Papoyan, D. Sarkisyan, Opt. Express. 18, 14577 (2010).
- [11] M. Auzinsh, D. Budker, S.M. Rochester, Oxford University Press: ISBN 978-0-19-956512-2 (2010).
References
- [1] M. Fleischhauer, A. Imamoglu, and J. P. Marangos, “Electromagnetically induced transparency: Optics in coherent media,” Rev. Mod. Phys. 77, 633–673 (2005).
- [2] A. S. Zibrov, C. Y. Ye, Y. V. Rostovtsev, A. B. Matsko, and M. O. Scully, “Observation of a three-photon electromagnetically induced transparency in hot atomic vapor,” Phys. Rev. A 65, 043817 (2002).
- [3] I. Novikova, D. F. Phillips, A. S. Zibrov, R. L. Walsworth, A. V. Taichenachev, and V. I. Yudin, “Comparison of 87Rb N-resonances for D1 and D2 transitions,” Opt. Lett. 31, 2353–2355 (2006).
- [4] I. Novikova, D. F. Phillips, A. S. Zibrov, R. L. Walsworth, A. V. Taichenachev, and V. I. Yudin, “Cancellation of light shifts in an N-resonance clock,” Opt. Lett. 31, 622–624 (2006).
- [5] C. Hancox, M. Hohensee, M. Crescimanno, D. F. Phillips, and R. L. Walsworth, “Lineshape asymmetry for joint coherent population trapping and three-photon N resonances,” Opt. Lett. 33, 1536–1538 (2008).
- [6] I. Ben-Aroya, G. Eisenstein, “Observation of large contrast electromagnetically induced absorption resonance due to population transfer in a three-level -system interacting with three separate electromagnetic fields,” Optics Express 19, 9956 (2011).
- [7] S. Knappe, P. Schwindt, V. Shah, L. Hollberg, J. Kitching, L. Liew, J. Moreland, “A chip-scale atomic clock based on 87Rb with improved frequency stability,” Opt. Express 13, 1249 (2005).
- [8] T. Baluktsian, C. Urban, T. Bublat, H. Giessen, R. Löw, T. Pfau, “Fabrication method for microscopic vapor cells for alkali atoms,” Opt. Lett. 35, 1950–1952 (2010).
- [9] A. Sargsyan, G. Hakhumyan, C. Leroy, Y. Pashayan-Leroy, A. Papoyan, D. Sarkisyan, “Hyperfine Paschen-Back regime realized in Rb nanocell,” Opt. Lett. 37, 1379 (2012).
- [10] G. Hakhumyan, A. Sargsyan, C.Leroy, Y. Pashayan-Leroy, A. Papoyan, D. Sarkisyan, “Essential Features of Optical Processes in Rb submicron Thin Cell Filled with Neon Gas,” Opt. Express. 18, 14577 (2010).
- [11] M. Auzinsh, D. Budker, S.M. Rochester, “Optically Polarized Atoms: Understanding Light-Atom Interactions,” Oxford University Press: ISBN 978-0-19-956512-2 (2010).