Evolution from a nodeless gap to form in underdoped La2-xSrxCuO4
Abstract
Using angle-resolved photoemission (ARPES), it is revealed that the low-energy electronic excitation spectra of highly underdoped superconducting and non-superconducting La2-xSrxCuO4 cuprates are gapped along the entire underlying Fermi surface at low temperatures. We show how the gap function evolves to a form as increasing temperature or doping, consistent with the vast majority of ARPES studies of cuprates. Our results provide essential information for uncovering the symmetry of the order parameter(s) in strongly underdoped cuprates, which is a prerequisite for understanding the pairing mechanism and how superconductivity emerges from a Mott insulator.
pacs:
74.72.Gh, 74.25.Jb, 79.60.BmIn the Bardeen-Cooper-Schriefer (BCS) theory of superconductivity, the symmetry of the superconducting gap reflects the order parameter of the superfluid state and is directly tied to the symmetry of the interactions driving the formation of Cooper pairs. Similarly, other ordered phases, such as charge- or spin-density wave states, can induce gaps whose symmetries are connected to the underlying order parameters. Thus in high-temperature superconductors, where superconductivity is found in close proximity to magnetic and charge order, the symmetry of the gap function is of critical theoretical importance. It is now widely accepted that the superconducting gap in moderately hole-doped high-temperature superconducting copper oxides (cuprates) exhibits a node located along the diagonal (0,0)-(,) line of the Brillouin zone (BZ) Damascelli2003 ; Chatterjee2010 , consistent with an overall gap function of pure symmetry Tsuei2000 . A key issue is whether is the only form of the gap function for all cuprates over the full range of dopings. Using angle-resolved photoemission (ARPES) we reveal that the low-energy electronic excitation spectra of highly underdoped superconducting and non-superconducting La2-xSrxCuO4 (LSCO) are gapped along the entire underlying Fermi surface (FS) at low temperatures. On the zone diagonal, gapless excitations appear as the temperature and/or doping is increased, and the gap function evolves to a form.
High quality single crystals of superconducting and non-superconducting La2-xSrxCuO4 were grown using the traveling solvent floating zone method. ARPES experiments were carried out at the Surface and Interface Spectroscopy beamline at the Swiss Light Source (SLS). Circularly polarized light with eV was used. The spectra were recorded with a Scienta R4000 electron analyzer. The energy resolutions was about 14 - 17 meV.
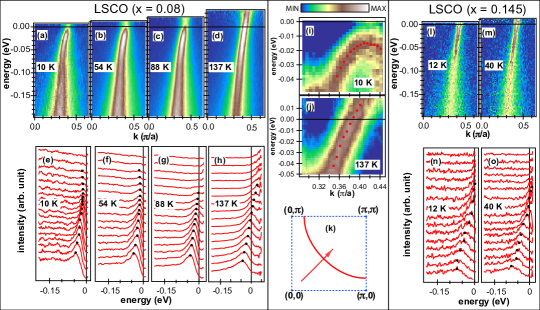
In Fig. 1(a)-(d) we show ARPES spectra below and above the superconducting transition temperature () for highly underdoped superconducting LSCO (, K) along the diagonal line of the BZ. The spectra were obtained by deconvoluting the raw ARPES data to remove the broadening due to the finite instrumental resolution and then dividing the deconvoluted spectra by a Fermi distribution function [deconvolution - Fermi function division (DFD) method] Yang2008 . Relative to , a gap is clearly observed both below (10 K) and above (54 K). The gap closes above K. To reveal the details of the gap, we trace the dispersion in the vicinity of . In Fig. 1(e)-(h) we plot energy distribution curves (EDCs) from Fig. 1(a)-(d) along the zone diagonal cut. At low temperatures (10 K and 54 K), moving from (0,0) to (,), the peak position of the EDCs approaches , but before reaching it recedes to higher binding energies (Fig. 1(e)-(f)). The spectral peak reaches at 88 K (Fig. 1(g)) and crosses at higher temperatures [Fig. 1(h)], signaling the closure of the gap. In Fig. 1 (i)-(j) the dispersion bending back below at 10 K and crossing at 137 K are better visualized by normalizing each EDC to its peak intensity.
In contrast to the observation of an energy gap along (0,0)-(,) at low temperatures for LSCO (), we did not find such a gap in the spectra of the optimally doped LSCO (, K) sample. The spectral peak in this higher hole-doped sample continuously moves to higher energies and crosses , even at temperatures down to 12 K [Fig. 1(l)-(o)].
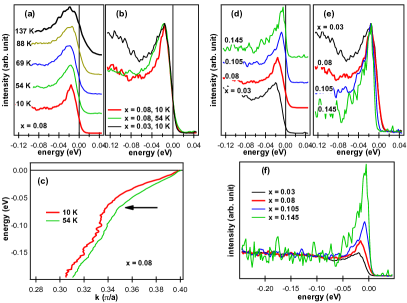
A general observation in cuprates is that when is crossed by decreasing the temperature, EDC peaks near the Fermi momentum () along an off-nodal cut sharpen, an energy gap opens at , and the renormalization of the band dispersion becomes more pronounced. This behavior was also observed in our ARPES spectra for LSCO () along the diagonal cut [red arrow in Fig. 1 (k)]. In Fig. 2(a)-(b) we plot the EDCs at the on the zone diagonal line as a function of temperature. The EDC peak width at 10 K () is considerably smaller than when the spectrum is measured above ( K) [Fig. 2(b)]. At low temperature (10 K) the peak width of the superconducting sample LSCO () is also smaller than that of the non-superconducting sample () [Fig. 2(b)], which indicates the change in the peak width is associated with the superconducting transition. The anomalous “kink” in the dispersion along the nodal direction, which is well-known from previous ARPES studies Kaminski2001 ; Lanzara2001 ; Gromko2003 , becomes more pronounced below [Fig. 2(c)], showing that the renormalization is enhanced in the superconducting state. To gain more insight about the differences between the spectra in the superconducting and non-superconducting phases, Fig. 2(d)-(f) shows the EDCs as a function of doping at 10 K. The EDC peak positions of the and 0.08 samples occur at higher binding energy than in the and 0.145 samples [Fig. 2(d)], in which a simple superconducting gap was observed Shi2008 ; Shi2009 . An energy gap of meV along the (0,0)-(,) is also seen in the non-superconducting sample () at 10 K. For the superconducting samples, after aligning the peaks to the same position, the falling edges of the EDC peaks are almost identical at low binding energies [Fig. 2(e)], which demonstrates that the coherent peaks have the same width in the superconducting state, and this width is smaller than that of the non-superconducting sample. We observe that underdoping increases the transfer of spectral weight from the coherent peak to high binding energies [Fig. 2(f)].
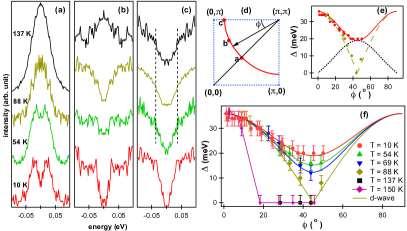
The momentum dependence of the gap as a function of temperature is shown in Fig. 3. The measured raw EDCs at were symmetrized to remove the effects of the Fermi function Norman1998 . In the superconducting state, the extracted gap sizes were defined as half the peak-to-peak separation of the symmetrized EDCs. Above , for those spectra having no coherent peak, the gap was defined as half the distance between the two locations where the slope has the largest change, as indicated by vertical lines in Fig. 3(c). For LSCO (), the energy gap is highly anisotropic [Fig. 3(f)]. It has a maximal value at the zone boundary () and decreases monotonically along the FS to a minimum at the zone diagonal (). However, at low temperatures, the gap () function strongly deviates from a pure form,
| (1) |
where is the lattice constant. Below at the on zone diagonal, a finite gap (hereafter we use the term “diagonal gap” for simplicity) is observed, which has an amplitude of meV. As the temperature is increased, the diagonal gap monotonically decreases. It disappears at K, at which point the gap function is very close to a pure form [Fig. 3(f)]. At higher temperatures, gapless excitations appear on a portion of the FS centered at the zone diagonal (Fermi arc) and the arc length increases with temperature, a phenomenon that has been observed in early ARPES work of underdoped Bi2Sr2CaCu2O8+δ(Bi-2212) Kanigel2006 and other cuprates. In contrast to the temperature dependence of the diagonal gap, the gap size near the zone boundary is insensitive to temperature in the range of 10 K - 150 K; it always has a value of meV [Fig. 3(f)].
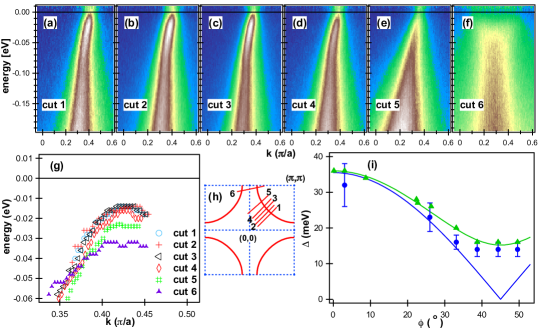
The gap function obtained from the symmetrization method, in which particle-hole symmetry is assumed, is confirmed with an independent procedure. We have collected high-statistics ARPES spectra [Fig. 4(a)-(f)] along some selected cuts [Fig. 4(h)] and then applied the DFD method to trace the dispersion in the vicinity of . The energy gap was determined from the difference between and the maximal energy that a back-bending dispersion reaches [Fig. 4 (g)]. Fig. 4(i) shows the results of such an analysis applied to the data taken at 54 K. Within the error bars, the obtained gap function is consistent with that derived from the symmetrization method.
To explain our results, one natural line of thinking is to assume that both the superconducting gap and the pseudogap have form, and the combination of disorder with long-range Coulomb interactions depresses the density of single-particle excitations at , forming a so-called Coulomb gap Shen2004 ; Pan2009 . A counter argument to this picture is that the scattering due to the disorder should also reduce the lifetime of quasiparticles, which would be manifested as severe broadening in the ARPES lineshapes. Such broadening is not seen in the data, where instead the widths of the EDCs are the same in the superconducting state for samples with different dopings. Moreover, these widths are smaller than those at or in the non-superconducting sample at low temperature (Fig. 2). One could instead consider a scenario in which an ordered phase (e.g., a spin-density wave Doiron2012 ; Sachdev2010 ) or its flutuations above opens an energy gap along the entire FS in lightly doped LSCO (). In such a picture, this phase is different from the superconducting instability, and below it coexists with the superconducting phase, which has a order parameter. The end form or the combination of these two order parameters would produce an energy gap on the entire FS. Recent Monte Carlo simulations have shown that a strong fluctuating competing order could open a diagonal gap in the superconducting phase, and a gap function is restored with reduced amplitudes of the fluctuating competing order Andersen2012 . This scenario would explain why the diagonal gap is open in LSCO and 0.03 at low temperatures and is closed for , since it has been suggested that disordered magnetism is present at low doping and disappears at optimal doping Andersen2007 ; Andersen2010 . The open question is how to account for the similar momentum dependence of the gap above and below in LSCO (), as well as the fact that the amplitude of the gap at the anti-node is relatively insensitive to temperature. An alternative explanation is that in LSCO there is a critical doping point below which the superconducting gap function changes from to another form. The pseudogap at is a precursor to superconductivity Emery1995 ; Randeria1992 ; Gomes2007 ; Li2010 , which has similar momentum dependence and amplitude as the superconducting gap. To study the symmetry of the gap function in the superconducting state of the highly underdoped LSCO () sample, we have compared the obtained gap function at 10 K [Fig. 3(e)-(f)] with those of all allowed spin-singlet even-parity pair states in cuprates Annett1990 ; Tsuei2000 . The only order parameter basis function that is nodeless in its pure form is the -wave state. However, although this order parameter is nodeless, its momentum dependence is not compatible with the observed momentum dependence of the energy gap. A combination of two real subcomponents of different superconducting order parameters, such as a mixed gap Khasanov2007 , will only shift the node(s) along the FS, which cannot produce a nodeless gap structure. By considering all the possible nodeless mixed gap function we find that the combination of gaps is the only form that can reproduce the momentum dependence of the measured gap function quantitatively. In Fig. 3(e) we plot and , as well as the modulus of their sum , as a function of FS angle (), where
| (2) |
We take and , where and are the measured gap sizes at the zone boundary and the zone diagonal, respectively. The pre-factor of 1.07 comes from where is the intersection of the FS and the zone boundary. Remarkably, excellent agreement is found between the experimental data and the mixed gap function along the entire FS for all the temperatures. To see this, we simply hold constant and use the measured gap sizes on the zone diagonal for the amplitude of the contribution to the mixed gap at different temperatures. The results are shown in comparison to the data in Fig. 3(f). Interestingly, the mixed pair state implies that the time-reversal symmetry is broken in the system Tsuei2000 , which has been embodied in early theories of quantum phase transitions Vojta2000 ; Varma2006 .
To summarize, our main experimental findings are: 1) for highly underdoped LSCO (), in the superconducting state the electronic excitations are gaped along the entire underlying FS; 2) the diagonal gap persists above while increasing the temperature and/or reducing the hole-concentration; 3) whereas the gap size on zone boundary remains constant up to 150 K, the diagonal gap is temperature-dependent; 4) when the diagonal gap decreases to zero, it leaves behind a pure energy gap, at which point a Fermi arc emerges and its length increases with temperature. Our observations in highly underdoped LSCO could be explained either by a strong fluctuating competing order which is different from the superconducting order parameter Andersen2012 , or by a mixed gap function occurring when the doping is below a quantum critical point Vojta2000 . The entirely gapped Fermi surface in highly underdoped LSCO is a profound departure from the form observed at moderate to high doping. Further investigations of the origins of this nodeless gap function and its evolution to pure form promise to shed light on how superconductivity emerges from the Mott insulating state in high- cuprates.
We thank M.R. Norman, T.M. Rice, M. Sigrist and C. Bernhard for useful discussions. This work was supported by the Swiss National Science Foundation (through MaNEP, grant No. 200020-105151) and by the Israeli Science Foundation. We thank the beamline staff of X09LA at the SLS for their excellent support.
References
- (1) A. Damascelli, Z. Hussain, Z.-X. Shen, Rev. Mod. Phys. 75, 473 (2003).
- (2) U. Chatterjee et al., Nature Phys. 6, 99 (2010).
- (3) C. C. Tsuei, and J. R Kirtley, Rev. Mod. Phys. 72, 969 (2000).
- (4) H. B. Yang et al., Nature (London) 456, 77 (2008).
- (5) A. Lanzara et al., Nature (London) 412, 510–514 (2001).
- (6) A. Kaminski et al., Phys. Rev. Lett. 86, 1070 (2001).
- (7) A. D. Gromko et al., Phys. Rev. B 68, 174520 (2003).
- (8) M. Shi et al., Phys. Rev. Lett. 101, 047002 (2008).
- (9) M. Shi et al., Europhys. Lett. 88, 27008 (2009).
- (10) M. R. Norman et al., Nature (London) 392, 157 (1998).
- (11) A. Kanigel et al., Nature Phys. 2, 447 (2006).
- (12) K. M. Shen et al., Phys. Rev. B 69, 054503 (2004).
- (13) Z.-H. Pan et al., Phys. Rev. B 79, 092507 (2009).
- (14) N. Doiron-Leyraud and L. Taillefer, preprint arXiv: 1204.0490v1 (2012).
- (15) S. Sachdev, Physica C 470, S4 (2010).
- (16) W. A. Atkinson, D. J. Bazak and B. M. Andersen, preprint arXiv:1206.2313v1 (2012).
- (17) B. M. Andersen, P. J. Hirschfeld, A. P. Kampf and M. Schmid, Phys. Rev. Lett. 99, 147002 (2007).
- (18) B. M. Andersen, S. Graser and P. J. Hirschfeld, Phys. Rev. Lett. 105, 147002 (2010).
- (19) V. J. Emery and S. A. Kivelson, Nature (London) 374, 434 (1995).
- (20) M. Randeria, N. Trivedi, A. Moreo, and R. T. Scalettar, Phys. Rev. Lett. 69, 2001 (1992).
- (21) K. K. Gomes et al., Nature (London) 447, 569 (2007).
- (22) L. Li et al., Phys. Rev. B 81, 054510 (2010).
- (23) J.F. Annet, Adv. Phys. 39, 83 (1990).
- (24) R. Khasanov et al., Phys. Rev. Lett. 99, 237601 (2007).
- (25) M. Vojta, Y. Zhang, and S. Sachdev, Phys. Rev. Lett. 85, 4940 (2000).
- (26) C. M. Varma, Phys. Rev. B 73, 155113 (2006).