Role of osmotic and hydrostatic pressures in bacteriophage genome ejection
Abstract
A critical step in the bacteriophage life cycle is genome ejection into host bacteria. The ejection process for double-stranded DNA phages has been studied thoroughly in vitro, where after triggering with the cellular receptor the genome ejects into a buffer. The experimental data have been interpreted in terms of the decrease in free energy of the densely packed DNA associated with genome ejection. Here we detail a simple model of genome ejection in terms of the hydrostatic and osmotic pressures inside the phage, a bacterium, and a buffer solution/culture medium. We argue that the hydrodynamic flow associated with the water movement from the buffer solution into the phage capsid and further drainage into the bacterial cytoplasm, driven by the osmotic gradient between the bacterial cytoplasm and culture medium, provides an alternative mechanism for phage genome ejection in vivo; the mechanism is perfectly consistent with phage genome ejection in vitro.
pacs:
87.15.A−, 82.35.Pq, 82.39.Pj, 87.15.N−I introduction
Bacteriophages — phages for short — are viruses that infect bacteria. In order to infect a host, the phage tail ( phage virions contain tails) attaches to a bacterium, which triggers the opening of the tail, and the genome (usually double-stranded DNA) is delivered, in some cases together with protein molecules, into the cytoplasm. Inside the capsid, the genome is packaged at near crystalline density (500 mg/ml for many double-stranded DNA phages earn ), where it is in a state of high free energy due to DNA self-interactions (causing high osmotic pressure within a mature phage) and, to a lesser extent qiu , the mechanical energy cost incurred in bending the polymer into a compartment with a radius comparable to DNA’s persistence length. Energy for genome packaging is provided by the bacterial cell in which the phage was assembled. From a purely thermodynamic perspective, the stored free energy within the capsid can provide the driving force for DNA ejection, with the DNA acting essentially as a “loaded spring” that expands when opening of the tail is triggered. (There may be separate gates at the junction of the capsid and the tail tip, but we only consider the situation where all gates are either open or closed.) The loaded spring concept has been formalized in a continuum mechanics model tzlil ; purohit ; inam . Keeping in mind that the model applies only to equilibrium states, and not to the dynamics or molecular mechanism of the process, it successfully explains in vitro data for phage DNA ejection. Such experiments include the addition of capsid-permeable DNA-condensing agents or capsid-impermeable osmolytes to arrest ejection when the DNA remaining in the capsid reaches equilibrium with the buffer alex1 ; gray1 ; alex2 ; wu and time-resolved light scattering lof . In addition, fluorescence microscopy experiments following in vitro DNA ejection in real time at the single-molecule level show that the genome is ejected in a single step at an ion-dependent rate, but one that is not a simple function of the amount of DNA remaining in the capsid wu ; gray2 .
Experimental data on osmotic suppression of DNA ejection of phage SPP1 jose are consistent with the continuum mechanics model, but those on T5 are less so. The extent of T5 DNA ejected after tail triggering is not proportional to low external osmotic pressure and different populations co-exist at equilibrium lef1 . Further, DNA remaining in individual capsids was shown to undergo several phase transitions as ejection proceeds lef2 , and there are distinct pauses where DNA exit from individual particles is temporarily halted mang ; chia . These pauses do not correspond to the natural nicks in the T5 genome, which are also not required for pausing, and each re-starting event requires overcoming the same activation energy chia ; defrutos ; rasp . It is not known what causes pausing during T5 DNA ejection.
It is natural to imagine that the loaded spring concept extrapolates directly to DNA ejection in vivo, where the ejection medium consists of the bacterial cytoplasm instead of a buffer solution. It has, however, recently been argued that many features of phage DNA ejection in vivo are incompatible with this simple concept mol ; gray3 ; panja . These include the problems that the osmotic pressure inside growing bacteria should prevent complete ejection of the genome, the efficiency of phage infection being reduced when bacterial turgor is low (the stationary phase of bacterial growth), ejection of proteins before (and also likely after) DNA ejection, and that some phages do not contain DNA packaged to high density. Furthermore, several phage types are known to eject their DNA slowly into the bacterial cytoplasm in two or more distinct phases. These observations suggest mechanism(s) other than the loaded spring may contribute to DNA ejection in vivo.
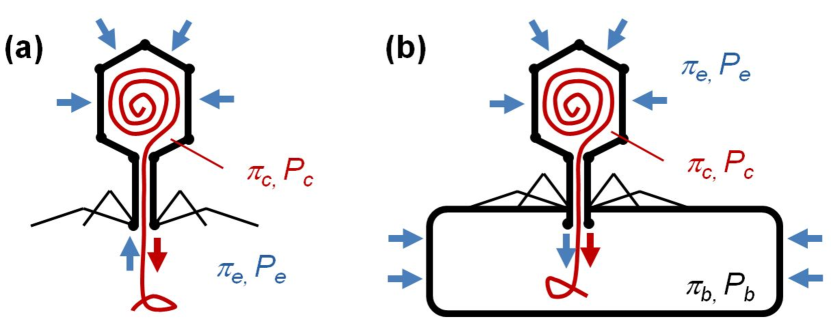
In vitro ejection into a buffer is a two compartment process (capsid, bacterium), with distinct osmotic and hydrostatic pressures in each compartment. In vitro, the net thermodynamic potential gradient for water movement up the tail-tube, which directly connects the two compartments, is positive, so water tends to flow up the tail-tube (see later). Ejection into a bacterium (in vivo), however, differs in subtle ways from ejection into a buffer. In particular, ejection in vivo involves three distinct compartments (bacterium, capsid, environment) instead of two in vitro. This is sketched in Fig. 1. Each compartment, again, has distinct osmotic and hydrostatic pressures, with ramifications for the transport of the genome out of the phage.
Growing bacteria continuously draw in water from the environment. For this to occur, a pressure imbalance (osmotic and/or hydrostatic) must exist between the bacterium and the environment. We argue that the capsid takes osmotic and hydrostatic pressure values that are intermediate to those of the environment and the cytoplasm, leading to water always flowing down the tail-tube. While the rate of water entry into the cytoplasm through the tail tube is at least three orders of magnitude smaller than that through the cytoplasmic membrane, it can exert significant local forces on DNA inside the tail tube. Further, the pressure imbalance represents a separate driving force for genome ejection, independent of the physics of the loaded spring model. The hydrodynamic model of genome ejection mol ; gray3 ; panja is consistent with many of the in vivo observations that are not readily explained by the loaded spring concept panja . We further argue below that the model has ramifications for the interpretation of in vitro data, in particular the dynamics of ejection.
To date, the hydrodynamic model has remained relatively qualitative gray3 ; panja . The purpose of the present article is to present a simple explicit formulation of the model that retains its key physical ingredients. Particular emphasis is given to the fact that the hydrostatic pressure inside the viral capsid is free to adjust in response to DNA ejection, a factor that has been largely ignored. We show that such an analysis can assist the interpretation of existing experiments, as well as guide the creation of artificial model systems in which the physics of genome ejection can be further elucidated.
II Description of the model
In general, we consider three compartments, namely, the inside of the capsid, the bacterial cytoplasm and the surrounding culture medium (environment). We denote the osmotic and the hydrostatic pressures of these compartments by , and , respectively. The variables and are treated as constants that characterize the environment; and similarly define the state of the bacterial cytoplasm, is a monotonically decreasing function of the amount of DNA remaining in the capsid, and is free to adjust to the dynamics of DNA ejection. The thermodynamic potential for water movement from compartment to compartment is simply given by
| (1) |
Assuming for simplicity that both water and the capsid are incompressible, during the ejection process the continuity equation for water movement implies that the rate at which DNA volume exits the capsid equals the volume rate of the net water entry into the capsid at all times. Water entry into (or exit out of) the capsid can occur via two distinct paths, namely, by permeating through the capsid or by flowing through the tail tube. Having noted that the available cross-section of the tail-tube is much smaller than the capsid cross-section, we assume that permeation through the capsid is the dominant contribution to . This simplification can easily be relaxed, but only at the cost of complicating the analytical form of the final results without yielding additional insights into the underlying physics. We further assume that (i) ejection is sufficiently slow that all compartments (bacterium, capsid and environment) remains well-stirred (or equivalently, the water is fully equilibrated) in all compartments at all stages of ejection, i.e., the osmotic and hydrostatic pressures are uniquely, and uniformly, defined in all compartments, and (ii) water entry into the capsid from the environment is in the linear response regime. Under these conditions,
| (2) |
Here is the cross-sectional area of the DNA, is the speed of DNA ejection, and is the capsid’s permeability to water.
Having neglected the rate of water flow through the tail tube in comparison to the rate of water entry into the capsid from the environment through the capsid shell, the dynamics of genome ejection both in vitro and in vivo are qualitatively the same; namely that water osmosis into the capsid from the environment is accompanied by DNA ejection from the capsid. The physical force responsible for DNA ejection is the hydrostatic pressure gradient acting on the DNA across the tail tube, and the corresponding work done in ejecting the DNA is derived from the free energy made available as water crosses the capsid shell [from the environment (with osmotic pressure ) into the capsid (with osmotic pressure , where )].
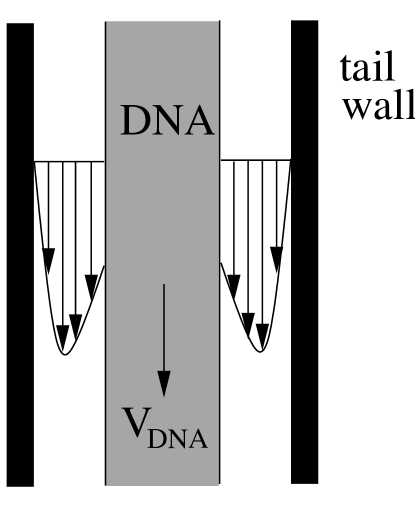
Although we neglect the contribution of the hydrodynamic flow of water in the tail for the purpose of determining the total flux of water into the capsid, flow in the tail does influence conditions locally. Specifically, any flow of water in the tail, , exerts a force on DNA, also located in the tail, via hydrodynamic drag. In order to estimate this force, we represent the DNA as a cylinder of radius (i.e., ), and let the axis of the moving DNA coincide with the axis of the tail tube at all times during ejection. We denote the inner radius of the tail tube by . We further apply no-slip boundary conditions at the surface of the DNA and at the inner surface of the tail tube. Under this simplified geometry, the velocity profile for water in the tail tube, , exhibits cylindrical symmetry and is only a function of , the radial distance measured from the axis of the DNA, and can be easily determined by solving the Stokes equation, (with no-slip boundary conditions). Here is the (dynamic) viscosity of water, is the length of the tail-tube and represents or for in-vitro and in vivo, respectively. The resulting flow velocity pattern of water through the gap between the DNA and the tail-tube, shown schematically in Fig. 2. The magnitude of the corresponding hydrodynamic drag exerted by the fluid on the outgoing DNA, , is
| (3) |
Note that with being a combination of fixed parameters and the freely adjustable capsid pressure, the rhs of Eq. (3) contains two unknowns: the DNA velocity, , and the hydrostatic pressure of the capsid, . In order to uniquely determine these quantities, we treat the in vitro and in vivo cases separately.
III Hydrodynamic model for in vitro ejection
In the in vitro experiments the phage is immersed in a buffer solution, creating a two-compartment configuration: one compartment is the inside of the capsid, while the other is the environment (around the capsid). Before the opening of the tail is triggered, there is no net movement of water between these two compartments, consequently and panja
| (4) |
This is analogous to the classic case of the van ’t Hoff water columns.
Following triggering of the tail, DNA begins to exit the capsid while water simultaneously enters the capsid from the environment. In order to obtain an explicit expression for , it is necessary to specify the relationship between and the current state of the system. In principle, this requires knowledge of the free energy stored in the configuration of the DNA confined inside the capsid. This free energy is a sum of the interaction energy of the capsid content (DNA, water, ions and possibly other protein molecules), and the mechanical energy stored in the DNA due to its packaging in tight circles. The “mechanical” energy is however an order of magnitude smaller than the contribution from interactions qiu ; in the spirit of constructing the simplest model that captures the role of hydrodynamics, we therefore neglect it here. With this simplification, the force acting on the partially ejected DNA that experiences a hydrostatic pressure difference across the tail-tube is given by .
Thus, having denoted the effective mass of the mobile DNA by (where it is reasonable to assume that is of the order of the mass of the DNA cylinder within the tail tube) and combining Eqs. (1), (2) and (3), we have
| (5) |
and correspondingly,
| (6) |
Equation (5) is easily solved as an integral equation for , in which sets the (transient) time-scale beyond which the inertial term term is not relevant. The transient time-scale for typical tail-tube diameters and lengths is estimated to be in the range of microseconds. Given that the time-scales for in vitro ejection is in the range of seconds gray2 , we neglect the intertial term, which leads us to
| (7) |
For the hydrostatic pressure within the capsid, the result (7) points to two distinct possible regimes. (a) For high capsid permeability to water () the hydrostatic pressure gradient simply follows the osmotic gradient in a manner analogous to Eq. (4). (b) In the opposite limit, i.e., for low capsid conductivity, the hydrostatic pressure gradient, , decreases abruptly when the DNA starts to eject following the triggering of the tail. The latter is the scenario considered for in vitro DNA ejection in Ref. panja .
Which limit, or where between the limits one should observe, is not a priori obvious. Given that the choice depends on the relative ease of water and DNA transport between the capsid and the environment, the choice likely depends on the phage studied. Some phages are resistant to severe osmotic downshifts; for example, T7 infects normally when a suspension in M CsCl is added directly to cells. Conversely, the classic Kleinschmidt picture of T2 DNA emanating from a ruptured capsid is a result of rapid dilution of a phage suspension in 2M ammonium acetate klein . The resistance to osmotic downshift should correlate well to the mobility of water through the capsid membrane. In that case we would expect T7 to conform more closely to limit (a) than T2, which would be closer to limit (b).
The final important point to note is that when all motions of the DNA and water cease, i.e., at the end of ejection (partial or complete as it may be), then Eq. (7) indicates that both osmotic and hydrostatic pressure gradients between the environment and the capsid become zero. These situations correspond to the osmotic suppression experiments alex1 ; gray1 ; alex2 ; wu ; jose ; lef1 ; complete suppression of ejection yields an estimate of the osmotic pressures in a mature phage particle: atm for , atm for SPP1, and atm for the deletion mutant T5st(0).
IV Hydrodynamic model for In vivo ejection
For in vivo situations, it is important to appreciate that water uptake by the cytoplasm from the culture medium is very tightly regulated in a growing bacterium, which maintains an active osmotic gradient between the environment and the cytoplasm. A corresponding hydrostatic pressure gradient (turgor) helps the bacterium enlarge koch . For instance, the E. coli cytoplasm has a positive osmotic pressure of several atm above the environment (under various growth conditions the pressure has been estimated to vary between 2 and 15 atm, with 3.5-5 atm being commonly accepted values stock ; koch1 ). This osmotic pressure gradient is counter-balanced by a hydrostatic pressure differential (turgor) koch that enables the cell to enlarge during growth koch2 . Gram-positive cells, such as Bacillus subtilis, the host for phage SPP1, have much higher turgor: atm what . When the cell membrane is breached by an infecting phage, a new conduit opens up for water to enter from the environment into the cell cytoplasm by passing through the phage capsid. For the following analysis, we treat the cytoplasm as a uniform, well-stirred medium for which the osmotic and the hydrostatic pressures and remain constant during ejection. This is reasonable as bacteria respond to osmotic perturbations within milliseconds.
This situation is analogous to the in vitro case, with two important modifications: First, the thermodynamic potential difference for water transport between the environment (culture medium) and the bacterial cytoplasm, , which, in the light of the above paragraph, is a strictly positive quantity for a growing bacterium, is given by
| (8) |
Secondly, the hydrodynamics in the tail tube is driven by the themodynamic potential difference for water transport from the capsid into the bacterial cytoplasm, i.e.,
| (9) |
We then use the continuity of water flow across the capsid shell (2) to write
| (10) | |||||
Once again, we neglect the inertial term [i.e., the transient time ], and obtain the expressions for and as
| (11) |
Equation (11) shows that the rate of DNA ejection is enhanced, irrespective of the osmotic pressure difference between the capsid and the bacterium; the driving force behind this enhancement being the hydrodynamic drag of water on the DNA in the tail tube, while the source of free energy being the osmotic imbalance between the bacterium and its environment mol ; gray3 ; panja . As pointed out in Ref. panja , aiding the DNA ejection in vivo is consistent with infection phenomenology. No phage can complete genome ejection without the term in Eq. (11) nrm . It is worthwhile to note in this context that the DNA genome of phage P2 and its relatives is packaged at a lower density than many other phages, and a P4 genome has been packaged in a P2 capsid to yield an infective particle in vivo pruss . The genome length of P4 is only one-third that of P2 and the internal osmotic pressure is less than is necessary to even initiate DNA release into the cytoplasm with only at its disposal. Note also that upon setting , we recover the in vitro results as of course we should.
V Conclusions
We have introduced a simple model of genome ejection in terms of the hydrostatic and osmotic pressures inside a phage, a bacterium, and the surrounding medium. This model shows explicitly that the osmotic balance between a bacterium and its environment provides a second source of free energy for driving genome ejection that is independent of the free energy stored in the configuration of the DNA in the capsid. The model also demonstrates that water transport into the capsid and hydrodynamic drag on the DNA in the tail pipe can profoundly influence the rate of genome ejection, both in vitro and in vivo. Further refinements to the hydrodynamic model in the simple form described here can be envisioned, for example accounting for a finite capsid elasticity or for the mechanical energy stored in the DNA, and this may prove necessary for a quantitative comparison with experiments. However, such refinements are not expected to significantly change the physical picture described here.
Acknowledgements.
We thank C. M. Knobler and W. M. Gelbart for insightful discussions. SGL acknowledges financial support from the European Research Council (ERC) and the Netherlands Organization for Scientific Research (NWO).References
- (1) W. C. Earnshaw and S. R. Casjens, Cell 21, 319 (1980).
- (2) X. Qiu et al., Phys. Rev. Lett. 106, 028102 (2011).
- (3) S. Tzlil, J. T. Kindt, W. M. Gelbart and A. Ben-Shaul, Biophys J. 84, 1616 (2003).
- (4) P. K. Purohit et al., Biophys J. 88, 851 (2005).
- (5) M. M. Inamdar, W. M. Gelbart and R. Phillips, Biophys. J. 91 411 (2006).
- (6) A. Evilevitch et al., Proc. Nat. Acad. Sci. USA 100, 9292 (2003).
- (7) P. Grayson et al., Virology 348, 430 (2006).
- (8) A. Evilevitch et al., Biophys. J. 94 1110 (2008).
- (9) D. Wu, D. van Valen, Q. Hu and R. Phillips, Biophys. J. 99, 1101 (2010).
- (10) D. Löf, K. Schillén, B. Jönsson and A. Evilevitch, J. Mol. Biol. 368, 55 (2007).
- (11) P. Grayson, L. Han, T. Winther and R. Phillips, Proc. Nat. Acad. Sci. USA 104, 14652 (2007).
- (12) C. São-José et al., J. Mol. Biol. 374, 346 (2007).
- (13) A. Leforestier et al., J. Mol. Biol. 384, 730 (2008).
- (14) A. Leforestier and F. Livolant, J. Mol. Biol. 396, 384 (2010).
- (15) S. Mangenot, M. Hochrein, J. Rädler and L. Leterllier, Curr. Biol. 15, 430 (2005).
- (16) N. Chiaruttini et al., Biophys J. 99 447 (2010).
- (17) M. de Frutos, L. Letellier and E. Raspaud, Biophys. J. 88, 1364 (2005).
- (18) E. Raspaud et al., Biophys. J. 93, 3999 (2007).
- (19) I. J. Molineux, Virology 344, 221 (2006).
- (20) P. Grayson and I. J. Molineux , Curr. Op. in Microbiol. 10, 401 (2007).
- (21) D. Panja and I. J. Molineux, Phys. Biol. 7, 045006 (2010).
- (22) A. K. Kleinschmidt, D. Lang D, D. Jacherts and R. K. Zahn, Biochim. Biophys. Acta 1000 41-48 (1989). This is a reprint of the original article in German [A. K. Kleinschmidt, D. Lang D, D. Jacherts and R. K. Zahn, Biochim. Biophys. Acta 61 857 (1962)].
- (23) A. L. Koch, Crit. Rev. Microbiol. 24, 23 (1998).
- (24) J. B. Stock, B. Rauch and S. Roseman, J. Biol. Chem. 252, 7850 (1977).
- (25) A. L. Koch, Adv. Microbiol. Physiol. 24, 301 (1983).
- (26) A. L. Koch, J Bacteriol. 159 919 (1984).
- (27) A. M. Whatmore and R. H. Reed, J. Gen. Microbiol. 136 2521 (1990).
- (28) I. J. Molineux and D. Panja, Nat. Rev. Microbiol. 11, 194 (2013).
- (29) G. Pruss, R. N. Goldstein and R. Calendar, Proc. Natl. Acad. Sci. (USA) 71, 2367 (1974).