Sequence-dependent thermodynamics of a coarse-grained DNA model
Abstract
We introduce a sequence-dependent parametrization for a coarse-grained DNA model [T. E. Ouldridge, A. A. Louis, and J. P. K. Doye, J. Chem. Phys. 134, 085101 (2011)] originally designed to reproduce the properties of DNA molecules with average sequences. The new parametrization introduces sequence-dependent stacking and base-pairing interaction strengths chosen to reproduce the melting temperatures of short duplexes. By developing a histogram reweighting technique, we are able to fit our parameters to the melting temperatures of thousands of sequences. To demonstrate the flexibility of the model, we study the effects of sequence on: (a) the heterogeneous stacking transition of single strands, (b) the tendency of a duplex to fray at its melting point, (c) the effects of stacking strength in the loop on the melting temperature of hairpins, (d) the force-extension properties of single strands and (e) the structure of a kissing-loop complex. Where possible we compare our results with experimental data and find a good agreement. A simulation code called oxDNA, implementing our model, is available as free software.
I Introduction
Living organisms store genetic information in DNA, a double-stranded polymer composed of a sugar-phosphate backbone with four different kinds of bases (adenine A, thymine T, cytosine C or guanine G) attached. The bases have highly anisotropic mutual interactions that are responsible for the formation of non-trivial structures, such as helical double strands, primarily through hydrogen bonding and stacking interactions. To a first approximation, base-pairing occurs between complementary base pairs (A-T and G-C).Saenger1984 Given the reliability and programmability of base-pair formation, DNA is an obvious candidate for use in self-assembly. Indeed, DNA has been exploited as a building block for the assembly of nanostructures and active devices: successes include DNA computation,Adleman9 motors,Bath2005 ; Bath2009 hierarchical self-assembly of tilesWinfree98 and self-assembly of strands into large structures such as DNA origamis.Rothemund06
Many theoretical and computational approaches have been developed to study DNA. At the most fine-grained level, quantum chemistry calculations can be used to study the interactions between nucleotides.Sponer08 ; Perez04 ; Hobza99 ; Sponer06 ; Svozil10 ; Sponer04 While they provide valuable information about the ground state energies at a high level of detail, they are computationally demanding and do not allow for the study of dynamical processes involving breaking and forming of base pairs. Molecular simulation packages such as AMBERcornell95 or CHARMM,CHARMM that retain an all-atom representation of the nucleic acids but use empirical force fields to model their interactions, are extensively used for computational studies of both DNA and RNA as well as their interactions with proteins.Perez2012 Although faster than quantum chemistry methods, they still are computationally very demanding and the time scales they can currently access are of the order of the s, while many biologically and technologically relevant processes happen at the ms timescale or longer. At the moment, simulations of rare events such as the breaking of base pairs remain at the limit of what is possible. At the next level of complexity are coarser models of DNA Drukker2001 ; Sales-Pardo2005 ; Kenward2009 ; Ouldridge2009 ; Knotts2007 ; Sambriski2009 ; Linak11 ; Araque11 ; Florescu2011 ; Morriss-Andrews2010 ; Savin2011 ; Dans2010 ; Savelyev2009 ; Becker2007 ; Lankasbook that integrate out several degrees of freedom, such as replacing a group of atoms by a single site with effective interactions. While these models cannot describe the system at the same level of detail as atomistic simulations, they allow one to study much larger systems and address rare events. Finally, continuous models of DNA Dauxois1993 ; Nisoli11 ; monasson99 completely neglect the detailed chemical structure but allow for analytical treatment in the thermodynamic limit, and have been used to study macroscopic properties such as melting temperatures or properties of DNA under stress.Nisoli11 ; monasson99
DNA nanotechnology exploits processes that include strand diffusion and breaking and forming of base pairs. Computational methods describing such systems must be efficient enough to access the time scales at which these processes happen. Moreover, the coarse-grained model must be properly designed to capture the structural, thermodynamical and mechanical properties of DNA in both the single- and double-stranded forms. Such a coarse-graining approach was recently used to develop the nucleotide-level model of Ouldridge et al., Ouldridge_tweezers_2010 ; Ouldridge2011 ; Ouldridge_thesis that was subsequently successfully applied to the study of DNA nanotweezers, Ouldridge_tweezers_2010 kissing hairpins,Romano12a DNA walkers,Ouldridge_thesis the nematic transition of dense solutions of short duplexes,CDMnematicDNA and the formation of DNA cruciforms.Matek The model was designed with an “average-base” representation that includes specificity of base-pairing but otherwise neglects the dependence of interactions on sequence. Consequently, the model is suited to study processes for which sequence heterogeneity is of secondary importance.
Nevertheless, many biological processes and technological applications of nucleic acids rely on sequence heterogeneity. It is well-known that A-T and G-C pairs have different relative binding strength,Saenger1984 with the latter being significantly stronger because of the presence of three rather than two interbase hydrogen bonds. Moreover, the stacking interactions that drive the coplanar alignment of neighboring bases are known to show significantly different behavior depending on sequence.Saenger1984 Furthermore, a strand of DNA possesses directionality, e.g. the phosphates of the backbone connect to the and carbon atoms in the sugars. Interactions within a strand are therefore distinct when the bases are permuted: for example, the interaction of neighboring AT bases depends on whether the A is in the direction with respect to the T or vice versa. Besides thermodynamic properties, it has been observed that mechanical and structural properties such as flexibility, helical twist and even helix type are also influenced by the sequence.Calladine1997 ; Olson98 ; Geggier10 ; Basham95
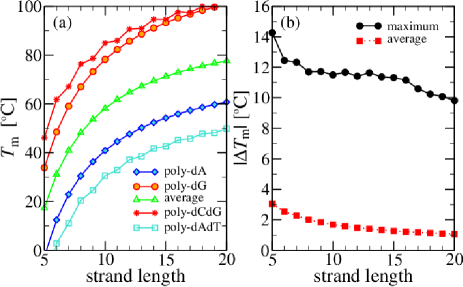
To highlight the effects of sequence on the thermodynamics of DNA, we point out that the melting temperature of two oligomers with the same length but different sequences can vary by more than , as shown in Fig. 1(a) where we compare the melting temperatures of poly(dA), poly(dG), poly(dCdG) and poly(dAdT)111We use poly-dC,dA,dT,and dG notation for DNA sequences with repeated nucleotide content to distinguish them from RNA sequences, which are referred to with rC, rA, rU and rG sequences of various lengths at an equal strand concentration of . These melting temperature differences are only marginally diminished with increasing length and are exploited in vivo, where, for example, it has been observed that initiation sites of transcription are often composed of a higher than average number of A-T pairs.cell
Note that beside the number of A-T and G-C base pairs the actual order of nucleotides in the sequence is also important: two sequences of the same length and the same number of A-T and G-C base pairs can still have melting temperatures that differ by more than , as shown in Fig. 1(b).
Given these large variations, it is important to have a model that captures at least the thermodynamic effects of sequence. We note that some of the other coarse-grained models of DNA that have been developed do include sequence effects in various level of detail, including sequence dependent base-pairing interactionsSambriski2009 and also sequence-dependent stackingAraque11 and cross-stacking interactions.Linak11 An extension Ortiz11 of the model in Ref. Sambriski2009, also has base pair deformability parametrized to the values determined by analysis of DNA-protein crystal complexes.Olson98 In contrast to these models, the model presented in Refs. Ouldridge_tweezers_2010, , Ouldridge2011, and Ouldridge_thesis, was specifically developed for applications in DNA nanotechnology and was primarily designed to represent the single- to double-stranded transition in a sufficiently physical manner. The aim of this work is to introduce a parametrization of this model that captures the sequence-dependence of DNA thermodynamics and use it to study sequence effects on simple test systems.
We first present the original coarse-grained DNA model of Ouldridge et al. Ouldridge_tweezers_2010 ; Ouldridge2011 ; Ouldridge_thesis and then describe the fitting procedure we developed for the sequence-dependent interactions. We test the parametrization on melting of duplexes and hairpins, the latter being a case to which the model was not fitted. We then explore the flexibility of the model by studying: (a) the heterogeneous stacking transition of single strands, (b) the tendency of a duplex to fray at its melting point, (c) the effect of stacking strength in the loop on the melting temperature of hairpins, (d) the force-extension properties of single strands and (e) the structure of a kissing-loop complex.
II Average base coarse-grained DNA model
The coarse-grained DNA model, on which this work is based, is described in detail in Refs. Ouldridge2011, and Ouldridge_thesis, . It represents DNA as a string of nucleotides, where each nucleotide (sugar, phosphate and base group) is a rigid body with interaction sites for backbone, stacking and hydrogen-bonding interactions. The potential energy of the system is
| (1) | |||||
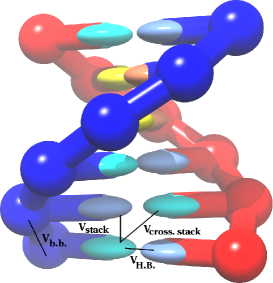
where the first sum is taken over all nucleotides that are nearest neighbors on the same strand and the second sum comprises all remaining pairs. The interactions between nucleotides are schematically shown in the Fig. 2, and the explicit forms can be found in Refs. Ouldridge2011, and Ouldridge_thesis, . The hydrogen bonding (), cross stacking (), coaxial stacking () and stacking interactions () explicitly depend on the relative orientations of the nucleotides as well as on the distance between interaction sites. The backbone potential is an isotropic spring that imposes a finite maximum distance between neighbors, mimicking the covalent bonds along the strand. The coaxial stacking term, not shown in the Fig. 2, is designed to capture stacking interactions between non-neighboring bases, usually on different strands. All interaction sites also have isotropic excluded volume interactions or .
The coarse-grained DNA model of Refs. Ouldridge2011, and Ouldridge_thesis, was derived in a “top-down” fashion, i.e. by choosing a physically motivated functional form, and then focusing on correctly reproducing the free energy differences between different states of the system, as opposed to a “bottom-up” approach that starts from a more detailed representation of DNA and typically focuses on accurate representation of local structural details. The interactions were originally fitted to reproduce melting temperatures of ‘average’ oligonucleotides, obtained by averaging over the parameters of SantaLucia’s model.SantaLucia1998 In addition, the model is fitted to reproduce the structural and mechanical properties of double- and single-stranded DNA such as the persistence length and the twist-modulus. The model allows for base pairing only between Watson-Crick complementary bases, but otherwise does not distinguish between bases in terms of interaction strengths.
The model was fitted to reproduce DNA behavior at a salt concentration (M) where the electrostatic properties are strongly screened, and it may be reasonable to incorporate them into a short-ranged excluded volume. Such high salt concentrations are typically used in DNA nanotechnology applications, hence motivating this approach. It should be noted that the model neglects several features of the DNA structure and interactions due to the high level of coarse-graining. Specifically, the double helix in the model is symmetrical rather than the grooves between the backbone sites along the helix having different sizes, and all four nucleotides have the same structure.
The main purpose of this paper is to go beyond the average sequence parametrization by introducing sequence-dependent interaction strengths into the model.
III Parametrization of sequence-dependent interactions
We choose to perform a thermodynamic parametrization of the sequence-dependent interactions, aiming to reproduce melting temperatures of short DNA duplexes. We seek the parameters that best reproduce the melting temperatures as predicted by SantaLucia’s model,SantaLucia1998 which we treat as an accurate fit to experimental data on the melting of duplexes of different length and sequence. We restrict sequence dependence to the strength of the base pairing and stacking interaction terms, keeping all other parameters fixed to the values of the original fit.
III.1 SantaLucia’s nearest-neighbor model
In an important series of papers, SantaLuciaSantaLucia1998 ; SantaLucia2004 summarized the results of multiple melting temperatures of DNA oligomers, and also presented a nearest-neighbor model that reproduces the results of melting experiments (hereafter referred to as the SL model). This popular model is the basis of a number of widely used oligomer secondary structure and melting temperature prediction tools.nupack ; ZukerMarkham08 ; Markham2005 ; Novere01 The model assumes that DNA can exist in two states, either single-stranded or in duplex form, and gives a standard free-energy change of formation of the duplex with respect to the single strands as a function of temperature. The expected yields of duplexes can then be calculated as a function of temperature through the relation:
| (2) |
where and are molar concentrations of single strands, is the molar concentration of the duplex and is the molar gas constant. This result assumes the system is dilute enough to behave ideally apart from associations, a condition fulfilled in the vast majority of experiments.
The SL model assumes that is a sum of contributions, one for each base-pair step formed in a duplex with respect to the single-stranded state, along with corrections for end effects. A base-pair step consists of four bases; for example, the base-pair step GT/AC stands for a section of duplex that has GT bases on one strand and AC on the complementary strand. The SL model has unique base-pair nucleotide steps: AA/TT, AT/AT, TA/TA, GC/GC, CG/CG, GG/CC, GA/TC, AG/CT, TG/CA, GT/AC, where pairs are given in - order along the strands.
The contribution to of each term is divided into a temperature-independent enthalpy and entropy, so that the overall form of is given by
| (3) |
with and being the (temperature-independent) sum of the individual contributions to the enthalpy and entropy respectively. The SL model is a two-state model, in that it considers two regions of state space (the duplex and single-stranded states) and assumes that there is a constant enthalpy and entropy difference between the two. In other words, it neglects the variation in enthalpy within the bound and unbound sub-ensembles.
The melting temperature for a given sequence is defined in the SL model as the temperature at which half of the strands in the system are in the duplex state and the other half are in the denatured state. Using this definition, the SL model has an average absolute deviation of when compared to known experimental melting temperatures of duplexes with lengths between and base pairs.SantaLucia2004 We fit to the as predicted by the SL model, rather than having to re-analyse the original experimental data. This choice allows us to fit to a large ensemble of different sequences whose melting temperatures we estimate using the SL model.
We emphasize that, in contrast to the SL model, our model itself does not exhibit ideal two-state behavior. Although we observe a large difference in the typical energies of single-stranded and duplex states, allowing us to clearly differentiate the two, we also observe significant variation within these sub-ensembles. Both single-stranded and duplex states have multiple microscopic degrees of freedom, which respond differently to changes in temperature. For instance, we observe fraying of duplexes (Sec. V.2) and that the single strands undergo a stacking transition (Sec. V.1). The net effect is that the and of transitions that would be inferred from our model are not temperature independent, unlike in the SL model.
We note that other models for the prediction of DNA melting temperatures exist, such as the recently developed nearest-neighbor model of Ref. Ritort10, , which uses the mechanical unzipping of DNA hairpins to infer the individual base pair step free energies. Our parametrization procedure only requires estimates of the melting temperature for a large set of DNA sequences and could be also used to fit our model to the melting temperature predictions of Ref. Ritort10, .
III.2 Fitting of the parameters
Our model was originally parametrized to reproduce the melting temperatures of average sequences as predicted by the SL model. Since the SL model is constructed on the level of base-pair steps, it cannot be used to differentiate between intrastrand interactions within a step: for example, AA and TT or AG and CT. We therefore set the stacking interaction strengths of bases that belong to the same base-pair step to be equal in our parametrization procedure.
To parametrize our coarse-grained DNA model’s potential (Eq. 1), we scale the and interaction terms by the factors and respectively, i.e.
| (4) | |||||
| (5) |
where and are constants for a given nucleotide pair . There are therefore parameters (as shown in Table 1) and two parameters and to fit. Making the cross-stacking interaction sequence-dependent would also influence melting temperatures, but as we will discuss later, sequence-dependent stacking and base-pairing interactions provide enough parameters to obtain results in almost complete agreement with the predictions given by the SL model. To fit the 12 coefficients and , we used a set of oligonucleotides of lengths 6, 8, 10, 12 and 18 for which we calculated the (salt-adjusted) melting temperatures using the SL model. The set contained 2000 randomly generated sequences for each of lengths , , , and all sequences of length . The set was then reduced to contain only heterodimers, leaving 12 022 sequences in total. We chose to remove homodimers (self-complementary sequences) for convenience, because the inference of the bulk melting temperatures from simulations of the formation of a single duplex is different from that for heterodimers, as discussed in Ref. Ouldridge_bulk_2010, .
We select the parameter set that minimizes the function:
| (6) |
where is the melting temperature of the oligonucleotide in the set as predicted by the SL model and is the melting temperature predicted by our model with sequence-dependent base pairing and stacking potentials and . To accurately fit and , we hence need estimates of the melting temperatures of many different sequences for many different values of the interaction parameters.
If one simulates a system consisting of two complementary strands in the simulation box at exactly the melting temperature then the ratio of observed duplex states to single-stranded states
| (7) |
should be equal to for heterodimers and for homodimers. The value of for heterodimers is a correction for finite size effects that arise when one simulates only two strands instead of a bulk ensemble at the same average concentration. Ouldridge_bulk_2010 The correction assumes that the density of strands is low enough that they behave ideally apart from association.
To calculate melting temperatures for the large set of sequences we employed a histogram reweighting method. Ferrenberg88 ; LandauBinderBook We generated once, for each duplex length considered, a set of single-stranded and 10 000 duplex configurations and . The configurations in and were sampled from the Boltzmann distribution of strands of sequence at the melting temperature using the average parametrization (i.e., and ). Simulations were performed in a cell that gave a concentration of M for each strand. Twice as many duplex as single-stranded states were sampled because they appear in exactly this ratio in a simulation of two strands at the melting temperature of a given sequence in the average model (). Sampling was done at sufficiently large intervals that the configurations in and were uncorrelated.
In order to find the ratio for a sequence at temperature with a parameter set and that corresponds to a potential , states in and were reweighted by the factor
| (8) |
where is the energy of the -th state generated at temperature using the sequence in the average model, and is the sequence-dependent potential evaluated on the same -th state for the sequence . Note that both interaction potentials are a function of temperature because the stacking interaction term in the model is temperature dependent. Ouldridge2011 ; Ouldridge_thesis The configurations used in Eq. 8 are generated at with and , but each is counted with a weight that corresponds to the desired set of new parameters.
The ratio of the duplex to single-stranded states for a given temperature and parameters becomes
| (9) |
where the index runs through all generated duplex states while runs through all generated single stranded states. Using this method, can be generated for a set of temperatures and interpolated in order to find such that , which is by definition the melting temperature of a given duplex.
The histogram reweighting method assumes that the ensemble of configurations generated at temperature with potential for sequence is also representative of the state space of the system at temperature and potential for sequence . To check whether we included enough states, we compared the estimation of the melting temperature by histogram reweighting of 15 000 states to an estimation which only used different states. For a test case of 71 000 sequences of oligonucleotide lengths , and , the mean absolute deviation of the difference between the predicted was smaller than , suggesting that the choice of 15 000 states provides a large enough ensemble for estimating the melting temperatures, at least on average.
To find a set of parameters that minimizes the function in Eq. 6, we ran a simulated annealing algorithm.LandauBinderBook We first fitted the base-pairing strengths and while holding the stacking parameters constant. Then we fitted the 10 stacking parameters in a second step. The separate fitting of the two sets of parameters simplifies the fitting procedure, as the converged values for provide an initial point for the stacking parameters fitting. It also allows us to compare the performance of a model where only the base-pair interaction strengths are sequence-dependent to the one where both base-pairing and stacking interactions are sequence-dependent.
We note that our fitting procedure requires the ability to efficiently estimate melting temperatures. The histogram reweighting method, using the generated states, takes only about 1s to calculate the melting temperature of a given sequence. This is a huge reduction in computer time as compared to umbrella sampling simulations,Torrie1977 which were used in the parametrization of the original average sequence model.Ouldridge2011 The umbrella sampling simulation samples multiple single- to double-stranded transitions for a given oligomer and requires around two weeks of CPU time to calculate the melting temperature to within accuracy for the sequence lengths that we considered for our parametrization. Thus our histogram re-weighting methodology provides the crucial speed-up that made the parametrization possible.
III.3 Parametrization results
While the parameters and were fairly robust to details of the optimization procedure, the parameters were more sensitive. In order to uniquely determine these parameters we selected the set with the smallest average error on an additional test set of sequences that included all sequences of lengths , , and for which the SL model predicts a greater than for the concentration , plus a set of randomly generated sequences of lengths , and . The final set of parameters and , as introduced in Equations (4) and (5), is shown in Table 1.
| Base pairing | |
|---|---|
| AT | 0.8292 |
| GC | 1.1541 |
| Stacking | |
| GC | 1.027 |
| CG | 1.059 |
| AT | 0.947 |
| TA | 0.996 |
| GG, CC | 0.978 |
| GA, TC | 0.970 |
| AG, CT | 0.982 |
| TG, CA | 1.009 |
| GT, AC | 1.019 |
| AA, TT | 1.042 |
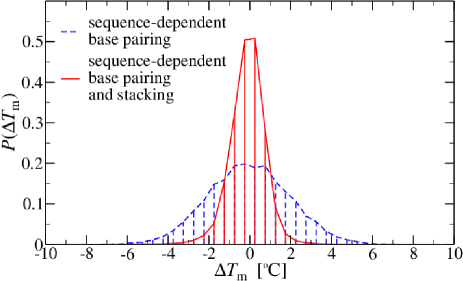
Figure 3 compares a histogram of the difference
| (10) |
between the melting temperatures , calculated by our coarse-grained model (using histogram reweighting) and the of the SL model, determined for each of the sequences in our test set. The dashed curve shows our model’s performance when only the base pairing interactions are sequence-dependent (parameters and from Table 1) and the stacking parameters are all set to unity. The solid curve shows the histogram when the melting temperatures are calculated by our model with both hydrogen bonding and stacking sequence-dependent parameters. The standard deviation of the distribution of with sequence-dependent base-pairing and average stacking is , while the standard deviation for the case where stacking is also sequence-dependent is . This compares to a standard deviation of 8.6 for the original average-base model. We note that although the average deviation is very small, there are a number of melting temperatures in our set that differ significantly more than one would expect from a Gaussian distribution with this standard deviation. These outliers are typically highly repetitive sequences.
Since the SL model has an average absolute deviation of when compared to experimental melting temperatures of duplexes of lengths between and , there is little point in trying to further improve our predictions with respect to it. That it is possible to reproduce the predictions of the SL model with our set of parameters also implies that it would not be appropriate to introduce sequence dependence for other terms in the interaction potential by fitting only to . Instead, other physical input would be needed.
It is also important to point out that, as discussed previously, by fitting to a model which considers only base pair steps it is not possible to distinguish between, for example, AA or TT stacking strengths, which are known to be different.Chenw2010 Even though we treat stacking within base pair steps equally, our method in principle allows the stacking interaction for each individual stacked pair to be parametrized differently. But in order to do this fitting, new experimental data is needed. We further discuss the parametrization of stacking interactions in section V.3.
IV Tests of the parametrization
In this Section, we test the performance of our sequence-dependent parametrization by comparing the melting temperatures of selected duplexes, as well as for hairpins, to which the model was not directly fitted.
We have also tested the structural and mechanical properties of double-stranded DNA (away from thermodynamic transitions) on a randomly generated sequence with around 50% GC-content and confirmed that they are not changed with respect to those of the original average-base parametrization. So our double-stranded persistence length remains approximately 125 base pairs, and the B-DNA structure produced by the model is the same as in Refs. Ouldridge2011, and Ouldridge_thesis, . On the other hand, the structural and mechanical properties of single-stranded DNA properties do differ from those of the average model, and are studied in Sec. V.1 and V.4.
IV.1 Duplex melting
To further test our histogram reweighting method, we calculated several oligomer melting temperatures using umbrella sampling Monte Carlo simulations.Torrie1977 While histogram reweighting method estimates the melting temperature using the same 15 000 generated states for each duplex length considered and extrapolates from the average-base to the sequence-dependent potential, umbrella sampling simulations are run separately for each sequence considered. The umbrella sampling uses the sequence-dependent potential and is done close (within ) to the melting temperature of given sequence, hence providing a more accurate estimation of the melting temperatures in our model.
The comparison between the different methods are shown in Table 2 for a series of sequences. On average the histogram reweighting and the umbrella sampling agree to within , which is very satisfactory. However, there is one significant outlier, ATATAGCTATAT, for which a difference of was obtained. One reason for the difference may be that the melting temperature is about lower than the melting temperature of an average strand of the same length from which the configurations were taken for the histogram reweighting. This difference is larger than the typical width of the melting transition (around for sequences of length 12). Moreover, the sequence has a relatively high A-T content and may adopt structures with significant fraying at the ends that contribute to the ensemble of configurations for the actual strand. However, such frayed states might have been poorly sampled when the ensemble was generated using the average base model. For these reasons, the sampled configurations may not provide a good representation of the true state-space of the system. Nevertheless, a number of other sequences tested here also have melting temperatures that differ significantly from the average sequence, without exhibiting such a large difference in the predicted melting temperatures between the two methods. Although it may be true that including a significantly larger set of states in the histogram reweighting method could reduce the errors in these outliers, we decided not to pursue this route further, given that the accuracy of the underlying SL model is not much different than our parametrization errors. Should a significantly more accurate model of the experimental data become available, however, then it may be that this point needs to be revisited.
| Sequence | ||||
|---|---|---|---|---|
| AAGCGT | 38.0 | 38.2 | 39.6 | 31.2 |
| GAGATC | 24.4 | 24.0 | 22.0 | 31.2 |
| TCTCCATG | 44.7 | 44.6 | 44.6 | 48.2 |
| CCCGCCGC | 71.1 | 70.6 | 71.1 | 48.2 |
| ATTTATTA | 21.2 | 21.3 | 23.9 | 48.2 |
| ATATAGCTATAT | 47.0 | 49.3 | 48.1 | 64.7 |
| ATGCAGCTGCCG | 74.0 | 74.3 | 72.6 | 64.7 |
| GCGCAGCTGCCG | 79.8 | 79.6 | 79.0 | 64.7 |
IV.2 Hairpin melting temperatures
We also tested our model’s predictions for hairpin melting temperatures. This provides a distinct test of the parametrized model, since the sequence-dependent parameters were fitted to duplex melting temperatures only. Importantly, this test also probes the quality of the model’s description of the single-stranded state, a feature often neglected in DNA models. We test melting temperatures of 4 different hairpin-forming sequences with different stem and loop lengths. We used strong and weak stem sequences to highlight sequence effects.
The simulations were performed with umbrella sampling using the number of correct base pairs in the stems as a reaction coordinate. The melting temperature is defined as the temperature at which the system spends half of the time in the hairpin state, which is in turn defined as the ensemble of configurations with one or more correct base pairs. In Table 3, we compare our predictions for with those obtained from the SL model. The average-base parametrization was previously found to consistently underestimate for hairpins by approximately , but to show the correct variation with loop and stem length.Ouldridge2011 The sequence-dependent parametrization presented here also tends to underestimate by roughly the same amount, but the sequence effects are well captured.
We further examine the effect of stacking on the melting temperature of hairpins with longer loops in section V.3, where we compare our model with the experimentally measured influence of sequence content of the loop on the hairpin melting temperature, an observation which is beyond the SL model.
| Sequence | ||
|---|---|---|
| AGCGTCACGC--GCGTGACGCT | 86.5 | 86.7 |
| AGTATCAATC--GATTGATACT | 62.2 | 64.4 |
| AGCGTC--GACGCT | 64.5 | 67.0 |
| AGTATC--GATACT | 44.0 | 47.3 |
V Sequence-dependent phenomena
To demonstrate some of the strengths and weaknesses of our new model, we present, in this section, a series of studies of DNA systems for which sequence plays a non-trivial role. The results were obtained from either Monte Carlo or dynamical simulations of the model. The Monte Carlo algorithm used is a Virtual Move Monte Carlo algorithm Whitelam2009 and the molecular dynamics simulations were performed using a Brownian dynamics algorithmFrenkelbook with the thermostat as described in Ref. Russo09, .
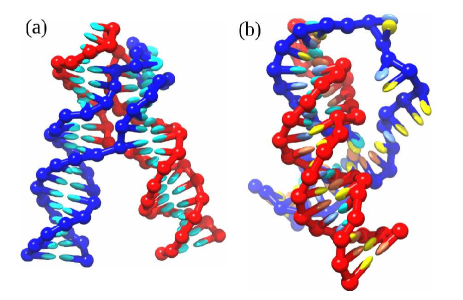
V.1 Heterogeneous stacking transition of single strands
Our model strands undergo a broad stacking transition, i.e., a transition from a state with all or the majority of neighboring bases coplanarly aligned to a state with disrupted alignment, as a function of temperature.Ouldridge2011 ; Ouldridge_thesis Such a transition is also generally accepted to occur for DNA, although there is not a clear consensus in the literature about many aspects of this transition.Saenger1984
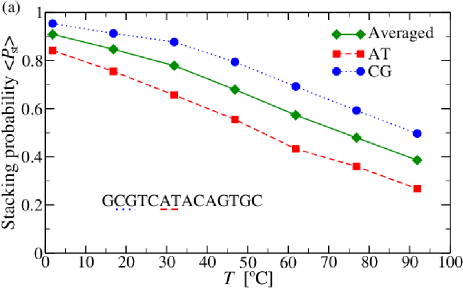
To investigate the sequence dependence of stacking in our model, we ran Brownian dynamics simulations for a 14-base single strand with sequence GCGTCATACAGTGC (the same sequence as studied in Ref. Holbrook1999, ) at a range of temperatures. We measured the probability that a neighbor pair stacks. Two bases are considered to be stacked if the magnitude of their stacking interaction energy is at least 6% of its maximal value. The choice of a cutoff is one of convenience; we have checked that doubling it does not measurably change the results. Even though the different stacking strengths do not vary from the average by more than , the effects on the stacking probabilities are still quite significant. For example, as shown in Fig. 4(a), the difference between the strongest (GC) and the weakest (AT) stacking pairs is large enough that the midpoints of the transitions are separated by about .
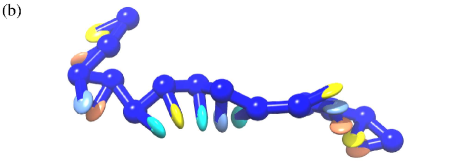
The structure of the single strands is also heterogeneous, consisting of unstacked and stacked regions of various lengths, as illustrated in Fig. 4(b). The stacked regions adopt a helical geometry, whereas the unstacked regions are more disordered.
The strands are also dynamically heterogeneous: over time the stacked and unstacked regions grow and shrink, while the average probability that a given neighboring pair of bases stack varies with temperature and position is measured in Figure 4(a). Mechanical and structural properties of the single strands are therefore heterogeneous both in space and in time.
While we are confident that the existence of significant temporal and spatial heterogeneity in single strands is a robust qualitative prediction of our model, given the paucity of experimental and theoretical data on the detailed stacking interactions between individual bases, many questions about the nature and time scales of these heterogeneities remain open.
V.2 Hybridization free energy profiles of duplexes
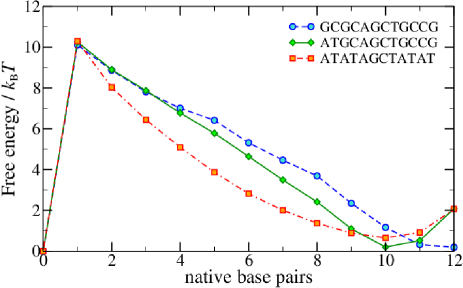
For our average-base parametrization, we have previously seen that duplexes at their melting point typically have a terminal pair of bases that are unbound. This behavior is called fraying, and it is generally thought that the ease of fraying is sequence-dependent with A-T ends fraying more readily.Nonin1995 To explore the fraying behavior in our model, we study the free-energy profiles of the sequences ATATAGCTATAT, ATGCAGCTGCCG and GCGCAGCTGCCG. Note that all three sequences have the same four central bases but different ends.
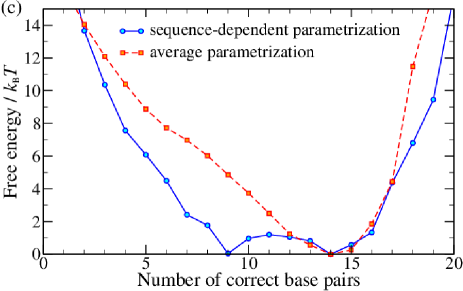
In Fig. 5 the free energies profiles are shown as a function of the number of the native base pairs formed between the complementary strands. The free energies were set to be equal to 0 in the state with 0 native base pairs, i.e. when the duplex is melted.
Of most interest is how the most stable duplex state depends on sequence. For the strand with two G-C ends, the free-energy minimum is a state with all 12 bonds formed, although the free-energy cost of opening up 1 base-pair is minimal. By contrast, for the case of either one or two A-T ends, the duplex has the lowest free energy in a state with 10 bonds formed. Although the system pays an energetic cost for having 2 bonds unformed, it gains entropy from this opening up of the end base pairs. Thus, our model strands exhibit fraying, with the expected stronger tendency to fray for duplexes with weaker A-T ends. Note that the sequence with two A-T ends frays despite being at a significantly lower temperature than the G-C rich sequence. Fraying has many consequences for DNA behavior. For instance, it exposes the end bases, allowing them to take part in reactions with other strands, which is important, for example, in a toehold-free displacement process.Zhang2009
Other features of note that are apparent from the free energy profiles in Fig. 5 are the nature of the first free energy jump and the shape of the minimum corresponding to the bound state. The fact that the first jump is almost the same for all three sequences reflects that it is dominated by the loss of center of mass entropy on association, which is the same (in units of ) for the three systems. The shape of the free energy minimum corresponding to the duplex highlights differences in the ensemble of duplex states for different sequences. For the weakest sequence, at the melting point, the duplex can have as little as 7 base pairs for a significant fraction of the time, and roughly with the same probability as for it being fully closed. The most G-C rich sequence, on the other hand, shows little tendency to fray even at its melting point and it rarely breaks more than 3 base pairs.
V.3 Loop sequence effect on hairpin melting temperatures
In Section IV.2, we tested our model on melting temperatures of hairpins with short loops of lengths 6 and 10. In the SL model, the loop contribution to the free energy difference for closing a hairpin is considered to be of purely entropic origin and sequence independent. However, it was observed experimentallyGoddard00 that hairpins with the same loop lengths but different sequences have different melting temperatures. In particular, the experiment in Ref. Goddard00, considers sequences with the same stem sequence and loops consisting of either poly(dA) or poly(dT). The observed difference in melting temperature of the two different loop sequences was 4 for loop length 12 and increased to 12 for loop length 30, with the poly(dA) loop always having lower melting temperature. It was proposed that the strand with a poly(dA) loop region has a higher rigidity in the single-stranded case due to the base stacking and thus pays a larger penalty for closing.
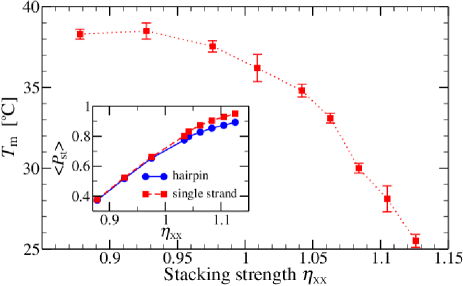
Although the experiments in Ref. Goddard00, were done at a salt concentration of M, lower than the M to which our model was fitted, it is instructive to see in general how stacking in the loop influences the stability of hairpins. We calculated the melting temperature for the sequences with the same stem sequence as in the experiment and a range of stacking strengths in the loop. Since our model does not distinguish between AA and TT stacking, we use an artificial base type X that is taken to stack as A with other bases and distinctly (with stacking strength ) with other bases of the same type X.
The results, summarized in Fig. 6, show that for , the melting temperatures are fairly insensitive to stacking strength whereas for , the melting temperature starts to drop significantly with increasing stacking strength. In the inset of Fig. 6 we show the average stacking probability in the loop, compared to that of the competing single-stranded state at the same temperature. In general, as the stacking strength increases, the probability that a piece of single-stranded DNA has long stacked regions also increases. The geometric constraints of the loop on stacking therefore become more pronounced with increasing strength, destabilizing the hairpin and leading to a drop in the melting temperature. On the other hand, for , the stacked regions have an average length , which is short enough that the hairpin geometry does not significantly affect the stacking.
If the data of Ref. Goddard00, are to be interpreted using a model of stacking such as ours, we would infer that poly(dA) has a very high stacking probability at these temperatures, while poly(dT) has a significantly lower one. But, as the inset of Fig. 6 shows, we would not conclude that poly(dT) is necessarily largely unstacked.
It is interesting to note that the stacking strength where destabilization becomes noticeable coincides with the top end of our fitted strengths, and that if we were to separate poly(dT) and poly(dA) stacking strengths, it would not require an unreasonable change to give a signal of comparable size to that reported in Ref. Goddard00, . In particular, if one sets to and accordingly adjusts to in order to keep the average of the two coefficients the same as for our base-pair step parametrization, the obtained difference in melting temperature of the hairpins with poly(dA) and poly(dT) loop is about . For these values of and the standard deviation of melting predictions for the set of duplexes used in testing our parametrization increases by only . Thus, if one wants to investigate a system where the difference in AA and TT stacking strengths plays an important role, these coefficients can be used. However, in the absence of a systematic study of the effects of loop sequence on hairpin melting temperature at high salt, we do not include differences between pairs that cannot be distinguished by the SL model in our parametrization in Table 1.
V.4 Force-extension curves of single strands
The mechanical properties of single strands have been experimentally measured for both DNA and RNASmith1996 ; Mishra09 ; Seol2007 ; Seol2004 ; Dessinges2002 ; Chenw2010 ; Ritort10 to characterize their average as well as base-specific properties. In particular, qualitatively different behavior has been observed for single-stranded poly(dT) (poly(rU) in the case of RNA) compared to poly(dA) (poly(rC) or poly(rG) in the case of RNA); the latter exhibit significant deviations from standard polymer models such as freely-jointed and wormlike chains, whereas the former do not. These deviations — concave regions with negative curvature in the force-extension curves — are described as “plateaus”.Mishra09 ; Seol2007 ; Chenw2010
To investigate the effects of sequence on the mechanical properties of single strands in our model, we simulate mechanical pulling and obtain force-extension curves for 50-base strands at room temperature (25). We consider polymers corresponding to our weakest and strongest stacking sequences, poly(dGdA) and poly(dA), which differ in by about 7%. We note that in Sec. V.3, we used hairpin melting to distinguish AA and TT stacking strength, but the obtained values are open to enough uncertainty that in this section we return to our original parametrization. Our focus here is on the qualitative effect of stacking differences, rather than their quantitative values.
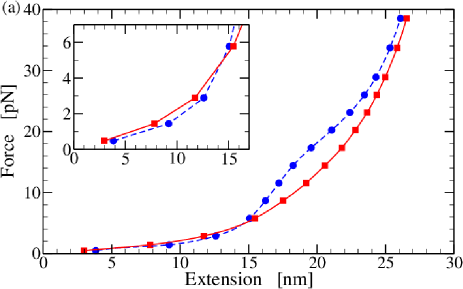
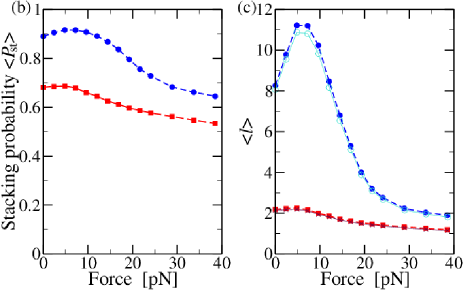
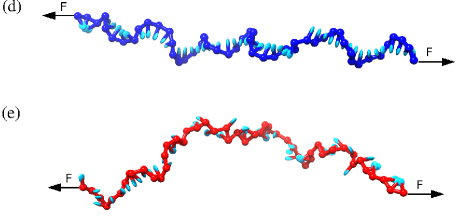
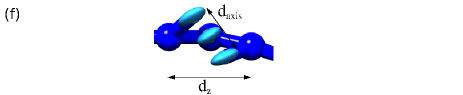
Fig. 7(a) shows force-extension curves for our strongest and weakest stacking sequences. The concave section for strongly-stacked poly(dA) between and pN is qualitatively similar to the plateau-like features observed in experiment.Seol2007 ; Mishra09 ; Chenw2010 The relatively weakly-stacked strand, poly(dAdG), follows a convex force-extension curve which is fairly typical of a classical homo-polymer model.
The poly(dAdG) curve is similar to the one found for the average base model, which in turn is in reasonable quantitative agreement with experimental results for typical sequences. Although quantitative comparison with experimental data for non-homopolymeric sequences, such as -phage ssDNA,Smith1996 is hampered by the presence of metastable secondary structure,Dessinges2002 ; Zhang2001 ; Montanari2000 at tensions above about 15 pN, where hairpins are disrupted, the extension per base at given force in the average model is within 10% agreement with Ref. Smith1996, . A detailed discussion of the agreement between the average model and experiment is given in Ref. Ouldridge_thesis, .
To understand the difference between the two single strands in our simulations, it is instructive to first recall that the strands consist of dynamically changing stacked and unstacked regions, as discussed in section V.1. When no force is applied, an unstacked region typically has a shorter end-to-end distance than a stacked region because it is more flexible and hence behaves more like a random coil. On the other hand, unstacked regions also have a greater maximum extension because the backbone is not restricted to a helical geometry as in the case of stacked regions.
To explore the effect of pulling the structure of the single strands, we measured the stacking probability and the average length of contiguously stacked sections for both strands, where a section of length consists of bases. The results, as a function of applied force, are plotted in Figs. 7(b) and (c). When no force is applied, the stonger-stacking strand poly(dA) has while the weaker-stacking strand poly(dAdG) consists mostly of short stacked regions with average length .
As shown in the inset of Fig. 7(a), at low forces the stronger-stacking poly(dA) strand is more extensible than the weaker stacking one, by as much as 20% at pN force. The reason for this difference is that long stacked sections have a smaller entropic cost for aligning with the applied force than unstacked regions do. However, as the force increases further and the strands align more with the force, the curves cross (at pN), and poly(dA) becomes less extensible because of its shorter effective contour length.
Increasing the force also leads to significant changes in the average length of stacked regions in poly(dA). Interestingly, at low force, the lower entropic cost for aligning of longer stacked strands leads to an initial increase in and with force (up to around pN). However, as the force increases further, both and start to decrease because it becomes favorable for the strand to disrupt stacking to allow for greater extension. The reduction in stacking is particularly significant for the poly(dA) strand over the range to pN, the location of the concave region in the force-extension curve. The long stacked regions are broken down into shorter ones which facilitates an increase in the overall length of the polymer. However, a short region of 3 bases can still align its backbone with the force while remaining stacked, as illustrated in Fig. 7(f). Therefore, even though it is progressively reduced with force for both poly(dA) and poly(dGdA), a significant degree of stacking is preserved even at high forces.
The changes in stacking hence explain the physical cause of the concave “plateau” region in the force-extension curve for the stronger-stacking strand, poly(dA). It corresponds to the structural transition as the increasing force disrupts the long stacked regions and decreases. The concave segment of the force-extension curve is not present for poly(dGdA) because the latter already consists of mostly short stacked regions at zero force.
The differences in the structure of the poly(dA) and poly(dGdA) strands described above are further illustrated in Figs. 7(d) and (e), where snapshots of the sequences are shown for a force of pN. The poly(dA) strands are clearly much more stacked than the poly(dGdA) strands are, and also more strongly aligned with the force. From this picture one can also see why the derivative of the force-extension curve begins to rise steeply for the poly(dA) curve around pN: The highly stacked strand is nearing its maximum extension, whereas the unstacked strand is not.
It is interesting to note that a mere 20% difference in stacking probability between poly(dA) and poly(dGdA) at zero force causes a significant difference in the average length of stacked regions: versus . This effect can be understood by considering a simple, uncooperative model for stacking along the strand. Let be the probability that two neighbors are stacked and the probability that a stacked cluster has length . Assuming an infinitely long polymer chain, the probability of having a continuously stacked region of length is , which is the probability of having subsequent base pairs stacked (each with probability ) and the -th base not stacked with the next base along the chain (which is with probability ). The average length of a stacked region in this uncooperative model can thus be obtained by summing over :
| (11) |
Since our model has low stacking cooperativity,Ouldridge2011 we can make the approximation . Fig. 7(c) shows that this simple model compares remarkably well with the measured values of . The fact that diverges as approaches 1 explains the sensitivity of the model strands to relatively small changes in stacking propensity at large and also explains the large differences in observed at zero force.
It is illuminating to compare our results to the theoretical model used by Seol et al. in Ref. Seol2007, to explain the observed force-extension curves of RNA. Their model makes similar physical assumptions to the behavior of our coarse-grained model: the single strand is split into rigid helical regions and flexible random coil regions. Thus the basic explanation for the plateau region is the same as in our model. However, there are also some differences. For example, our model suggests that absence of a plateau in the force extension curve does not necessarily mean the absence of stacking. In fact, we have observed that short stacked regions persist even while pulling the strand at a high force, because our model allows for three bases to remain stacked while aligning the backbone with the applied force, a feature that is not present in the model used in Ref. Seol2007, . Moreover, the concave region in the force-extension curve interpreted with our model would indicate the presence of a much stronger stacking propensity than the one derived in Ref. Seol2007, . Although our description of single strands is fairly simple, it incorporates the underlying physics of the model of Ref. Seol2007, and in addition provides an explicit 3-dimensional representation of single-stranded nucleic acids. In summary, We believe that the presence of concave region in the force extension curve suggests that long stacked regions are present in the relaxed strand. This would either indicate strong uncooperative stacking, as in our model, or large cooperativity in stacking.
V.5 The structure of a kissing complex
In a recent publication,Romano12a we investigated DNA kissing complexes, a system where topological and geometrical frustration have important effects, and studied the ability of the original average base model to describe these systems. In this section, we show how the sequence dependence of interactions can introduce non-trivial changes to the structure of a kissing complex, with potential importance for the operation of nanotechnological systems.Bois2005 ; Dirks04 ; Venkataraman2007 ; Green2008 ; Yin2008 ; Muscat2011
A kissing complex is a system in which two hairpins have loop regions that are complementary and can thus at least partially hybridize (see Fig. 8(a)). They are a common motif in RNA and are expected to form in DNA nanotechnology systems where complementary hairpins are used as fuel for DNA nanomachines. Bois2005 ; Green06a In the experimental system realized in Ref. Bois2005, , two strands of 40 nucleotides were designed to be both complementary and also able to form a hairpin with a stem of 10 base pairs. As the remaining 20-base loops are complementary to each other, the two hairpins can form a kissing complex. The sequences are Bois2005
3’-CGCAACGACG-GCTCCCCTCTTCTCATTTTA-CGTCGTTGCG-5’
and
3’-CGCAACGACG-TAAAATGAGAAGAGGGGAGC-CGTCGTTGCG-5’
where the hyphens separate stem and loop regions. A dilute solution of such strands tends to form hairpins much more quickly than full duplexes, due to a lower kinetic barrier for the former process. The hairpins in turn form kissing complexes, an intermediate metastable state with respect to full hybridization that requires a significant amount of rearrangement to transform into the full duplex. The kinetic barrier, due to the topological frustration of the complex, is so high that full hybridization is almost impossible. However, this barrier can be reliably resolved by the introduction of a DNA catalyst strand, designed to open one of the hairpins by displacement and trigger full hybridization, thus releasing the stored free-energy. Bois2005
Following Ref. Bois2005, , we studied in Ref. Romano12a, the structure of the resulting kissing complex with the average sequence parametrization. We found that the system typically assumed a structure with two symmetric parallel helices, as shown in Fig. 8(a). However, as the loop sequences used in Ref. Bois2005, are very asymmetric in G-C content, we expect that the average parametrization should overestimate the stability of the weakly bound region and conversely underestimate that of the strongly bound, G-C-rich region.
When we repeated the structural study with the sequence-dependent potential, we obtained a qualitatively different result. Computing the binding free-energy profile of the system, using the number of native base pairs (i.e. base pairs that would be present in the final full duplex) as a reaction coordinate (Fig. 8(c)), we found a second minimum at around nine interstrand base pairs that was not observed for the average parametrization. A typical configuration associated with this minimum is shown in Fig. 8(b). It is evident that as well as being able to form the structure with two symmetric helices, the system is also able to adopt an alternative structure with a single intermolecular helix that both contains the G-C-rich section and is slightly larger than either individual helix in the two-helix form.
This competing minimum has potentially important consequences for the nanotechnological applications of kissing hairpins. In Ref. Bois2005, , a catalyst strand was introduced to the system in order to facilitate full hybridization of the complex: the strand was designed to bind to the weaker half of one of the loops, and then to open up the hairpin by displacement. The fact that a competing minimum exists in which the whole weaker half of the loop is available for binding will favor this process, as it provides a long, easily accessible toehold for displacement. Such toeholds are knownZhang2009 to accelerate displacement reactions by several orders of magnitude. Our model suggests that if the strand was instead designed to bind to the stronger half of the loop, its effectiveness would be hindered rather than helped by the presence of the alternative minimum. We would therefore expect such a catalyst to be less effective than the one used in Ref. Bois2005, .
The qualitative difference between the results of the two parametrizations in this case highlights that if one is interested in the detailed properties of a system like this one, where short binding regions with asymmetric G-C content are present, it is important to have a model with sequence-dependent binding strengths to be able to make more accurate predictions. Were the G-C pairs in the loop more evenly distributed, we would expect the results of the average parametrization free energy profile to accurately describe the kissing complex.
VI Conclusions
We have extended the nucleotide-level coarse-grained DNA model of Ouldridge et al. Ouldridge2011 (which distinguishes between A-T and C-G base-pairing but otherwise treats these interactions at the average base level) to include sequence-dependent stacking and hydrogen-bonding interactions. To derive the new parameters, we developed a histogram reweighting procedure that allowed us to fit to thousands of melting temperatures of oligomers ranging in length from 6 to 18 base pairs. Melting temperatures were extracted from SantaLucia’s nearest-neighbor modelSantaLucia1998 which we treat here as a good fit to experiment.
Sequence can have an important effect on melting temperatures. For the same length oligomer, but different sequences, melting temperatures can differ by as much as . Even for the same sequence content, but different base-pair ordering, variations in stacking energies mean that melting temperatures can vary by up to . Our new parametrization reproduces these differences and on average agrees to within a standard deviation of with the SL nearest-neighbor model. In contrast to the model’s ability to capture thermodynamic properties, our coarse-grained model does not attempt to include the effects of sequence on structural or mechanical properties of double-stranded DNA. Instead, these remain as previously reported in Ref. Ouldridge2011, , at least for sequences that are not extreme in G-C content so that sequence effects average out.
Our new thermodynamic parametrization opens up the possibility of investigating sequence-dependent DNA phenomena. Specifically, we have considered here the following five systems:
(a) Heterogeneous stacking transition in single-stranded DNA: Even though our stacking parameters do not vary by more than , they can induce significant spatial and temporal heterogeneity in the stacking of single strands. For example the difference in stacking probability between the strongest and the weakest stacking pairs in the oligomer we studied is large enough that the midpoints of the stacking transition of two separate pairs in a single strand can be separated by as much as . These results suggest that structural and mechanical properties of single-stranded DNA should be highly heterogeneous as well.
(b) The hybridization free energy profiles of duplexes: We studied three different 12mer sequences at their respective melting temperatures, finding that sequence heterogeneity also has significant effects on the probability that the ends of a duplex are open, i.e. that they fray. We found that A-T ends are typically frayed, while sequences with G-C ends exhibit a free-energy minimum for a completely closed duplex.
(c) The effect of stacking strength in the loop on hairpin stability: The SL model only distinguishes base-pair steps. Given that we used this model to generate the melting temperatures to which we fit, we were unable to uniquely isolate the stacking strength of individual base combinations. Additional experimental data on single-stranded stacking is needed to separate these interactions. One potential source of data that goes beyond the SL model is given by experiments on melting of hairpins with poly(dA) and poly(dT) loops.Goddard00 By calculating how increasing the stacking strength in the loop lowers the melting temperatures, we showed that parameters could be derived that reproduce the expected stronger AA compared to TT stacking, without significantly changing the quality of our fit to the overall melting temperatures of duplexes. Nevertheless, we do not yet include this difference in our parametrization, because to be consistent we would need similar data to distinguish between other base-pair steps.
(d) The force-extension properties of single strands: Another experimental situation where differences in single-stranded stacking have been measured experimentally is in the force extension of ssDNA. We show that more strongly stacked sequences should be more extensible for small forces up to about 5 pN. For certain sequences, experiments have observed a concave “plateau” region in the force-extension curves. We are able to qualitatively reproduce this feature and, in agreement with previous explanations,Seol2007 attribute the plateau region to the different force response of stiffer stacked and more flexible unstacked regions. Furthermore, we show that the onset of the plateau region is correlated with a sharp decrease in the average length of stacked regions with increasing force. Because the average length of stacked regions drops rapidly with a relatively small decrease in the average stacking, we argue that a very large propensity to stack (%) is necessary to give a similar results to those observed in experiment. We therefore conclude that if these phenomena are to be explained through largely uncooperative stacking of bases to form helical ssDNA, as in our model, a high stacking propensity is required. Furthermore, failure to observe a force plateau for a sequence does not imply an absence of stacking.
(e) The structure of a kissing-loop complex: Finally, we applied our model to study the effect of sequence on the structure of a kissing complex formed by two hairpins. When the sequences used in the experiments of Ref. Bois2005, are studied, the average base model exhibits one minimum free-energy structure,Romano12a while our sequence-dependent model also generates a second, qualitatively distinct, stable structure. The new structure completely exposes a toehold which may significantly accelerate the DNA catalyst mediated release of free energy stored in the kissing complex.
The examples described above suggest that our model can be used for many other DNA applications in nanotechnology and biology where sequence plays a significant role. Our model should work particularly well for situations where single-to-double stranded transitions are important. Nevertheless, users of our model should remain aware of some limitations. Firstly, the model is only fit to a single salt concentration of M, where the electrostatic properties are strongly screened. A new kind of parametrization may be necessary to reach significantly lower salt concentrations. Secondly, the model lacks certain detailed local structural information, such as major and minor grooving, or sequence dependent elastic parameters. Furthermore, our model was fit to data that only includes the effects of base-pair steps. Additional experimental data on single-stranded stacking is needed to separate out the stacking strength of individual base combinations. Applications where the effects we neglect are crucial may therefore be best studied by other models.
We are developing further improvements to the model, but our work also highlights the need for new systematic experiments, in particular to elucidate the basic physics of single-stranded stacking interactions. Such information would be also of great help to those studying DNA-coated colloids. Mladek2012
To summarize, we have introduced a new coarse-grained model of DNA that has been parametrized to reproduce the thermodynamic effects of sequence-dependent interactions. The current version of the model provides a computationally efficient and physically accurate tool for the study of problems ranging from DNA nanotechnology to biology. To facilitate its use, we have made simulation code implementing Monte Carlo and Brownian dynamics for the model available as free software called oxDNA at http://dna.physics.ox.ac.uk.
VII Acknowledgments
The authors would like to thank Erik Winfree, Filip Lankaš, Felix Ritort and Agnes Noy for helpful discussions. The authors also acknowledge financial support from the Engineering and Physical Sciences Research Council, University College (Oxford), and from the Oxford Supercomputing Centre for computer time. P. Š. is grateful for the award of a Scatcherd European Scholarship.
References
- (1) W. Saenger, Principles of Nucleic Acid Structure, Springer-Verlag, New York, 1984.
- (2) L. Adleman, Science 266, 1021 (1994).
- (3) J. Bath, S. J. Green, and A. J. Turberfield, Angew. Chem. Int. Ed. 117, 4432 (2005).
- (4) J. Bath, S. J. Green, K. E. Allan, and A. J. Turberfield, Small 5, 1513 (2009).
- (5) E. Winfree, F. R. Liu, L. A. Wenzler, and N. C. Seeman, Nature 394, 539 (1998).
- (6) P. W. K. Rothemund, Nature 440, 297 (2006).
- (7) J. Šponer, K. E. Riley, and P. Hobza, Phys. Chem. Chem. Phys. 10, (2008).
- (8) A. Pérez, A. Noy, F. Lankaš, F. J. Luque, and M. Orozco, Nucleic Acids Res. 32, 6144 (2004).
- (9) P. Hobza and J. Šponer, Chem. Rev. 99, 3247 (1999).
- (10) J. Šponer et al., Chem. Eur. J. 12, 2854 (2006).
- (11) D. Svozil, P. Hobza, and J. Šponer, J. Phys. Chem. B 114, 1191 (2010).
- (12) J. Šponer, P. Jurečka, and P. Hobza, J. Am. Chem. Soc. 126, 10142 (2004).
- (13) W. D. Cornell et al., J. Am. Chem. Soc. 117, 5179 (1995).
- (14) B. R. Brooks et al., J. Comput. Chem. 4, 187 (1983).
- (15) A. Pérez, F. J. Luque, and M. Orozco, Acc. Chem. Res. 45, 196 (2012).
- (16) E. J. Sambriski, D. C. Schwartz, and J. J. de Pablo, Biophys. J. 96, 1675 (2009).
- (17) J. C. Araque, A. Z. Panagiotopoulos, and M. A. Robert, J. Chem. Phys. 134, 165103 (2011).
- (18) M. C. Linak, R. Tourdot, and K. D. Dorfman, J. Chem. Phys. 135, 205102 (2011).
- (19) K. Drukker, G. Wu, and G. C. Schatz, J. Chem. Phys. 114, 579 (2001).
- (20) M. Sales-Pardo, R. Guimera, A. A. Moreira, J. Widom, and L. Amaral, Phys. Rev. E 71, 051902 (2005).
- (21) M. Kenward and K. D. Dorfman, J. Chem. Phys. 130, 095101 (2009).
- (22) T. E. Ouldridge, I. G. Johnston, A. A. Louis, and J. P. K. Doye, J. Chem. Phys. 130, 065101 (2009).
- (23) T. A. Knotts, IV, N. Rathore, D. Schwartz, and J. J. de Pablo, J. Chem. Phys. 126 (2007).
- (24) A.-M. Florescu and M. Joyeux, J. Chem. Phys. 135, 085105 (2011).
- (25) A. Morriss-Andrews, J. Rottler, and S. S. Plotkin, J. Chem. Phys. 132, 035105 (2010).
- (26) A. V. Savin, M. A. Mazo, I. P. Kikot, L. I. Manevitch, and A. V. Onufriev, Phys. Rev. B 83, 245406 (2011).
- (27) P. D. Dans, A. Zeida, M. R. Machado, and S. Pantano, J. Chem. Theory Comput. 6, 1711 (2010).
- (28) A. Savelyev and G. A. Papoian, Biophys. J. 96, 4044 (2009).
- (29) N. B. Becker and R. Everaers, Phys. Rev. E 76, 021923 (2007).
- (30) F. Lankaš, Innovations in Biomolecular Modeling and Simulations, volume 2 of RSC Biomolecular Sciences, The Royal Society of Chemistry, 2012.
- (31) T. Dauxois, M. Peyrard, and A. R. Bishop, Phys. Rev. E 47, 684 (1993).
- (32) C. Nisoli and A. R. Bishop, Phys. Rev. Lett. 107, 068102 (2011).
- (33) S. Cocco and R. Monasson, Phys. Rev. Lett. 83, 5178 (1999).
- (34) T. E. Ouldridge, A. A. Louis, and J. P. K. Doye, Phys. Rev. Lett. 104, 178101 (2010).
- (35) T. E. Ouldridge, A. A. Louis, and J. P. K. Doye, J. Chem. Phys. 134, 085101 (2011).
- (36) T. E. Ouldridge, Coarse-grained modelling of DNA and DNA nanotechnology, PhD thesis, University of Oxford, 2011. The thesis is available at http://tinyurl.com/7ycbx7c
- (37) F. Romano, A. Hudson, J. P. K. Doye, T. E. Ouldridge, and A. A. Louis, J. Chem. Phys. 136, 215102 (2012).
- (38) C. De Michele, L. Rovigatti, T. Bellini, and F. Sciortino, Soft Matter , in press (2012).
- (39) C. Matek, T. E. Ouldridge, A. Levy, J. P. K. Doye, and A. A. Louis, arXiv:1206.2636v1 (2012).
- (40) C. Calladine and H. Drew, Understanding DNA: the molecule & how it works, Academic Press, 1997.
- (41) W. K. Olson, A. A. Gorin, X.-J. Lu, L. M. Hock, and V. B. Zhurkin, Proc. Natl. Acad. Sci. USA 95, 11163 (1998).
- (42) S. Geggier and A. Vologodskii, Proc. Natl. Acad. Sci. USA 107, 15421 (2010).
- (43) B. Basham, G. P. Schroth, and P. S. Ho, Proc. Natl. Acad. Sci. USA 92, 6464 (1995).
- (44) We use poly-dC,dA,dT,and dG notation for DNA sequences with repeated nucleotide content to distinguish them from RNA sequences, which are referred to with rC, rA, rU and rG.
- (45) B. Alberts et al., Molecular Biology of the Cell, fourth edition, Garland Science, 2002.
- (46) V. Ortiz and J. J. de Pablo, Phys. Rev. Lett. 106, 238107 (2011).
- (47) J. SantaLucia, Jr., Proc. Natl. Acad. Sci. U.S.A 17, 1460 (1998).
- (48) J. SantaLucia, Jr. and D. Hicks, Annu. Rev. Biophys. Biomol. Struct. 33, 415 (2004).
- (49) J. N. Zadeh et al., J. Comput. Chem. 32, 170 (2011).
- (50) M. Markham, Nicholas R.and Zuker, Methods. Mol. Bio. 453, 3 (2008).
- (51) N. R. Markham and M. Zuker, Nucleic Acids Res. 33, W577 (2005).
- (52) N. L. Novere, Bioinformatics 17, 1226 (2001).
- (53) J. M. Huguet et al., Proc. Natl. Acad. Sci. USA 107, 15431 (2010).
- (54) T. E. Ouldridge, A. A. Louis, and J. P. K. Doye, J. Phys.: Condens. Matter 22, 104102 (2010).
- (55) A. M. Ferrenberg and R. H. Swendsen, Phys. Rev. Lett. 61, 2635 (1988).
- (56) D. Landau and K. Binder, A Guide to Monte Carlo Simulations in Statistical Physics, Cambridge University Press, New York, NY, USA, 2005.
- (57) G. Torrie and J. P. Valleau, J. Comp. Phys. 23, 187 (1977).
- (58) W.-S. Chen et al., Phys. Rev. Lett. 105, 218104 (2010).
- (59) S. Whitelam, E. H. Feng, M. F. Hagan, and P. L. Geissler, Soft Matter 5, 1521 (2009).
- (60) D. Frenkel and B. Smit, Understanding Molecular Simulation: From Algorithms to Applications, Academic Press, Inc., Orlando, FL, USA, 1st edition, 1996.
- (61) J. Russo, P. Tartaglia, and F. Sciortino, J. Chem. Phys. 131, 014504 (2009).
- (62) J. Holbrook, M. Capp, R. Saecker, and M. Record, Biochemistry 38, 8409 (1999).
- (63) S. Nonin, J.-L. Leroy, and M. Gueron, Biochemistry 34, 10652 (1995).
- (64) D. Y. Zhang and E. Winfree, J. Am. Chem. Soc. 131, 17303 (2009).
- (65) N. L. Goddard, G. Bonnet, O. Krichevsky, and A. Libchaber, Phys. Rev. Lett. 85, 2400 (2000).
- (66) Y. Seol, G. M. Skinner, K. Visscher, A. Buhot, and A. Halperin, Phys. Rev. Lett. 98, 158103 (2007).
- (67) Y. Seol, G. M. Skinner, and K. Visscher, Phys. Rev. Lett. 93, 118102 (2004).
- (68) G. Mishra, D. Giri, and S. Kumar, Phys. Rev. E 79, 031930 (2009).
- (69) M.-N. Dessinges et al., Phys. Rev. Lett. 89, 248102 (2002).
- (70) S. B. Smith, Y. Cui, and C. Bustamante, Science 271, 795 (1996).
- (71) Y. Zhang, H. Zhou, and Z.-C. Ou-Yang, Biophys. J. 81, 1133 (2001).
- (72) A. Montanari and M. Mézard, Phys. Rev. Lett. 86, 2178 (2001).
- (73) J. Bois et al., Nucleic Acids Res. 33, 4090 (2005).
- (74) R. M. Dirks and N. A. Pierce, Proc. Natl. Acad. Sci. USA 101, 15275 (2004).
- (75) S. Venkataraman, R. M. Dirks, P. W. K. Rothemund, E. Winfree, and N. A. Pierce, Nat. Nanotechnol. 2, 490 (2007).
- (76) S. J. Green, J. Bath, and A. J. Turberfield, Phys. Rev. Lett. 101, 238101 (2008).
- (77) P. Yin, H. M. Choi, C. R. Calvert, and N. A. Pierce, Nature 451, 318 (2008).
- (78) R. A. Muscat, J. Bath, and A. J. Turberfield, Nano Lett. 11, 982 (2011).
- (79) S. J. Green, D. Lubrich, and A. J. Turberfield, Biophys. J. 91, 2966 (2006).
- (80) B. M. Mladek, J. Fornleitner, F. J. Martinez-Veracoechea, A. Dawid, and D. Frenkel, Phys. Rev. Lett. 108, 268301 (2012).