Predicting Efficiency in master-slave grid computing systems
Abstract
This work reports a quantitative analysis to predicting the efficiency of distributed computing running in three models of complex networks: Barabási-Albert, Erdős-Rényi and Watts-Strogatz. A master/slave computing model is simulated. A node is selected as master and distributes tasks among the other nodes (the clients). Topological measurements associated with the master node (e.g. its degree or betwenness centrality) are extracted and considered as predictors of the total execution time. It is found that the closeness centrality provides the best alternative. The effect of network size was also investigated.
I Introduction
Despite all the scientific and technological advances in scientific computing obtained along the last decades, the demand on intensive number crunching remains as high as ever. This has been caused by at least the three following factors: (i) increasing amount of data being continuously produced in virtually all areas; (ii) the higher resolutions of such data, often involving 3D images and movies; and (iii) the focus on complex, non-linear systems that has underlain much of the basic and applied sciences. Given that the individual processing power has saturated geer05 , ever increasing attention has been placed on distributed and networked systems. One particularly attractive possibility, known as grid-computing involves the use of a large number of computers, duly connected to the Internet, as a massive computing resource foster03:_grid . The immediate advantage of such an approach is to provide the access to a large mass of already existent machines, without much additional cost for hardware or software. However, the performance of a grid system will depend strongly on the protocol for distributing the tasks, the topology of the interconnections, and the type of processing required. As a matter of fact, the execution of distributed tasks in a grid network is a largely complex problem directly related to the structure/function paradigm in complex networks boccaletti06 . Previous approaches at trying to understand the efficiency in grid computing include a study of the effect of network connectivity complexgrid and of geographical constraints geographical on a simple grid computing model and how topology affects applications with real-time constraints realtime . Despite such recent advances, the investigation of how the topology of the interconnections on the respective performance remains an open problem. In particularly, it would be interesting to devise means to predict the execution time of grid computing systems from simpler network measurements, without the need of undergoing the whole process of real computations. The present work aims precisely at investigating how several types of networks measurements measure can be used to foresee the execution time in grid computing systems as modeled and simulated in terms of model complex networks of varying topology.
II Methodology
II.1 Grid Representation as a Complex Network
In this work, computing grids are modeled as graphs where the nodes are computers and the edges are two-directional internet-like connections (e.g. TCP/IP). This gives rise to an undirected complex network with nodes, that can be represented by a respective adjacency matrix, A. The element of the -th row and -th column of the matrix, denoted by , has value 1 if and only if there is a link between the -th and the -th node, and the value 0, otherwise.
The main issue in the current work is to choose a computer that will distribute the tasks to all other computers in such a way as to minimize the total execution time. It is natural to suppose that this optimum node should be, in some sense, central to the grid topology. With this in mind, the following metrics have been chosen in order to characterize the centrality of each node: degree centrality, betweenness centrality and closeness centrality (related with the average distance). Another important measure was included: the local clustering coefficient. All these metrics can be derived from the adjacency matrix .
Consider a node . The degree centrality (also known as node degree) gives the number of adjacent links to and is easily calculated by taking the number of non-zero elements in row :
The betweenness centrality tries to quantify how much a node is in the path connecting two other nodes. Considering all shortest paths connecting all pairs of nodes, the betweenness centrality of is related to the number of these paths passing through and defined as
where is the total number of shortest paths between nodes and , and is the number of those paths that pass through node . In this work we used the algorithm of Brandes brandes01 for its computation. The closeness centrality of node quantifies how close it is to the other nodes in the network and is taken as the reciprocal of the mean of the distances from to all other nodes:
where is the distance between nodes and and is taken as the number of edges of the shortest path connecting them. Finally, the local clustering coefficient of is defined as the number of links connecting its neighbors divided by the number of links necessary to fully connect all those neighbors (the number of links necessary to connect each and every pair of neighboring nodes), leading to a number between 0 and 1:
where is the number of links among neighbors of node .
II.2 Network Models
Three complex network models were chosen for this work: Erdős-Rényi (ER), Barabási-Albert (BA) and Watts-Strogatz (WS) newman03 .
In the ER model used fixes the number of nodes in the network and the probability of creating a link between any two nodes.
The Erdős-Rényi model is interesting for comparison and analysis but it lacks some properties found in real computing networks. Preferential attachment models like the Barábasi-Albert (BA) are more realistic, because they generate networks with degree distributions following a power law, very similar to those found in the real Internet faloutsos99 . Considering that many grid computing infrastructures are built upon the Internet or upon an Internet like network, the BA model is included in our analysis. BA networks are built by starting with a few unconnected nodes; for each new node created, connections are generated from this node to others in such a way that nodes with higher degree are more likely to receive one of the connections. The resulting network average degree will be equal to .
As another example of a network model that has different properties than the aforementioned, we chose the Watts-Strogatz (WS) model which implements the “small-world effect.” Short distances are frequently desirable in grids in order to minimize the communication latency among nodes. This model combines clustering coefficients that are higher than those in the BA and ER models with small distances. It starts with a regular structure such as a ring, with average degree and then rewires some edges with uniform probablity . Larger values of decrease clustering and average distances, but distances fall much faster. It is therefore possible, by adjusting , to see the effect of high clustering and small distances simultaneously.
II.3 Computational model
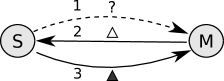
The computational model used is the same introduced in Ref. complexgrid . The application works as master/slave, with a master having a set of tasks that are distributed to the slaves for processing. All tasks require the same amount of time to compute. After choosing one of the nodes as the master, all other nodes in the network are slaves. Figure 1 shows a diagram of the computational model, which illustrates the time necessary for the slaves to send a message to the master. The processing starts with the slaves sending a task request to the master. For each request received, the master sends a task to be computed. After the slave finishes computing the task, the result is returned to the master, which sends another task to the slave, if there are yet tasks to compute (see Figure 1). When the results of all tasks are received by the master, the application stops.
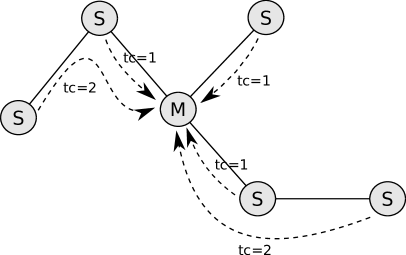
We consider that the time to send a task or result through each link is the same, and use this as the time unit. We also assume that the time taken by the master to choose a task to send and by each node to route packets to a neighbor node are negligible. Also, all nodes have the same computational power.
At the start of the execution, a slave that lies at a distance from the master will need to wait for a task for time units ( units for its request to reach the master and another for the task to arrive). Suppose the node takes time units to compute the task. The master will then receive the result for the first task from this slave at . Subsequent task results will arrive from this slave at intervals of (because the arrival of a result is a sign that the slave is idle, and the master can send a new task). If the total number of tasks is sufficiently large, all slaves at distance from the master will receive approximately the same number of task to compute; we represent this number of tasks as , as it depends on the distance. They will therefore take a total time of
| (1) |
Again if the total number of tasks is sufficiently large, all slaves will end processing approximately at the same time, such that we can consider in Equation 1 as the total execution time, but we will further simplify the expression because in this case is large with respect to , giving:
| (2) |
If we have a total of tasks to execute we get:
| (3) |
where is the number of nodes at distance from the master and is the maximum distance from the master for all nodes. Isolating in Equation 3 we get
| (4) |
If we have , Equation 4 reduces to
where is the number of nodes in the network. This is the best possible result for this application, and is achieved independently from network topology. On the other hand, if , most time is taken sending and receiving tasks, and it will make no sense to use a grid computing system (better results would be achieved by local execution of the tasks). The interesting values are then for , where total execution time depends on topology. More specifically, the results depend on the hierarchical structure of the network hierarchical .
III Results and discussion
In order to quantify the overall processing performance, we adopt the concept of efficiency padua11 . This measurement is calculated dividing the achieved speed-up by the ideal speed-up. Speed-up refers to the ratio between the total execution time with one processor and the total execution time using all the processors in the network. Therefore, the ideal speed-up is , i.e. the number of available processors (nodes).
The performed experiments proceed in three stages. First we compare the potential of several network topology measurements in predicting the grid efficiency for a BA configuration. Then, we investigate the effect of network size in the prediction. Finally, we consider other network models, more specifically the ER and WS models.
III.1 Preliminary Analysis
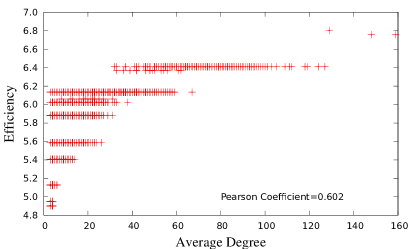
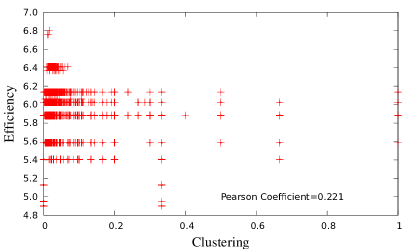
In order to have an initial indication of how several measurements of the topology of the networks influence execution time, we considered a BA networks with and (the latter reflects the trend observed in the real internet newman03 ). The individual tasks to be performed were assumed to be 10 (in the choosen time unit that corresponds to the time to send a task through a network link). Each simulation involves 10000 tasks. We obtained the execution times for 30 network configurations, which had their topology characterized in terms of their average degree, clustering coefficient, betweeness and closeness centralities. Figure 2 shows the processing efficiency in terms of each of these measurements, with respective Pearson correlation coefficients collected in Table 1. It is clear that the closeness exhibited a significant correlation with efficiency and the largest Pearson coefficient when compared with the other measurements, suggesting that it can be used to provide accurate predictions of the processing efficiency. For this reason, we henceforth focus on the closeness in this work.
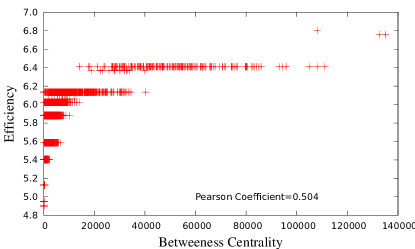
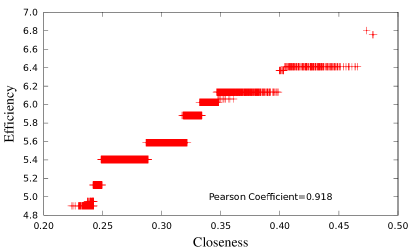
| Measure | Average Pearson |
|---|---|
| Degree | 0.611 |
| Clustering | 0.212 |
| Closeness | 0.918 |
| Betweenness | 0.514 |
III.2 Effect of Network Size
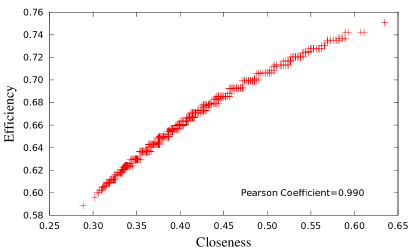
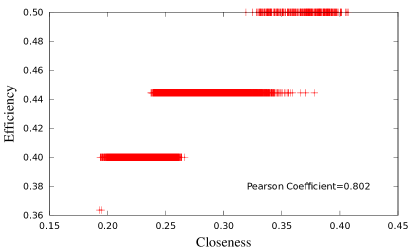
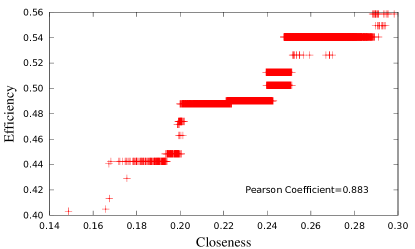
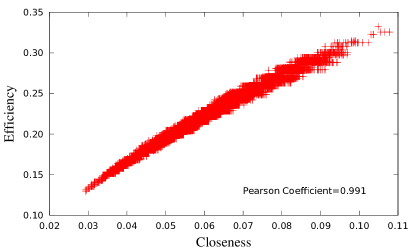
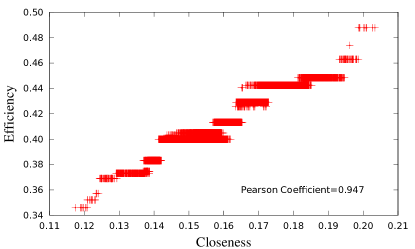
The previous experiment was performed with respect to BA networks with fixed sizes . Now we investigate the effect of on the predictive power of closeness. Figure 3 shows these results. The Pearson correlation coefficient decreases monotonically with , but remains high even for . The quantization effect in these results are an artifact implied because all tasks have the same computational load, all nodes have the same computational power, and all links transmit packets at the same rate. With our chosen parameter of time unit for packet transmission and time units for task computation, nodes that are at distance 1 from the master end their tasks at instants 13, 25, 37, 49, etc. while tasks from nodes at distance 2 end at instants 16, 30, 44, 58, etc. and from nodes at distance 3 at instants 19, 35, 51, 67, etc. When the total number of tasks is not large with respect to the number of nodes, only a few values of execution time are be possible.

III.3 Effect of Network Models
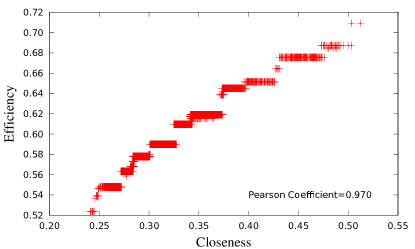
In order to investigate the effect of network topology on the efficiency, we performed simulations for ER and WS (for several values of ) models for and . The results are show in Figure 4. The Pearson correlation coefficients resulted very high for all cases. The same quantization effect already commented above appeared for the ER and WS with . This is a direct consequence of the fact that these configurations have smaller diameter. The highest efficiency values have been observed for the ER configuration.
IV Conclusions
The proliferation of concurrent processing systems in the last decades as an alternative to achieving high processing speeds has emphasized the need not only to quantify the obtained improvements, but also to try to predict the respective performance. Grid computing has been receiving growing attention along the last years because of its potential to harness available processing capabilities in a flexible and efficient manner. In this work, we set out to investigate how the efficiency of grid systems can be predicted while taking into account several topologic measurements of the topology of the grid network. First, we quantified, through the Pearson correlation coefficient, the potential of several measurements from complex networks to predict the efficiency of BA networks, finding out that the closeness provided the best alternative. Then, we checked out the influence of the networks size (i.e. number of nodes) on the prediction of the efficiency. Despite a quantization effect appearing for large sizes, all tried situations yielded very high Pearson coefficients. Finally, we also found that extremely good predictions can be obtained even for other network topologies such as ER and WS. The high values of Pearson correlation coefficients obtained for most tested cases allow us to choose the best master node from which to distribute the task, i.e. the node with the lowest average distance to other nodes would provide the best choice for this finality. Future works could investigate task distribution schemes other than the master-slave configuration addressed in the present work.
Acknowledgments
Gonzalo Travieso is grateful to CNPq (308118/2010-3), Carlos A. Ruggiero to FAPESP (03/08269-7), and Luciano da F. Costa to FAPESP (2011/50761-2) and CNPq (304351/2009-1) for the financial support.
References
- [1] D. Geer. Chip makers turn to multicore processors. Computer, 38(5):11–13, 2005.
- [2] Jan Foster and Carl Kesselman, editors. The Grid 2: Blueprint for a New Computing Infrastructure. The Elsevier Series in Grid Computing. Morgan Kaufmann, second edition edition, 2003.
- [3] S. Boccaletti, V. Latora, Y. Moreno, M. Chavez, and D.-U. Hwang. Complex networks: Structure and dynamics. Physics Reports, 424:175–308, 2006.
- [4] Luciano da F. Costa, Gonzalo Travieso, and Carlos A. Ruggiero. Complex grid computing. European Physical Journal B, 44:119–128, 2005.
- [5] Andre F. de Angelis, Gonzalo Travieso, and Carlos A. Ruggiero. On the effects of geographical constraints on task execution in complex. International Journal of Modern Physics C, 19:847–853, 2008.
- [6] Gonzalo Travieso and Luciano da F. Costa. Effective networks for real-time distributed processing. Journal of Systems Science and Complexity, 24:39–50, 2011.
- [7] Luciano da F. Costa, Francisco A. Rodrigues, Gonzalo Travieso, and Paulino R. Villas Boas. Characterization of complex networks: A survey of measurements. Advances in Physics, 56:167–242, 2007.
- [8] Ulrik Brandes. A faster algorithm for betweenness centrality. Journal of mathematical sociology, 25:163–177, 2001.
- [9] Mark E. J. Newman. The structure and function of complex networks. SIAM Review, 45:167–256, 2003.
- [10] Michalis Faloutsos, Petros Faloutsos, and Christos Faloutsos. On power-law relationships of the internet topology. In Proceedings of the conference on Applications, technologies, architectures, and protocols for computer communication, pages 251–262. ACM, 1999.
- [11] Luciano da F. Costa and Filipi N. Silva. Hierarchical characterization of complex networks. Journal of Statistical Physics, 125:845–876, 2006.
- [12] David Padua, editor. Encyclopedia of Parallel Computing. Springer, 2011.