Biogenic crust dynamics on sand dunes
Abstract
Sand dunes are often covered by vegetation and biogenic crusts. Despite their significant role in dune stabilization, biogenic crusts have rarely been considered in studies of dune dynamics. Using a simple model, we study the existence and stability ranges of different dune-cover states along gradients of rainfall and wind power. Two ranges of alternative stable states are identified: fixed crusted dunes and fixed vegetated dunes at low wind power, and fixed vegetated dunes and active dunes at high wind power. These results suggest a cross-over between two different forms of desertification.
Sand dunes have been the subject of active research for many years, largely because of their fascinating shapes and dynamics Bagnold (1941); Fryberger (1979); Pye and Tsoar (1990); Durán et al. (2010). Current studies have increasingly addressed the question of sand-dune stability in relation to climate change and anthropogenic disturbances Thomas et al. (2005); Ashkenazy et al. (2012); Provoost et al. (2011). Sand dunes are considered “stable” when they are fixed in place or are stationary 111We distinguish here between stable dunes and stable dune states. The former term refers to fixed or stationary dunes, whereas the latter refers to asymptotic stability in the sense of dynamical-system theory.. Their stability is strongly affected by the degree of vegetation coverage. High coverage reduces the wind power at the dune surface and thereby acts to immobilize the dunes. The re-mobilization of fixed dunes, either by vegetation mortality or clear-cutting, often has detrimental effects on the unique ecosystems that develop in stable dunes Brown (1973); Tsoar (2005), leading to alternative ecosystems associated with active sand Shanas et al. (2006). Active dunes may also pose a threat to human settlement as they can block roads and cover residential areas and agricultural fields Dong et al. (2004); Khalaf et al. (1993).
Sand dunes are also stabilized by biogenic soil crusts. These crusts comprise a variety of organisms, including cyanobacteria, lichens and mosses, which live at the surface of desert soils Belnap and Lange (2001). Biogenic crusts enhance the aggregation of sand grains, prevent saltation, and reduce wind erosion. Since most sandy soils are located in drylands where the vegetation is patchy and generally sparse Pye and Tsoar (1990), the role of biogenic crusts in stabilizing dunes is important and often crucial Veste et al. (2001). Despite their significance and vast presence in the Kalahari, Australian and Central Asia deserts Thomas et al. (2007); Hesse et al. (2006); Orlovsky et al. (2004), soil crusts have rarely been considered in studies of dune dynamics Yizhaq et al. (2007); Durán et al. (2006).
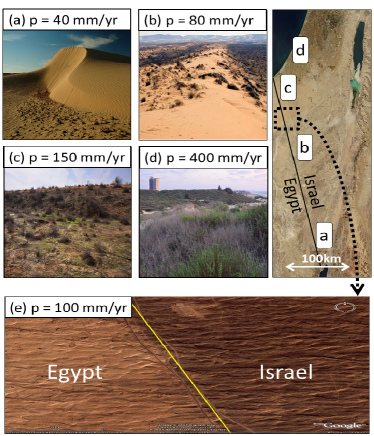
Depending on wind power and precipitation level different dune-cover states are observed. Figure 1 shows several typical states from regions of relatively weak winds. At very low precipitation levels (Fig. 1a), dunes are active due to low crust and vegetation coverage. As the precipitation increases, the dunes are gradually stabilized. At low precipitation levels, the dominant stabilizing agent is the soil crust (Fig. 1b,c), while at high levels, the stabilizing agent is predominantly vegetation (Fig. 1d). Although vegetation and biogenic crusts have similar effects in stabilizing dunes, they lead to ecosystems that differ vastly in their bioproductivity.
Motivated by these observations, we ask whether the transition from crusted to vegetated dunes along the rainfall gradient is gradual or abrupt, and how it is affected by the wind power. Studying these questions is significant for understanding desertification processes, i.e. processes involving the irreversible loss of vegetative bioproductivity von Hardenberg et al. (2001). To study these questions we introduce and analyze a new model, which extends an earlier model for vegetated dunes Yizhaq et al. (2007) to include crust dynamics.
The model consists of two coupled ordinary differential equations,
for the fractions and of surface cover by vegetation and biogenic crust, respectively, where represents the remaining bare sand, and the over dot denotes the time derivative. The first terms on the right sides of Eqs. (1) and (1) represent logistic growth. Implicit in these growth forms is the assumption that the two life forms, crust and vegetation, locally exclude one another; the presence of crust in a given location prevents the germination of plant seeds, while the presence of vegetation inhibits crust growth by blocking sunlight. The growth rates of vegetation, , and of biogenic crust, , are assumed to have the following dependence on annual precipitation ():
| (4) |
where , is a precipitation threshold below which there is no growth, and is the asymptotic growth rate at high precipitation levels. This form is in accordance with field observations Danin (1996). The parameters and represent spontaneous growth rates due to, for example, a bank of seeds and spores in the soil, respectively.
Wind affects the vegetation and the crust both directly and indirectly. Indirect wind effects include sand transport, which leads to root exposure and burial of plants and crusts by sand. This process is represented by the second terms in (1a) and (1b). The parameter , the drift potential, is proportional to the potential bulk of sand that can be transported by the wind, and is given by Bagnold (1941):
| (5) |
where is the wind speed and is a threshold velocity that is necessary for sand transport (approximately 12 knots for wind measured at 10 m above the ground). If is measured in knots (1 knot 0.5 m/s), the units of are defined as vector units (). can generally be classified into low, intermediate and high energy winds (, , and , respectively Fryberger (1979)).
The function introduces a wind shielding effect created by vegetation. Observations indicate Wolfe et al. (1993) that when vegetative cover exceeds a certain value (), it induces a skimming flow in which sand is protected from direct wind action. This value depends on various properties, such as plant shape and stem flexibility Buckley (1987); Wiggs et al. (1995). Based on these studies, we chose a continuous step-like function for :
| (6) |
such that for and for . The sharpness of is controlled by . Since the indirect wind effect requires the availability of sand, the whole term is multiplied by .
Direct wind effects are restricted, in the model, to vegetation and are represented by the third term in Eq. (1). This term accounts for stresses, such as increased evapotranspiration and branch cutting. It does not have a parallel in Eq. (1) since crust can sustain very intense winds Belnap et al. (1998). Wind drag is proportional to the square of the wind velocity, and therefore, this term is proportional to .
The parameters and represent non-local interactions between vegetation and crust not accounted for by the first terms of the RHS. It is still debated whether these interactions are positive or negative. On one hand, crust supports vegetation growth as a result of the “source-sink” effect Zaady and Shachak (1994): water runoff from the crust (“source”) flowing toward vegetation patches (“sink”). On the other hand, crust suppresses vegetation by preventing water infiltration in the vicinity of the roots of the plants. Biogenic crust is usually suppressed by plants due to litter from nearby plants which limits light and may destroy the crust if the litter is toxic Boeken and Orenstein (2001). Here, we assume that the negative relations are more significant. Finally, and represent grazing stress Yizhaq et al. (2007).
The parameter values used in this study are based on Yizhaq et al. Yizhaq et al. (2007) for the equation of the vegetation dynamics (Eq. (1)), and on the studies of Belnap et al. Belnap and Lange (2001); Belnap et al. (1998) for the crust (Eq. (1)). The numerical values are: ; ; ; ; ; ; ; ; ; ; ; ; ; ; ; ; .
The steady states of Eqs. (1) and (1) and their stability properties for low wind powers are presented in the bifurcation diagram shown in Fig. 2. The results are consistent with the general trend shown in Fig. 1 and reported in field observations Belnap and Lange (2001): a low precipitation range (a) of bare active dunes; intermediate precipitation ranges (b,c) of dunes with mixed crust-vegetation coverage, semi-stabilized (b) or almost stabilized (c); and a high precipitation range (d) of stabilized vegetated dunes. In addition, the diagram predicts a bistability range (c) of vegetation-dominated dunes () and crust-dominated dunes (). The bistability results from the negative vegetation-crust interactions assumed in the model, which relies on the conjecture that a crusted soil prevents the germination of plant seeds and also reduces the infiltration of surface water into the soil, while a vegetated soil provides shading and possibly toxic materials that inhibit the growth of crusts.
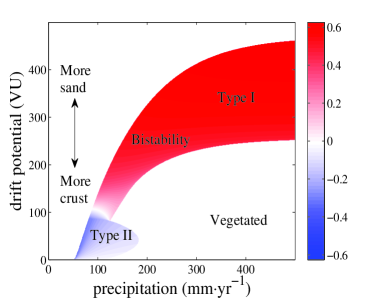
A different type of bistability is known to exist in regions of strong winds and high precipitation Tsoar (2005); Yizhaq et al. (2007). This form of bistability results from the wind-shielding effect of the plants. The high wind power makes a bare dune active and prevents plant growth, despite the high precipitation level. However, once the dune is vegetated, the resulting lower wind power allows its persistence. Thus, two forms of bistability, designated here as Type I and Type II, are possible. Type I is associated with the wind-shielding effect of vegetation and occurs at high precipitation and strong winds. In this case, the alternative stable dune states are bare active dunes and vegetated fixed dunes. Type II is associated with vegetation-crust competition and occurs at low precipitation and weak winds. Here, the alternative stable dune states are crust-dominated dunes and vegetation-dominated dunes. While bistability of Type I has been observed Tsoar (2005); Yizhaq et al. (2007), observations of Type II have not yet been reported.
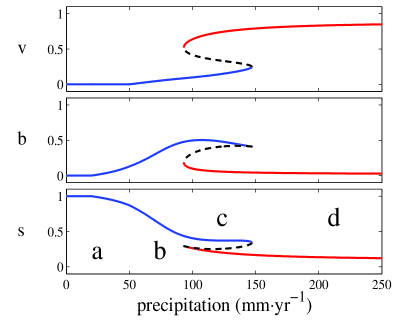
Figure 3 shows the domains of the two bistability forms in the plane spanned by the precipitation and the wind power . The two domains are connected to form a continuous domain; proceeding from low to high and values, a cross-over from the bistability of Type II to Type I occurs. Bounding the continuous bistability domain are monostability domains of unvegetated dunes (bare or crusted) at low or high , and vegetated dunes at high and low .
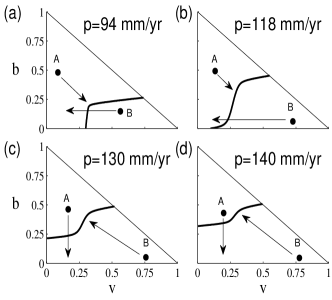
The existence of a biomass productive vegetation-dominated state and a less productive crust-dominated state, in the case of Type II bistability, implies the possible occurrence of desertification, i.e. a state transition inducing bioproductivity loss, as well as the feasibility of rehabilitation of vegetation, a state transition resulting in bioproductivity gain. By “bioproductivity“, we refer to the total amount of vegetative biomass. Such transitions can be triggered either by environmental variability, for example, precipitation or wind-power fluctuations, or by anthropogenic disturbances. The disturbance types that are necessary to trigger desertification or the rehabilitation of vegetation can be determined by examining the positions of the two stable states in relation to the boundary between their basins of attraction, as Fig. 4 illustrates. Disturbances involving vegetation removal can induce desertification (transition from point B to point A) only at sufficiently low precipitation levels (panels (a) and (b)). At higher precipitation levels (panels (c) and (d)), the disturbance should also involve an increase in crust coverage (at the expense of sandy soil), a rather unlikely disturbance scenario. Rehabilitation of vegetation (transition from point A to point B) at relatively low precipitation levels (panels (a) and (b)) cannot be triggered by crust removal only – planting is also necessary too. At higher precipitation levels (panels (c) and (d)), crust removal alone can trigger such rehabilitation. These conclusions may be affected by other choices for the signs of the interaction coefficients and .
The desertification form discussed above should be distinguished from that occurring in Type I bistability. In Type II bistability, both the productive and unproductive states (i.e. vegetated and crusted) represent stable, immobilized dunes, while in Type I, the non-vegetated (unproductive) state represents a mobile dune. Thus, desertification in the case of Type I bistability not only involves the loss of vegetation (bioproductivity) but may also lead to detrimental effects associated with dune mobility.
The results of the model qualitatively agree with a phenomenon that has been observed at the Israeli-Egyptian border, where sand dunes on the Egyptian side are active, while on the Israeli side, dunes are semi-stabilized. This difference in dune activity is the result of a vast cover of biogenic crust on the Israeli side and its absence on the Egyptian side. The phenomenon is clearly visible across the border line (see Fig. 1e) due to different albedo values for crust and sand. It was argued that biogenic crust is absent from the Egyptian dunes due to grazing activities that have led to crust trampling and erosion Karnieli et al. (1995). Analyzing this region in our model ( ), we find that grazing stress () yields bare dunes with low cover of crust and plants (), while absence of grazing () yields crust-dominated dunes (). Introducing grazing at low precipitation levels may, therefore, have a major effect on the fraction of bare dunes, doubling it in the numerical example presented above.
Further analysis of the model shows that steady mixed dune-cover states may undergo oscillatory instabilities. We find that if non-local competition is assumed to be negligible (), the oscillations emerge in a supercritical Hopf bifurcation at , where is the parameter that controls the wind-shield steepness in Eq. (6)). As is increased beyond the Hopf bifurcation point, , the amplitude of the oscillations increases and their frequency decreases. For (i.e. approaches a step function), the amplitude saturates and the dynamics take the form of relaxation-oscillations.
We suggest the following mechanism for the oscillations. Let us begin the description of a cycle with a state where and . Under such conditions, plants provide wind shield, which promotes the growth of both vegetation and crust at the expense of bare sand. As this growth proceeds, two processes become significant: the diminishing bare sand, which slows down the growth of both vegetation and crust; and the direct wind stress effect that suppresses vegetation growth but does not affect the crust. The latter process favors the growth of crust at the expense of vegetation. As a result, the vegetation will reach a maximal value and start declining, while the crust will continue growing. The growth of crust and the decline of vegetation will continue until . At this point, the sand drift effect will become dominant, and the crust will decline too, until there will be enough available sand for regrowth. Since the growth rate of vegetation is significantly larger than that of crust, vegetation will start growing at the expense of crust, until it exceeds , and a new cycle will start over.
In summary, a mathematical model was introduced to analyze the effect of biogenic crusts on sand dunes. Although simple, the model is able to capture important aspects of the complex dynamics of biogenic crusts and vegetation on sandy soils. Most significantly, it predicts a new form of bistability in which the two alternative stable states correspond to stabilized dunes with different proportions of vegetation and crust coverage. This bistability form (Type II) prevails at low precipitation and wind power values, and differs from the bistability of bare dunes and vegetated dunes at high precipitation and wind power values (Type I) Tsoar (2005); Yizhaq et al. (2007). The two bistability forms merge in the parameter plane to form a single continuous domain with a small cross-over zone. The model sheds new light on the vulnerability of sandy regions to desertification and on the means to restore degraded vegetation.
We thank G. Bel, D. Perlstien, H. Tsoar, E. Zaady, and Y. Zarmi for fruitful discussions. We thank the Israel Science Foundation for financial support.
References
- Bagnold (1941) R. Bagnold, Physics of Blown Sand and Desert Dunes (London, 1941).
- Fryberger (1979) S. G. Fryberger, in A Study of Global Sand Seas, edited by E. D. McKee (U. S. Geological Survey, 1979).
- Pye and Tsoar (1990) K. Pye and H. Tsoar, Aeolian Sand and Sand Dunes (Springer, 1990), 2nd ed.
- Durán et al. (2010) O. Durán et al., Earth Surf. Proc. Land. 35, 1591 (2010).
- Thomas et al. (2005) D. S. G. Thomas et al., Nature 435, 1218 (2005).
- Ashkenazy et al. (2012) Y. Ashkenazy et al., Climatic Change 112, 901 (2012).
- Provoost et al. (2011) S. Provoost et al., J. Coast. Conserv. 15, 207 (2011).
- Brown (1973) J. H. Brown, Ecology 54, pp. 775 (1973).
- Tsoar (2005) H. Tsoar, Physica A 357, 50 (2005).
- Shanas et al. (2006) U. Shanas et al., Biol. Conserv. 132, 292 (2006).
- Dong et al. (2004) Z. Dong et al., J. Arid Environ. 57, 329 (2004).
- Khalaf et al. (1993) F. Khalaf et al., Geomorphology 6, 111 (1993).
- Belnap and Lange (2001) J. Belnap and O. L. Lange, Biological Soil Crusts: Structure, Function, and Management (Springer, 2001).
- Veste et al. (2001) M. Veste et al., in Sustainable Land Use in Deserts, edited by M. Veste et al. (Springer, 2001), pp. 357–367.
- Thomas et al. (2007) A. Thomas et al., Geomorphology 85, 17 (2007).
- Hesse et al. (2006) P. P. Hesse et al., Geomorphology 81, 276 (2006).
- Orlovsky et al. (2004) L. Orlovsky et al., J. Arid Environ. 56, 579 (2004).
- Yizhaq et al. (2007) H. Yizhaq et al., Phys. Rev. Lett. 98, 188001 (2007).
- Durán et al. (2006) O. Durán et al., Phys. Rev. Lett. 97, 188001 (2006).
- von Hardenberg et al. (2001) J. von Hardenberg et al., Phys. Rev. Lett. 87, 198101 (2001).
- Amir (2011) R. Amir, Master’s thesis, Ben Gurion University of the Negev (2011).
- Yair et al. (2008) A. Yair et al., in Arid Dune Ecosystems, edited by S.-W. Breckle et al. (2008), pp. 425–440.
- Danin (1996) A. Danin, Plants of desert dunes (Springer Berlin, 1996).
- Wolfe et al. (1993) S. A. Wolfe et al., Prog. Phys. Geog. 17, 50 (1993).
- Buckley (1987) R. Buckley, Nature 325, 426 (1987).
- Wiggs et al. (1995) G. Wiggs et al., Earth Surf. Proc. Land. 20, 515 (1995).
- Belnap et al. (1998) J. Belnap et al., J. Arid Environ. 39, 133 (1998).
- Zaady and Shachak (1994) E. Zaady and M. Shachak, Am. J. Bot. 81, 109 (1994).
- Boeken and Orenstein (2001) B. Boeken and D. Orenstein, J. Veg. Sci. 12, 825 (2001).
- Karnieli et al. (1995) A. Karnieli et al., Int. J. Remote. Sens. 16, 369 (1995).