Multi-wavelength Observations of Blazar AO 0235+164 (catalog ) in the 2008-2009 Flaring State
Abstract
The blazar AO 0235+164 (catalog ) (z=0.94) has been one of the most active objects observed by Fermi Large Area Telescope (LAT) since its launch in Summer 2008. In addition to the continuous coverage by Fermi, contemporaneous observations were carried out from the radio to -ray bands between 2008 September and 2009 February. In this paper we summarize the rich multi-wavelength data collected during the campaign (including F-GAMMA, GASP-WEBT, Kanata, OVRO, RXTE, SMARTS, Swift and other instruments), examine the cross-correlation between the light curves measured in the different energy bands, and interpret the resulting spectral energy distributions in the context of well-known blazar emission models. We find that the -ray activity is well correlated with a series of near-IR/optical flares, accompanied by the increase in the optical polarization degree. On the other hand, the X-ray light curve shows a distinct 20-day high state of unusually soft spectrum, which does not match the extrapolation of the optical/UV synchrotron spectrum. We tentatively interpret this feature as the bulk Compton emission by cold electrons contained in the jet, which requires an accretion disk corona with effective covering factor of 19% at a distance of 100 . We model the broad-band spectra with a leptonic model with external radiation dominated by the infrared emission from the dusty torus.
1 Introduction
Blazars are a class of active galactic nuclei characterized by high flux variability at all wavelengths and compact (milli-arcsecond scale) radio emission of extreme brightness temperatures, often exceeding the Compton limit (Urry, 1999). Their radio spectra are generally well-described by a power-law shape, with a “flat” spectral index (where the flux density ). Multi-epoch VLBI (Very Long Baseline Interferometry) observations often show superluminal expansion, and the radio and optical emission is usually highly polarized. These general properties are well-described as arising in a relativistic jet pointing close to our line of sight (Blandford & Rees, 1978). The jet, presumably deriving its power from accretion onto a supermassive, rotating black hole surrounded by an accretion disk, contains ultrarelativistic electrons (with particle Lorentz factors reaching , depending on the object). These relativistic electrons produce soft photons from radio up to UV (or in some cases, soft X-rays) through synchrotron emission, and high-energy photons up to TeV energies, via the inverse-Compton process which involves scattering of synchrotron photons (the SSC scenario), as well as scattering of externally produced soft photons (the External Radiation Compton, ERC, scenario). A contribution to the high energy radiation can also be provided by synchrotron radiation of pair cascades powered by hadronic processes and by synchrotron emission of ultra-high-energy protons and muons (see reviews of radiative models of blazars by Sikora & Madejski 2001; Levinson 2006; Böttcher 2007). Noting difficulties of hadronic models to explain the spectra of luminous blazars (Sikora et al., 2009; Sikora, 2011), we investigate in this paper only leptonic models, i.e., the models which involve production of radiation by directly accelerated electrons. Densely sampled, simultaneous monitoring observations throughout the entire electromagnetic spectrum from the radio to -ray bands can provide important constraints on such models.
When emission lines are absent or weak, with an equivalent width (EW) less than 5 Å in the rest frame (see, e.g., Stickel et al., 1991), a blazar is classified as a BL Lac object; otherwise it belongs to the class of flat-spectrum radio quasars (FSRQs). While in a majority of BL Lac objects - especially in those with the spectral energy distribution (SED) peaking in the far UV - to X-ray range (the so-called HSP, or “high-synchrotron peaked BL Lac objects”) - detection of emission lines is rare, and if detected, the lines are extremely weak (for recent measurements, see, e.g., Stocke, Danforth & Perlman 2011), in the objects where the SED peaks in the infrared or optical range (the so-called LSP, or “low-synchrotron peaked BL Lac objects”), easily discernible emission lines have been detected often. When detected, such lines provide a measurement of redshift, but also yield crucial information about the details of accretion in the central source. In some cases such as AO 0235+164 (catalog ) (Raiteri et al., 2007), discussed in this paper, and even BL Lacertae (Vermeulen et al., 1995; Corbett et al., 2000), the prototype of the BL Lac class, the EW of emission lines can vary from one observational epoch to another. This is primarily due to large-amplitude variability of the nonthermal continuum, which becomes brighter or fainter with respect to the presumably less-variable emission lines. Regardless, the detailed properties of the emission lines are crucial in establishing the radiative environment encountered by the jet emerging from the nucleus, and thus are indispensable in establishing the most likely source of seed-photon population for inverse Compton scattering. While the most compelling scenario has the internal jet photons dominating this population in the HSP sub-class, and the external photons (from emission-line region, or disk photons rescattered by the medium confining the lines) in FSRQs, the situation with LSP BL Lac objects is unclear.
Studies of an LSP blazar AO 0235+164 (catalog ) provide an exceptional opportunity to answer this question. It is one of the original BL Lac objects in the Stein et al. (1976) compilation, discovered via optical identification of a variable radio source by Spinrad & Smith (1975). Early observations - as well as the inspection of historical plates - revealed that optical variability can range over 5 magnitudes (Rieke et al., 1976), motivating monitoring observations over a wide range of frequencies since its discovery. The redshift has been inferred from weak optical emission lines by Cohen et al. (1987), but even earlier optical spectroscopy revealed two absorption line systems, one at , and another, weaker one at discovered by Burbidge et al. (1976) and by Rieke et al. (1976). The intervening system has also been detected in absorption in the radio, via the redshifted hydrogen 21 cm line by Wolfe & Wills (1976) and Roberts (1976), but also as a Ly absorber, revealing damped Ly properties (Snijders, 1982), and implying a considerable absorption in other bands. Detailed studies of that absorbing system by Junkkarinen et al. (2004) allow accurate corrections to be applied to the observed optical spectra in order to determine reliably the intrinsic spectrum of the blazar. Likewise, since the environment in the field of AO 0235+164 (catalog ) is complex and includes several possibly interacting foreground galaxies at as well as the system at , the emission in the optical-UV band (and to much lesser degree, in the soft X-ray band) may be contaminated. One galaxy, probably a normal spiral, is 1.3 arcsec east, while another object, about 2 arcsec to the south, is known to be an AGN and could affect the flux of AO 0235+164 (catalog ) when it is very faint, especially in the bluer part of the spectrum (Raiteri et al., 2005).
Historical data for this source are abundant. Radio observations were performed by many instruments, starting from about 100 MHz up to 300 GHz, and including multi-epoch VLBI studies (Jorstad et al., 2001). Space and ground-based infrared data are available from sub-mm (far-IR) down to micron wavelengths (near-IR); optical bands, UBVRI, have been extensively monitored by many telescopes around the world. AO 0235+164 (catalog ) has also been detected in the high energy band by essentially all soft X-ray observatories including (Worral & Wilkes 1990), (Ghosh & Soundararajaperumal 1995), (Madejski et al. 1996, Comastri et al. 1997), (Madejski et al. 1996, Junkkarinen et al. 2004), Beppo-SAX (Padovani et al. 2004), (Webb et al. 2000), and XMM-Newton (Raiteri et al. 2008). This source has also been identified as a powerful and strongly variable -ray emitter via observations by onboard the Compton Gamma-Ray Observatory () in the high -ray energy range from 30 MeV to 20 GeV, with six pointings between 1992 and 1997 providing two detections (Hunter et al., 1993; Madejski et al., 1996) and four upper limits. The mid-energy -ray emission was probed by COMPTEL during Cycle 4 (1994-1995), yielding only upper limits for the flux in the interval of 0.75-30 MeV. These numerous multi-wavelength observations show that AO 0235+164 (catalog ) is characterized by extreme variability on long (month-years) and short (intraday) time scales over a wide range of the electromagnetic spectrum.
The study of blazars, of their broad-band spectra and of their complex variability, has been greatly enriched since the start of scientific observations with the Fermi Large Area Telescope (LAT) in 2008 August (Atwood et al., 2009) thanks to its high sensitivity and essentially uninterrupted observations afforded by the survey mode. Such new and sensitive -ray observations motivated many multi-band campaigns, often conducted with dedicated facilities, and AO 0235+164 (catalog ) was (and continues to be) one of the well-sampled targets. This paper presents the results of the LAT monitoring of AO 0235+164 (catalog ), as reported in Section 2. The description of multi-wavelength observations conducted between 2008 August and 2009 February when the source showed strong activity in -rays as well as in radio through optical and X-ray bands (Corbel & Reyes, 2008; Foschini et al., 2008), follows in Section 3. The analysis of those data, including the discussion of the temporal profiles measured in various bands and the connection to the -ray activity, is reported in Section 4. A significant part of these data have been independently analyzed by Agudo et al. (2011b). In Section 5 we present the overall spectral energy distribution (SED) and its temporal behavior, and discuss the implications of the data on the modeling of emission processes and the structure of the jet in AO 0235+164 (catalog ): there, we argue that while the equivalent width of emission lines in this object might suggest a classification as a BL Lac object, the isotropic luminosity inferred from the data indicates it is a quasar. In Section 6, we show models of the broad-band emission in the context of synchrotron + Compton models. Our consideration of the broad-band SED suggests that the most likely mechanism for -ray emission is Comptonization of circumnuclear IR radiation from dust, commonly present in quasars. This is a different scenario from the one proposed by Agudo et al. (2011b), who argued for the synchrotron self-Compton process. We discuss these two approaches in Section 7. We conclude with a summary of our results in Section 8.
2 Fermi-LAT Observations and Data Analysis
The LAT, the primary instrument onboard the Fermi -ray observatory, is an electron-positron pair conversion telescope sensitive to -rays of energies from 20 MeV to 300 GeV. The LAT consists of a high-resolution silicon microstrip tracker, a CsI hodoscopic electromagnetic calorimeter and an anticoincidence detector for the identification of charged particles background. The full description of the instrument and its performance can be found in Atwood et al. (2009). The large field of view (2.4 sr) allows the LAT to observe the full sky in survey mode every 3 hours. The LAT point spread function (PSF) strongly depends on both the energy and the conversion point in the tracker, but less so on the incidence angle. For 1 GeV normal-incidence conversions in the upper section of the tracker the PSF 68 containment radius is 0.8∘.
The Fermi-LAT data of AO 0235+164 (catalog ) presented here were obtained in the time period between 2008 August and 2009 February when AO 0235+164 (catalog ) entered a bright high -ray state; and immediately after, dropped to lower states. The data have been analyzed by using the standard Fermi-LAT software package111http://fermi.gsfc.nasa.gov/ssc/data/analysis/documentation/Cicerone/. The Pass 6 Diffuse event class and P6V3DIFFUSE instrument response functions (Atwood et al. 2009) were used in our analysis. We selected events within a 15∘ region of interest (RoI) centered on the source position, having energy greater than 100 MeV. The data have been analyzed using the Science Tools software package (version v9r16). In order to avoid background contamination from the bright Earth limb, time intervals when the Earth entered the LAT Field of View were excluded from the data set. In addition, events with zenith angles larger than 105∘ with respect to the Earth reference frame (Abdo et al., 2009) were excluded from the analysis. The data were analyzed with an unbinned maximum likelihood technique described by Mattox et al. (1996) using the analysis software (gtlike) developed by the LAT team222http://fermi.gsfc.nasa.gov/ssc/data/analysis/documentation/Cicerone/Cicerone_Likelihood.
Accurate spectral and flux measurements require a reliable accounting for the diffuse foreground due to the Galactic interstellar emission, as well as the extragalactic diffuse -ray emission, the residual cosmic ray background, and contamination from nearby sources. The fitting procedure simultaneously fits for the parameters of the source of interest as well as of nearby -ray sources and the diffuse backgrounds, which in turn have been modeled using glliemv02 for the Galactic diffuse emission and isotropiciemv02 for the extragalactic isotropic emission models333http://fermi.gsfc.nasa.gov/ssc/data/access/lat/BackgroundModels.html.
The sources surrounding AO 0235+164 (catalog ) were modeled using a power-law function:
| (1) |
where N is the normalization factor and the photon index. In the fitting procedure, all sources within 10∘ were included in the model with the normalization factor N free, while the sources located between 10∘ and 20∘ had all the model parameters fixed to the 1FGL catalog values (Abdo et al., 2010a).
The plots in subsequent sections show only statistical errors for the fit parameters. Systematic errors arise mainly from uncertainties on the LAT effective area, which is derived from the on-orbit estimations. These errors could be as large as 10 below 0.1 GeV, 5 near 1 GeV and 20 above 10 GeV.
2.1 -ray Light Curve
The light curve of AO 0235+164 (catalog ) in the Fermi-LAT energy range has been assembled using 3-day long time bins and covers the first 6 months of data taking from 2008 August 4 to 2009 February 4, when the source was in a high state and a large set of multi-wavelength observations is available. The light curve is obtained applying the gtlike fit across the overall energy range considered, from 100 MeV to 100 GeV, in each of the selected time bins. For each time interval the flux and the photon index of AO 0235+164 (catalog ) are determined using the maximum likelihood algorithm implemented in gtlike, following the procedure outlined in the previous section. The data are modeled with a power-law function with both the normalization factor and photon index left free in the likelihood fit.
The 6-month -ray light curve is reported in Figure 1 together with the photon index resulting from the likelihood fit in each time bin. The trend in the entire energy range from 100 MeV to 100 GeV shows a clear high-state period followed by a final, narrow, high-flux peak.
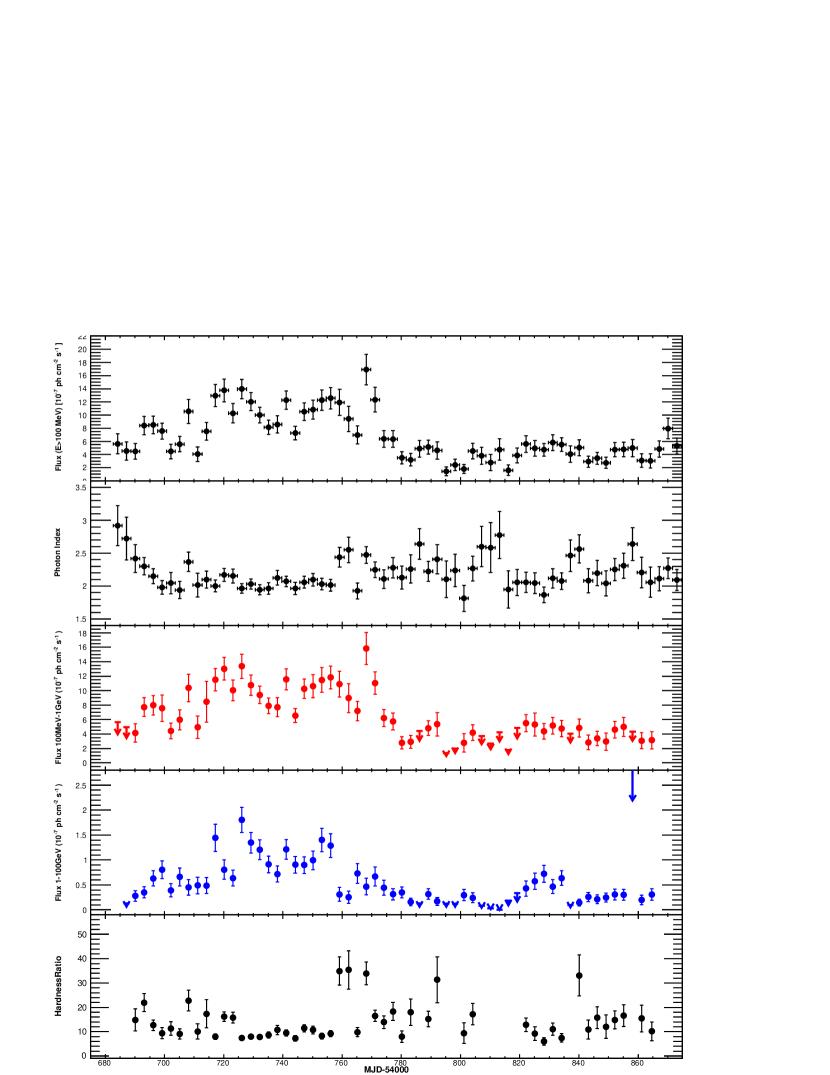
The temporal behavior of the source in -rays was also studied in two separate energy ranges, from 100 MeV to 1 GeV and from 1 GeV to 100 GeV and the hardness ratio among the two bands has been determined. The analysis follows the same procedure described above to determine the overall light curve and the results are shown in the three bottom panels of Figure 1.
The arrows in the light curves represent 95% upper limits, which are calculated for data points with a test statistic (TS)444The Test Statistics is defined as TS = -2(log(L1)-log(L0)) with L0 the likelihood of the Null-hypothesis model as compared to the likelihood of a competitive model, L1; see Mattox et al. (1996). lower than 10 (which corresponds to a significance somewhat higher than 3), or with a value of the ratio between flux error and flux (Ferr(E)/F(E))0.5 in order to obtain meaningful data points.
The results show that both the low- and high-energy profiles follow the same trend. Nevertheless, it is interesting to underline that the narrow peak at the end of the high-state period is mainly due to an enhanced low-energy flux. The ratio among the two fluxes also shows a value higher than the average in the same time interval.
2.2 -ray Spectral Analysis
The unbinned gtlike analysis has been applied to produce the -ray energy spectra shown in Figure 2. There, we divided the full energy range from 100 MeV to 100 GeV into 2 equal logarithmically spaced bins per decade. In each energy bin a TS value greater than 10 and a ratio between flux error and flux lower than 0.5 was required to quote a flux in that band, otherwise a 95% upper limit was given.
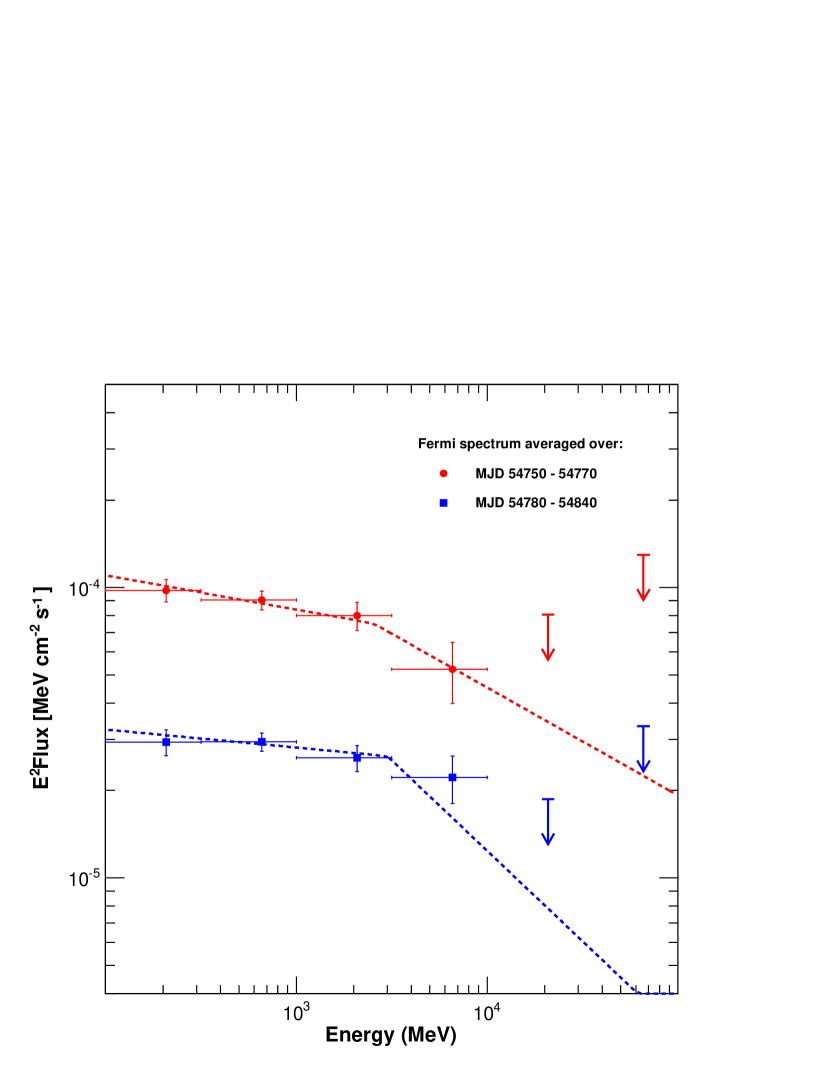
The standard gtlike tool was applied in each energy bin, modeling all the point sources in the region with a simple power-law spectrum with photon index fixed to 2. The normalization parameters of all point-like sources within 10∘ were left as free parameters in the fitting procedure, while the diffuse background components were modeled as described above in 2.1. Two time intervals were selected for the -ray spectral analysis: the first corresponding to the X-ray flare interval (MJD 54750-54770), the second associated with the subsequent low -ray state (MJD 54780-54840). In those time intervals, both power-law and broken-power-law functions provide a good fit of the spectral data. We show the results of the broken-power-law fit, since it provides a better fit to the high-energy spectrum of the source, from 100 MeV to 100 GeV, than a simple power law on the larger time intervals, as already studied in detail by Abdo et al. (2010b).
| (2) |
| Time Interval | Flux | Break Energy | ||
|---|---|---|---|---|
| MJD | 10-7 ph cm-2s-1 | GeV | ||
| 54750-54770 | 11.051.48 | 2.120.16 | 2.370.32 | 2.60.8 |
| 54780-54840 | 3.420.65 | 2.070.17 | 2.770.32 | 3.81.2 |
In both time intervals the index remains stable, while increases showing a softening of the high energy part of the spectrum when the source is in a fainter state, when also an increase in the break energy is observed. As also can be seen in Figure 1, the high -ray state around MJD 54760 is essentially due to the low energy photons (1 GeV) and the spectra in Figure 2 show that the relative difference between the E2Flux values above 1 GeV and below 1 GeV is higher in the time interval around the flare than during the low -ray state.
3 Multi-wavelength Observations and Data Analysis
The multi-wavelength campaign conducted on AO 0235+164 (catalog ) in 2008-2009 saw a wide international participation. Table 2 reports the list of participating observatories, the energy bands, the period of observation and the number of collected data points.
| Observatory | Bands | Period of Observation | Data Points | |
| Radio | ||||
| GASP-WEBT | Mauna Kea (SMA), USA | 345 GHz | 54664-54840 | 10 |
| 230 GHz | 54645-54842 | 23 | ||
| Medicina, Italy | 5 GHz | 54724 | 1 | |
| 8 GHz | 54606-54777 | 7 | ||
| 22 GHz | 54604-54779 | 7 | ||
| Metsähovi (KURP-GIX),Finland | 37 GHz | 54633-54839 | 54 | |
| Noto, Italy | 43 GHz | 54642-54841 | 8 | |
| UMRAO, USA | 5 GHz | 54677-54840 | 16 | |
| 8 GHz | 54621-54851 | 20 | ||
| 14.5 GHz | 54633-54848 | 41 | ||
| F-GAMMA | Effelsberg 100-m | 2.64 | 54414-55227 | 23 |
| 4.85 GHz | 54414-55227 | 24 | ||
| 8.35 GHz | 54414-55227 | 24 | ||
| 10.45 GHz | 54414-55227 | 25 | ||
| 14.6 GHz | 54422-55227 | 22 | ||
| 23.05 GHz | 54422-55227 | 17 | ||
| 32 GHz | 54616-55227 | 11 | ||
| 42 GHz | 54546-55227 | 8 | ||
| IRAM 30-m | 86.2 GHz | 54382-55228 | 17 | |
| 142.3 GHz | 54382-55228 | 15 | ||
| 228.4 GHz | 54440-54806 | 5 | ||
| IRAM PdBI | 88.9 GHz | 54700 | 1 | |
| 169 GHz | 54883 | 1 | ||
| OVRO | 15 GHz | 54661-54848 | 49 | |
| Near-Infrared | ||||
| GASP-WEBT | Campo Imperatore | J | 54645-54794 | 87 |
| H | 54645-54794 | 82 | ||
| K | 54645-54794 | 83 | ||
| Kanata | J | 54690-54753 | 21 | |
| V | 54690-54753 | 21 | ||
| Ks | 54690-54753 | 21 | ||
| SMARTS | J | 54662-54847 | 69 | |
| K | 54662-54842 | 39 | ||
| Optical | ||||
| GASP-WEBT | Abastumani 70 cm | R | 54687-54780 | 287 |
| Armenzano, 40 cm | R | 54699-54727 | 16 | |
| Calar Alto | R | 54712-54887 | 5 | |
| Crimean 70cm; ST-7 | R | 54691-54805 | 218 | |
| Kitt Peak (MDM 130 cm) | R | 54745-54801 | 50 | |
| L’Ampolla | R | 54778-54784 | 2 | |
| Lulin (SLT) | R | 54688-54862 | 120 | |
| Roque (KVA 35 cm) | R | 54748-54862 | 29 | |
| San Pedro Martir 84 cm | R | 54709-54773 | 15 | |
| St. Petersburg | R | 54698-54865 | 41 | |
| Talmassons | R | 54728-54843 | 11 | |
| Tuorla | R | 54722-54732 | 3 | |
| SMARTS | R | 54662-54868 | 71 | |
| B | 54662-54871 | 69 | ||
| V | 54662-54859 | 68 | ||
| Steward | R | 54743-54832 | 39 | |
| V | 54743-54863 | 44 | ||
| SWIFT-UVOT | U | 54711-54818 | 16 | |
| B | 54711-54818 | 16 | ||
| V | 54711-54818 | 16 | ||
| Ultra-Violet | ||||
| SWIFT-UVOT | UVW1 | 54711-54818 | 16 | |
| UVM2 | 54711-54818 | 15 | ||
| UVW2 | 54711-54818 | 16 | ||
3.1 Effect of intervening material in the line of sight on the optical, UV and X-ray data
Conversion of the observed optical magnitudes into the intrinsic flux densities requires a special care, because the source emission is absorbed not only in our Galaxy, but also by the elliptical galaxy in the line of sight at redshift , as outlined in the Introduction. Junkkarinen et al. (2004) tried several different extinction models for AO 0235+164, concluding that the best fit to their HST/STIS data is obtained by using models of Cardelli et al. (1989) with and for the Galaxy, and and for the system. This model accurately reproduces the absorption feature produced by the galaxy, but the far-UV end of their spectrum indicated a sharp hardening. Raiteri et al. (2005) proposed that this far-UV hardening is real and that it marks the onset of a new spectral component. However, the fact that the shape of this feature does not change with the overall optical/UV luminosity indicates that the whole optical/UV spectrum is produced by a single synchrotron component, which intrinsic shape must be close to a power-law. The far-UV hardening most likely is an artefact of overestimated extinction from the dust in the galaxy. We modify the best-fit extinction model of Junkkarinen et al. (2004) by replacing the Cardelli et al. (1989) model for the galaxy with an analytical model of Pei (1992). In the first step, we modify the “Milky Way” model with parameters listed in Table 4 of Pei (1992) to match the Cardelli et al. (1989) model for and . In particular, we adopt and , and we multiply the normalization parameters by additional factors : , and . In the second step, we turn off the “FUV” component of the Pei (1992) model for the galaxy by setting . This modification affects only the observed wavelengths shorter than , the location of the feature redshifted by , and is necessary to align the FUV spectra with the optical-NIR spectra (see Figure 7). We stress that extinction at longer wavelengths is very well constrained by the clear detection of a redshifted feature by Junkkarinen et al. (2004), and thus cannot be increased. The resulting total extinction values for the Swift/UVOT filters are: W2: 2.87; M2: 2.94; W1: 2.52; U: 2.71; B: 1.84; V: 1.46. For the remaining optical and near IR filters, we use the values from Table 5 of Raiteri et al. (2005): R: 1.26; I: 0.90; J: 0.46; H: 0.28; K: 0.17. We calculate the incident flux in the band corresponding to from the observed (absorbed) flux via . The same corrections are applied to the ground-based optical data.
In addition, the source photometry is contaminated by the emission of a nearby AGN (named ELISA by Raiteri et al. (2005)). Hence, we subtracted the ELISA contribution from the observed flux densities and then corrected for the combined extinction of both galaxies, following the prescriptions given by Raiteri et al. (2005) and Raiteri et al. (2008).
Likewise, the X-ray data need to be corrected for the effect of absorption: here, the absorption effects of both our own Galaxy and the intervening system are considerable. Madejski et al. (1996) and Junkkarinen et al. (2004) argue that the absorption in the intervening system originates in material with abundances different from Galactic and, in reality, correct modeling of such absorption should take this into effect. However, as discussed by Madejski et al. (1996), the combined and spectral fitting suggests that this effect is relatively modest, the joint and data are adequately fitted by an absorbing column of cm-2 located at . Since the Swift XRT data have somewhat lower signal-to-noise ratio than the observations, we simply adopt such a “local” model for absorption, since the main objective of our observations was to determine the underlying continuum of the AO 0235+164 (catalog ) rather than the detailed spectral properties of the absorber. We note that this value is in fact consistent with the spectral fit to the Swift XRT data.
3.2 GASP-WEBT
The GLAST-AGILE Support Program (GASP) of the Whole Earth Blazar Telescope (WEBT) was initiated in 2007 with the aim of performing a long-term multi-wavelength monitoring of bright, -loud blazars (Villata et al., 2008a, 2009; D’Ammando et al., 2009; Raiteri et al., 2010). The GASP optical ( band), near-IR, and radio data are intended to complement the high-energy observations by the and Fermi (formerly ) satellites.
AO 0235+164 (catalog ) has been the target of several WEBT campaigns in the past (Raiteri et al., 2001, 2005, 2006, 2008) and it is now one of the GASP sources of highest observing priority. During the high -ray state observed in the second half of 2008, the source underwent an exceptional optical-to-radio outburst closely monitored by the GASP (Villata et al., 2008b, c; Bach et al., 2008). The GASP optical data presented here were taken at the following observatories: Abastumani, Armenzano, Calar Alto, Crimean, Kitt Peak (MDM), L’Ampolla, Lulin, Roque de los Muchachos (KVA), San Pedro Martir, St. Petersburg, Talmassons, and Tuorla. Near-IR data in the , , and bands are all from Campo Imperatore. Millimeter and centimeter radio observations were performed at the SMA (230 and 345 GHz), Noto (43 GHz), Metsähovi (37 GHz), Medicina (5, 8, and 22 GHz), and UMRAO (4.8, 8.0, and 14.5 GHz) observatories. All IR, optical, and UV data are corrected for the effects of the intervening absorber (both due to the Milky Way, and the intervening galaxy) as outlined above.
3.3 F-GAMMA
During the 2008-2009 flaring period, quasi-simultaneous multi-frequency cm/mm-band (from 2.64 GHz to 230 GHz) observations of AO 0235+164 (catalog ) were obtained using the Effelsberg 100-m and IRAM 30-m telescopes, within the framework of a Fermi related monitoring program of -ray blazars (F-GAMMA program555http://www.mpifr-bonn.mpg.de/div/vlbi/fgamma/fgamma.html, Fuhrmann et al. (2007), Angelakis et al. (2008)).
The Effelsberg measurements were conducted with the secondary focus heterodyne receivers at 2.64, 4.85, 8.35, 10.45, 14.60, 23.05, 32.00 and 43.00 GHz. The observations were performed quasi-simultaneously with cross-scans, by slewing over the source position in the azimuth and elevation directions with an adaptive number of sub-scans chosen to reach the desired sensitivity (for details, see Fuhrmann et al. 2008; Angelakis et al. 2008). Consequently, pointing offset correction, gain correction, atmospheric opacity correction and sensitivity correction have been applied to the data.
The IRAM 30-m observations were carried out with calibrated cross-scans using the single pixel heterodyne receivers B100, C150, B230 operating at 86.2, 142.3 and 228.4 GHz. The opacity corrected intensities were converted into the standard temperature scale and finally corrected for small remaining pointing offsets and systematic gain-elevation effects. The conversion to the standard flux density scale was done using the instantaneous conversion factors derived from frequently observed primary (Mars, Uranus) and secondary (W3(OH), K3-50A, NGC 7027) calibrators.
3.4 OVRO
Observations of AO 0235+164 (catalog ) at 15 GHz with the Owens Valley Radio Observatory (OVRO) 40-meter telescope were made as part of an ongoing blazar monitoring program (Richards et al., 2011). The 40-m telescope is equipped with a cooled receiver at the prime focus, with a 3.0 GHz bandwidth centered on 15.0 GHz and 2.5 GHz noise-equivalent reception bandwidth. The receiver noise temperature is about 30 K, and the total system noise temperature including CMB, atmospheric, and ground contributions is about 55 K. A dual off-axis corrugated horn feed projects two approximately Gaussian beams (157 arcsec full width half maximum, FWHM) on the sky, separated in azimuth by 12.95 arcmin. Dicke switching between the two beams is performed using the cold sky in the off-source beam as a reference, and a second level of switching is performed by alternating the source between the two beams to cancel atmospheric and ground noise. Calibration is achieved using a stable diode noise source for relative calibration and is referred to observations of 3C 286, for which we assume a flux density of 3.44 Jy (Baars et al., 1977) with about 5% absolute scale error. OVRO flux density measurements have a minimum uncertainty of 4 mJy in 32 s of on-source integration, and a typical RMS relative error of 3%.
3.5 IRAM Plateau de Bure Interferometer (PdBI)
The Plateau de Bure Interferometer (PdBI; Winters & Neri (2010)) is able to observe in three atmospheric windows located around wavelengths of 1.3 mm, 2 mm, and 3 mm. Each of these bands covers a continuous range of frequencies that are available for observations; these ranges are 201–267 GHz for the 1.3 mm band, 129–174 GHz for the 2 mm band, and 80–116 GHz for the 3 mm band.
Systematic monitoring of AGN is a by-product of regular observatory operations. The PdBI uses active galactic nuclei as phase and amplitude calibrators. Usually, one or two calibrators are measured every 20 minutes for 2 min (per source) throughout an observation. Antenna temperatures are converted into physical flux densities using empirical antenna efficiencies as conversion factors. These factors are functions of frequencies and are located in the range from 22 Jy/K (for the 3-mm band) to 37 Jy/K (for the 1.3-mm band).
The PdBI is equipped with dual linear polarization Cassegrain focus receivers. This makes it possible to observe both orthogonal polarizations – “horizontal” (H) and “vertical” (V) with respect to the antenna frame – simultaneously. Due to the hardware layout of the correlators it is not yet possible to observe all Stokes parameters. We collect linear polarization data on point sources via the Earth rotation polarimetry, i.e. we monitor the fluxes in the H and V channels as functions of parallactic angle . The source polarization is derived from the parameterization
| (3) |
Here is the fraction of linear polarization (ranging from 0 to 1) and is the polarization angle (ranging from 0∘ to 180∘ and counted from north to east). For details, please refer to Trippe et al. (2010).
3.6 Kanata
We performed the V-, J-, and Ks-band photometry and polarimetry of AO 0235+164 (catalog ) from 2008 August to 2008 October, using the TRISPEC instrument (Watanabe et al., 2005) installed at the 1.5m Kanata telescope located at the Higashi-Hiroshima Observatory. TRISPEC has a CCD and two InSb arrays, enabling photo-polarimetric observations in one optical and two NIR bands simultaneously. We obtained 21 photometric data points in the V, J, Ks bands. A unit of the polarimetric observing sequence consisted of successive exposures at 4 position angles of the half-wave plates: The data were reduced according to the standard procedure of CCD photometry. We measured the magnitudes of objects with the aperture photometry technique. We performed differential photometry with a comparison star taken in the same frame of AO 0235+164 (catalog ). Its position is R.A.=02:38:32.31, Dec=+16:35:59.7 (J2000) and its magnitudes are V = 12.720, J = 11.248 and Ks = 10.711 (Gonzalez-Perez et al., 2001; Cutri et al., 2003). The photometric data have been corrected for the Galactic extinction of A(V) = 1.473, A(J) = 0.458 and A(Ks) = 0.171, as explained in Section 3.1.
We confirmed that the instrumental polarization was smaller than 0.1% in the V band using observations of unpolarized standard stars and hence, we applied no correction for it. The zero point of the polarization angle is corrected as standard system (measured from north to east) by observing the polarized stars, HD19820 and HD25443 (Wolff, Nordsieck & Nook, 1996).
3.7 SMARTS
AO 0235+164 (catalog ) was observed at the Cerro Tololo Inter-American Observatory (CTIO) as part of a photometric monitoring campaign of bright blazars with the Small and Moderate Aperture Research Telescope System (SMARTS). The source was observed with the SMARTS 1.3m telescope and ANDICAM instrument (DePoy et al., 2003). ANDICAM is a dual-channel imager with a dichroic linked to an optical CCD and an IR imager, from which it is possible to obtain simultaneous data from 0.4 to 2.2 m. Optical and near-infrared observations were taken in B, V, R, J, and K bands.
Optical data were bias-subtracted, overscan-subtracted, and flat-fielded using the CCDPROC task in IRAF. Infrared data were sky-subtracted, flat-fielded, and dithered images were combined using in-house IRAF scripts. The raw photometry of comparison stars in the field of the blazar were calibrated using photometric zero-points that were measured from 2008-2009 observations with ANDICAM of optical (Landolt, 1992) and near-infrared (Persson et al., 1998) primary standards for each filter, correcting for atmospheric extinction derived from all the standards taken together. The averages of the comparison stars were used as a basis of differential photometry with respect to the blazar for all observations. Errors were determined by calculating the 1 variation in the magnitude of the comparison stars.
3.8 Steward Observatory
Optical spectropolarimetry and spectrophotometry of AO 0235+164 (catalog ) during fall 2008 was provided by the monitoring program being conducted at Steward Observatory (Smith et al., 2009). This program utilizes the Steward Observatory CCD Spectropolarimeter (SPOL, Schmidt et al. 1992a) at either the 2.3 m Bok telescope located on Kitt Peak, AZ, or the 1.54 m Kuiper telescope on Mt. Bigelow, AZ. The publicly available data666http://james.as.arizona.edu/~psmith/Fermi include linear polarization and flux spectra (in 1st order) spanning 4000–7550 Å. General data-taking and reduction procedures used for this project are described in detail in Smith et al. (2003) and Smith et al. (2009). For the monitoring of AO 0235+164 (catalog ), a or -wide slit was used for spectropolarimetry, depending on the observing conditions, and yielding a spectral resolution of 20–25 Å. An L-38 blocking filter was inserted into the collimated beam for all observations to prevent significant contamination from 2nd-order light until well past 7600 Å. Total exposure times of between 24 and 80 minutes were used depending on the brightness of AO 0235+164 (catalog ) and the sky/seeing conditions. Usually, a high signal-to-noise-ratio measurement () of the degree of polarization (P) is determined from each observation by taking the median linear, normalized Stokes parameters (q and u) in a 2000 Å-wide bin centered at 6000 Å. The reported values of P have been corrected for statistical bias as in Wardle & Kronberg (1973), but this correction is typically not significant because of the high of the binned data. The position angle (theta) of the optical linear polarization is calibrated by observing interstellar polarization standard stars (Schmidt et al., 1992b). Likewise, the flux spectra resulting from the spectropolarimetry are calibrated using observations of spectrophotometric standard stars (Massey et al., 1988). The flux spectra are corrected for atmospheric extinction using the the standard extinction curves given in Baldwin & Stone (1984) and Stone & Baldwin (1983). Flux information for AO 0235+164 (catalog ) was obtained through differential spectrophotometry of the blazar and a nearby field star (“Star 4”; Gonzalez-Perez et al. 2001). The spectrophotometry employed slits with widths of or to minimize seeing- and color-dependent slit losses since the SPOL slit is left fixed in an east-west orientation on the sky and is not aligned with the parallactic angle. The wide-slit spectra of AO 0235+164 (catalog ) and the comparison star were convolved with standard filter transmission curves to determine differential magnitudes and derive the apparent magnitude of the blazar in the V and R bandpasses. The spectrophotometric observations were much shorter in duration (typically min) than the spectropolarimetry, but of sufficient to be used to correct the much higher flux spectra of AO 0235+164 (catalog ) resulting from the spectropolarimetry for any slit losses associated with the narrower slits used for those measurements.
3.9 Swift XRT and UVOT
AO 0235+164 (catalog ) was monitored as a result of an approved target of opportunity (ToO) request by the Swift satellite (Gehrels et al., 2004) with weekly observations of ks performed from 2008 September 2 to 2008 December 18 (Table 3) with the X-ray Telescope (XRT; Burrows et al. 2005) and with the Ultraviolet/Optical Telescope (UVOT; Roming et al. 2005).
The XRT data were reduced with the standard software (xrtpipeline v0.12.4) applying the default filtering and screening criteria (HEADAS package, v6.9777http://heasarc.gsfc.nasa.gov/lheasoft/). We extracted the XRT light curve in the 0.3–10 keV energy band using the software tool xrtgrblc. The source events were extracted from circular regions centered on the source position. During the outburst we excluded the inner 2 pixels of the source to avoid pile-up. Exposure maps were used to account for the effects of vignetting, point-spread function losses and the presence of hot pixels and hot columns.
Since the source X-ray flux and spectrum are known to vary strongly, co-adding individual XRT observations could be misleading. We thus extracted the XRT data from each individual pointing separately, and fitted individual spectra using XSPEC. We rebinned the XRT data requiring at least 25 counts in each new energy bin. As discussed in Sec. 3.1, we assumed the combined Galactic and absorption is adequately described by a column of cm-2 at : this is in fact consistent with the spectral fit to the Swift XRT data. We determined the unabsorbed X-ray flux by performing the spectral fit with fixed absorption, and then determining the incident flux by forcing the absorption to be 0. We include those fluxes in the 2 - 10 keV band in the last column of Table 3. We note that the source was detected at a sufficiently good signal-to-noise (S/N) ratio to determine the spectrum unambiguously only in the observations on MJD54711, MJD54758, and MJD54761. In other observations, we assumed a photon index of , consistent with previous X-ray observations of this source in the low state, and note that the error resulting from such assumption on the inferred flux is comparable to the statistical error quoted in the last column of Table 3.
The UVOT photometry was done using the publicly available UVOT FTOOLS data reduction suite and is based on the UVOT photometric system described in Poole et al. (2008) - but see also Breeveld et al. (2011) for an updated calibration. As discussed above, we adopted the corrections to the observed flux due to the absorption by the Milky Way plus the intervening galaxy at as outlined in Section 3.1. The results of Swift UVOT observations are presented in the Table 4.
| Date | exposure | Photon index | F2-10keV |
|---|---|---|---|
| (MJD-54000) | (sec) | ||
| 711.4976 | 6876 | ||
| 719.8695 | 1257 | (assumed) | |
| 737.9059 | 1448 | (assumed) | |
| 747.7476 | 2123 | (assumed) | |
| 758.7420 | 1133 | ||
| 761.7541 | 1181 | ||
| 781.0545 | 1144 | (assumed) | |
| 789.5603 | 1087 | (assumed) | |
| 803.7109 | 1175 | (assumed) | |
| 818.5249 | 1210 | (assumed) |
| Date | F(v) | |||||||||||
|---|---|---|---|---|---|---|---|---|---|---|---|---|
| 711.50 | 2.32 | 1.49 | 1.04 | 0.49 | 0.43 | 0.28 | ||||||
| 719.87 | 2.69 | 1.65 | 1.39 | 0.57 | 0.59 | 0.42 | ||||||
| 729.65 | 4.76 | 3.41 | 2.46 | 1.21 | 1.20 | 0.75 | ||||||
| 737.91 | 4.26 | 3.17 | 2.51 | 0.93 | 1.03 | 0.63 | ||||||
| 740.65 | 6.18 | 4.20 | 2.77 | 1.22 | 1.30 | 0.80 | ||||||
| 747.75 | 4.76 | 3.46 | 2.45 | 1.03 | 1.23 | 0.69 | ||||||
| 758.74 | 5.95 | 3.96 | 3.18 | 1.67 | 1.66 | 0.93 | ||||||
| 761.75 | 5.33 | 3.76 | 2.79 | 1.31 | 1.40 | 0.99 | ||||||
| 768.80 | 3.30 | 2.58 | 1.47 | 1.08 | ||||||||
| 780.31 | 2.07 | 1.40 | 1.2 | 0.50 | 0.62 | 0.43 | ||||||
| 781.06 | 1.66 | 1.59 | 1.13 | 0.53 | 0.51 | 0.37 | ||||||
| 789.56 | 3.11 | 2.21 | 1.81 | 0.68 | 0.74 | 0.52 | ||||||
| 790.83 | 3.20 | 2.41 | 1.32 | 0.73 | 0.70 | 0.48 | ||||||
| 803.71 | 1.21 | 0.69 | 0.62 | 0.27 | 0.46 | 0.22 | ||||||
| 813.64 | 0.81 | 0.63 | 0.45 | 0.23 | 0.29 | 0.26 | ||||||
| 818.52 | 1.49 | 1.01 | 0.50 | 0.32 | 0.27 | 0.22 |
3.10 RXTE
As part of our campaign, 30 observations of AO 0235+164 (catalog ) were obtained with X-ray Timing Explorer () between 2008 October 18 and 2008 December 27. We analyzed the data from the Proportional Counter Array (PCA) following standard procedures. We selected only data from PCU2, the best calibrated module and the only one which is always turned on. The data were screened in the following way: source elevation above the horizon 10∘, pointing offset smaller than 0.02∘, at least 30 minutes away from a South Atlantic Anomaly passage and electron contamination smaller than 0.1. This resulted in a total exposure of 192.3 ks. Single net PCA exposures range from 2.1 ks to 14.1 ks. Background was estimated with standard procedures and the detector response matrices extracted with the tools (command PCARSO v. 10.1).
For the spectral analysis the fitting procedure was done with the XSPEC software package. The spectra from the channels corresponding to nominal energies of 2.6 to 10.5 keV are adequately fitted by a single power law model, absorbed by a fixed column of cm-2 at as determined by the ROSAT and ASCA - in an analogous manner to the spectral fitting performed to the Swift XRT data above. The parameters of the fits are reported in Table 5; again, the last column reports the unabsorbed X-ray flux.
| Date | MJD-54000 | exposure (s) | photon index | / d.o.f. | |
|---|---|---|---|---|---|
| 18/10/2008 18:56 | 757.805 | 2688 | 0.60/9 | ||
| 19/10/2008 13:35 | 758.684 | 12416 | 0.41/9 | ||
| 20/10/2008 13:09 | 759.566 | 3024 | 0.62/9 | ||
| 21/10/2008 14:16 | 760.647 | 6384 | 0.38/9 | ||
| 22/10/2008 13:53 | 761.597 | 3104 | 0.56/9 | ||
| 23/10/2008 18:08 | 762.773 | 2976 | 0.58/9 | ||
| 25/10/2008 14:08 | 764.704 | 12656 | 0.43/9 | ||
| 26/10/2008 15:13 | 765.653 | 3136 | 0.57/9 | ||
| 27/10/2008 13:09 | 766.567 | 3200 | 0.83/9 | ||
| 28/10/2008 19:01 | 767.806 | 2320 | 0.34/9 | ||
| 31/10/2008 14:32 | 770.624 | 3152 | 0.44/9 | ||
| 02/11/2008 17:03 | 772.850 | 14448 | 0.29/9 | ||
| 03/11/2008 13:07 | 773.566 | 3200 | 0.55/9 | ||
| 04/11/2008 19:11 | 774.880 | 9072 | 0.34/9 | ||
| 05/11/2008 18:34 | 775.858 | 9680 | 0.48/9 | ||
| 06/11/2008 18:07 | 776.774 | 3200 | 0.59/9 | ||
| 07/11/2008 14:32 | 777.723 | 12992 | 0.45/9 | ||
| 10/11/2008 16:07 | 780.696 | 2880 | 0.79/9 | ||
| 11/11/2008 11:11 | 781.486 | 3264 | 1.40/9 | ||
| 13/11/2008 11:53 | 783.613 | 13168 | 0.39/9 | ||
| 14/11/2008 12:56 | 784.625 | 9888 | 0.59/9 | ||
| 15/11/2008 11:00 | 785.543 | 9904 | 0.63/9 | ||
| 17/11/2008 10:09 | 787.474 | 6336 | 0.46/9 | ||
| 19/11/2008 09:10 | 789.429 | 5568 | 0.81/9 | ||
| 20/11/2008 07:10 | 790.411 | 12192 | 0.34/9 | ||
| 21/11/2008 16:48 | 791.366 | 9744 | 0.39/9 | ||
| 23/11/2008 10:33 | 793.492 | 6432 | 0.42/9 | ||
| 27/12/2008 14:06 | 827.672 | 9664 | 0.40/9 |
4 Variability of the Source
4.1 Multi-wavelength Light Curve
In this section we present the results of the multi-wavelength observations conducted on AO 0235+164 (catalog ) from 2008 August to 2009 January. Figure 3 shows the multi-wavelength data available. From the top to the bottom are: radio, near-infrared, optical, polarization degree () and polarization angle (deg), UV, X-ray and -ray from 100 MeV to 100 GeV data are grouped together.
The optical behavior is the best sampled among all. Two main flare peaks are visible in the period around 2008 October (MJD 54730-54750), and they are surrounded by other smaller peaks. The radio data show that the flux started to increase smoothly starting around the middle of 2007 (MJD 54500, which is apparent in Figure 4), reaching its maximum during the optical flare activity and slowly decreasing when the source returned to a low flux state in near IR, optical, X-ray and -ray bands. The near infrared data show the same temporal trend as the optical bands. The UV data from Swift UVOT do not show the level of activity seen in the optical band. The X-ray data from Swift XRT and RXTE present a very pronounced peak clearly delayed with respect to the optical activity.
The Fermi light curve, as already discussed in section 2.1 shows a broad high-state period followed by a final narrow peak succeeding the X-ray peak before getting to the low-flux state. Since then (up to the time of submitting this paper in autumn 2011), the source has been in a very quiet state.
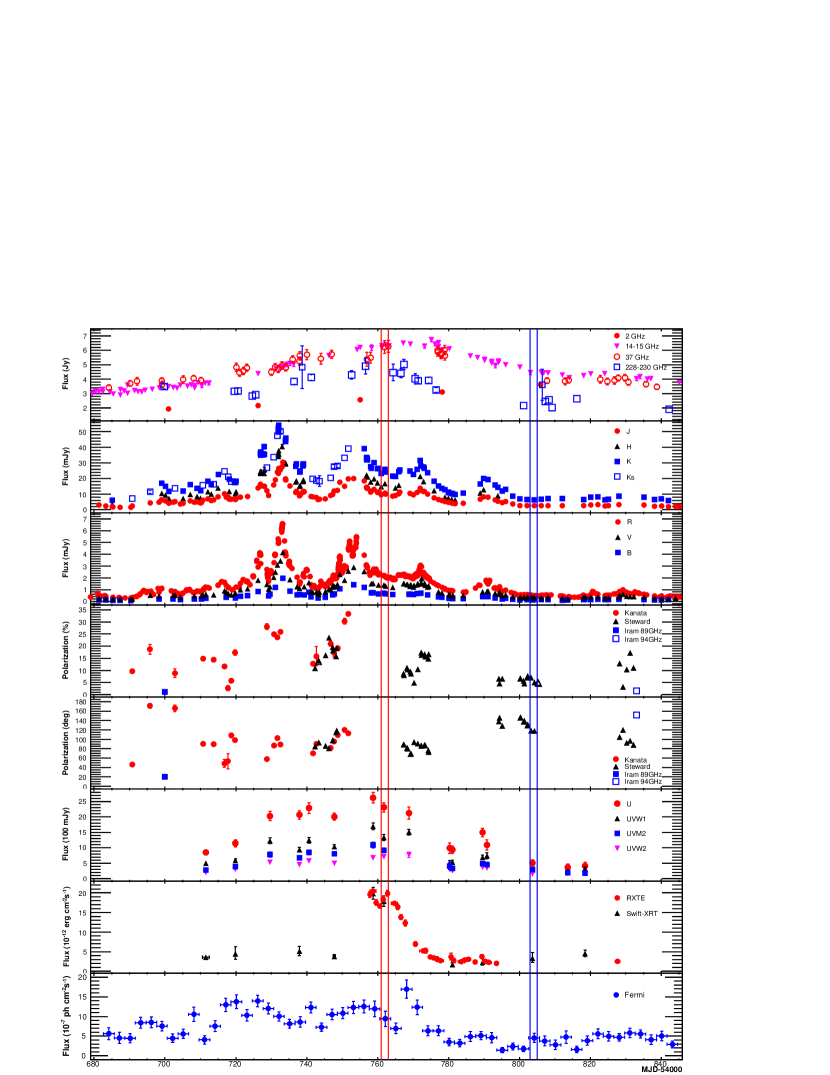
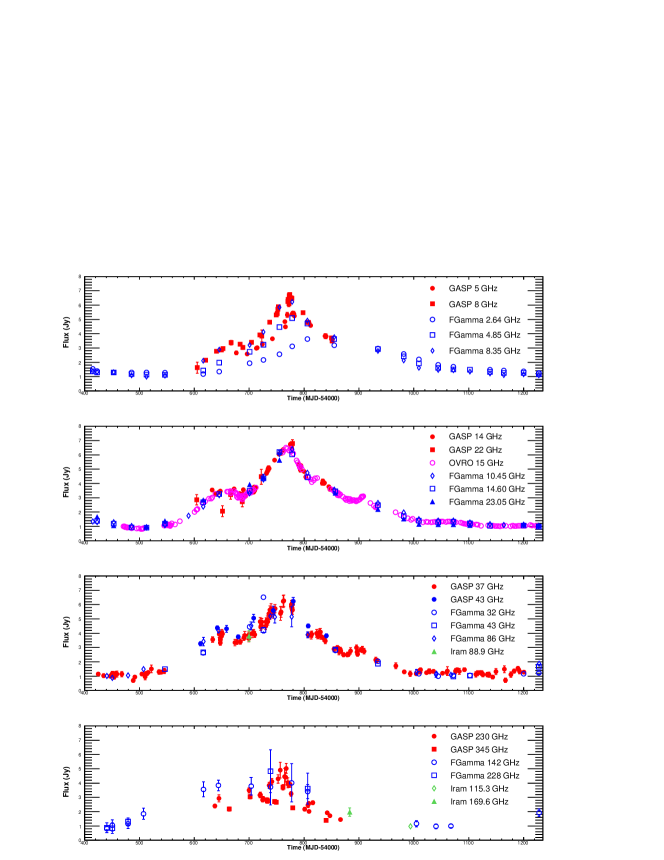
Figure 4 shows the light curves constructed from the radio, mm and sub-mm data in an extended time interval, from 2007 to 2010 June (MJD 54400-55230). In the lowest-energy-band, the increasing trend of the flux started months before the increased level of activity seen in the optical and higher energy bands. After the period of the increased radio/mm flux associated with the optical flaring activity, the source enters a period of gradually declining flux.
4.2 Cross-correlation studies and time delays
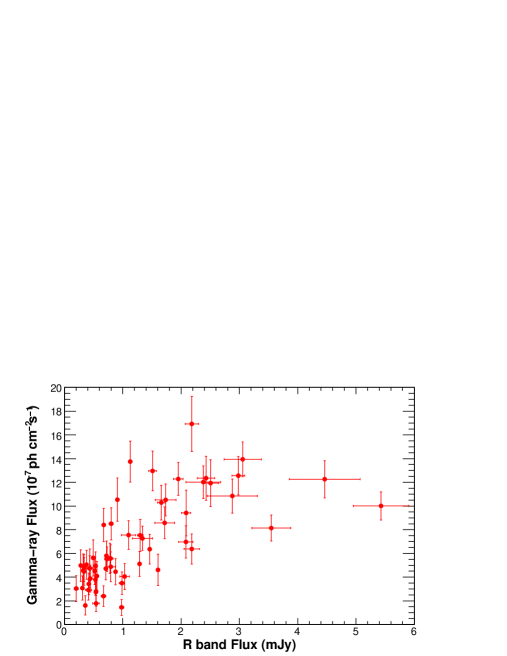
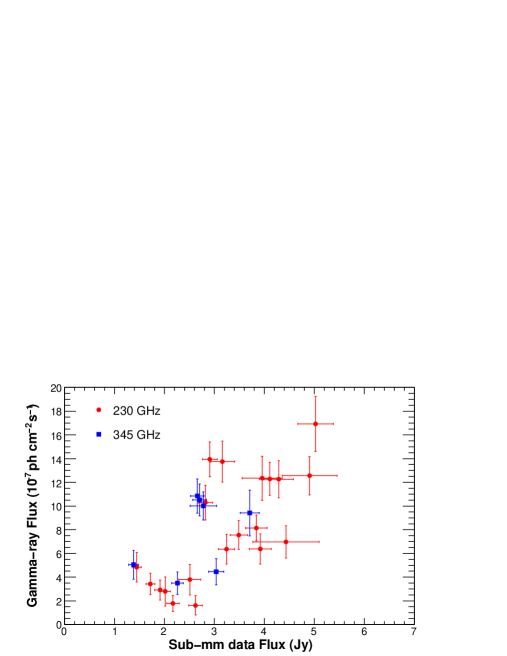
We searched for correlations of variability between different bands, with the goal to understand the relationship between the fluxes of AO 0235+164 (catalog ) at different energies. The cross-correlation studies between the optical R band and -ray fluxes are illustrated in the the top panel of Figure 5. Those data have a Spearman correlation coefficient888Wessa, P. (2011), Free Statistics Software, Office for Research Development and Education, version 1.1.23-r7, http://www.wessa.net/ of 0.75 (Spearman, 1904). The relations between the -ray and 230 GHz and 345 GHz fluxes have also been evaluated and the results are shown in Figure 5 in the bottom panel: the Spearman correlation coefficient between -ray fluxes and 230 GHz data is 0.70 showing that there exists a correlation between the two data sets. On the other hand, the sampling at 345 GHz is poor, with only a few data points at that frequency and the evaluation of a correlation has not been performed. In all cases, no correlation is found at 90 confidence level. We note here that Agudo et al. (2011b), using data collected for this object over a longer time span than that covered by our observations, performed a light-curve correlation analysis following the method described by Agudo et al. (2011a). They found that these bands are correlated at a 99.7% confidence level. In our case, no correlation is found at 90% confidence level: it is very likely that the stronger correlation of signals derived by Agudo et al. (2011b) is caused by their use of a significantly longer time span, amounting to roughly 8 years. All this suggests that the variability of the source in the -ray and radio-to-mm regimes on long time scales is correlated, but the situation on shorter time scales is less clear.
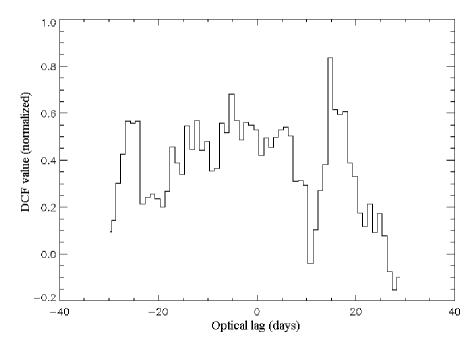
Since the time series in the optical R band and -ray are the best sampled in this study, it was possible to calculate lags/leads between those bands. To this end, we calculated the discrete correlation function (DCF, Edelson & Krolik 1988). We binned the data sets in order to smooth the intra-day features in the optical light curves, and to obtain similar sampling in the -ray band. We tried several bin sizes from 1 to 7 days to check how sensitive the results are to this smoothing procedure. The DCF from the optical and -ray data do not show significant peaks on short time scales (1 day) meaning no optical- correlation is detected over the observing period. Figure 6 shows the result of this DCF analysis when the light curves are binned over 1 day. A peak can be seen at 15 days (with optical lagging -rays), however the significance is modest. Agudo et al. (2011b) found that, for a similar period, the optical flux lags the -rays by days, but their DCF peak is much broader, and could be interpreted as being consistent with no lag.
4.3 Time dependence of optical polarization
As illustrated in Figure 3, the polarization degree and angle are highly variable; the former correlates with the optical flux and at the two largest flux peaks reaches values 25% and 35%, respectively. This correlation was studied over a longer period of time (from 2008 August 12 to 2009 February 18) by Sasada et al. (2011), and in the past, during the outburst of 2006 December, by Hagen-Thorn et al. (2008). A trend of the stabilization of the polarization angle during flares is seen both in 2006 and 2008, but around different values, with electric vector polarization angle (EVPA) at and respectively. Comparing EVPA with the position angle of the parsec-scale jets, Hagen-Thorn et al. (2008) found that there is a trend of their alignment during high states. However, since the parsec-scale jet in AO 0235+164 (catalog ) shows large changes of direction with time (Jones et al., 1984; Chu et al., 1996; Jorstad et al., 2001; Piner et al., 2006) and the jet direction to which EVPA was compared was inferred from the VLBI maps taken in different epochs, the claimed alignment could be accidental. Indeed, comparison of EVPA during flux peaks in 2008 with the direction of the jet determined during the same epoch by VLBI observations does not confirm such an alignment (Agudo et al., 2011b). On the contrary, both angles are oriented perpendicular rather than parallel to each other, albeit with a large scatter, with EVPA at optical flux peaks vs. . This implies a parallel orientation of the magnetic fields to the jet and may indicate production of flares in a reconfinement shock (Nalewajko, 2009).
5 Broad-band Spectral Energy Distribution
Our unprecedented time sampling of AO 0235+164 (catalog ) in several spectral bands allows us to extract accurate instantaneous SEDs, which are needed to correctly interpret the broad-band emission of the source. We reiterate that in order to build the intrinsic SED and correctly convert the observed magnitudes to de-absorbed fluxes, extinction must be taken into account, including both Galactic extinction, and that due to the system. We discussed in Section 3.1 how the IR, optical, UV data and soft X-rays are affected by the absorption due to both systems. Following the prescriptions from Junkkarinen et al. (2004), we assume that the soft X-ray absorption is adequately described by a column density of at . However, for the far-UV data, we use a modified extinction model based on the work of Pei (1992).
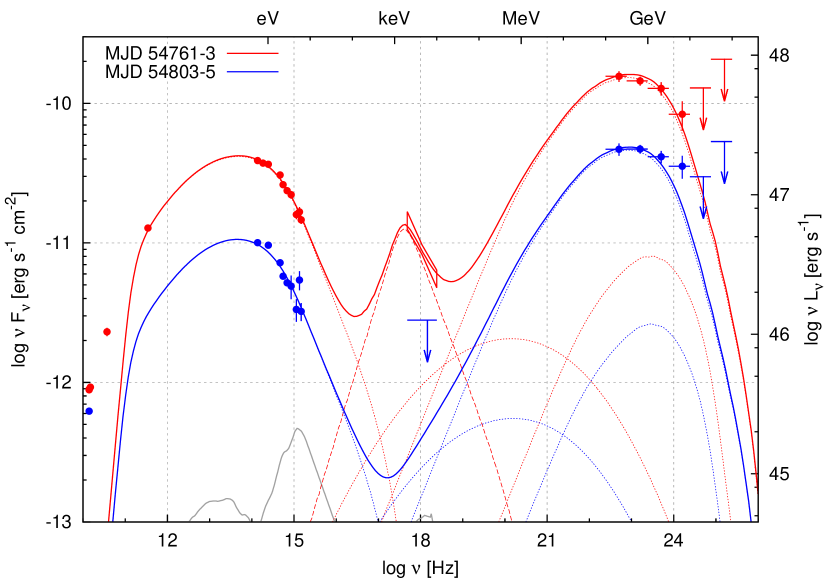
Figure 7 shows the broad-band SEDs obtained by plotting simultaneous radio, NIR, optical, UV, X-ray data in the following two 2-day epochs:
-
1.
MJD 54761–54763 (shown in red), corresponding to the maximum of the X-ray flare, coincident with a highly variable near-IR/optical/UV state and a high -ray state.
-
2.
MJD 54803–54805 (shown in blue), corresponding to a low state in all bands, following the high-activity period.
The plotted data points were extracted from the larger datasets as follows:
-
-
Radio data: most of the data points are simultaneous measurements. Although the sampling at some particular wavelengths is poor, the available radio light curves show very smooth and slow trends, thus we have also plotted interpolated values based on the extended data set of about 10 days in length, centered on the main observation period.
-
-
Near-IR/optical/UV: all the data shown are simultaneous measurements made by GASP-WEBT, SMARTS and Swift UVOT telescopes.
-
-
X-ray data: in the first epoch (MJD 54761–54763), we present the Swift XRT observation with a butterfly plot. In the second epoch (MJD 54803–54805), the for the Swift XRT measurement is too low to allow a good spectral representation and only the flux upper limit is reported.
-
-
-ray data: the -ray spectra have been built following the analysis procedure described in Section 2.2. Since the time intervals chosen to build the broad-band SED are too short to allow a good reconstruction of the -ray spectrum, longer periods have been used. The first time interval, MJD 54750–54770, corresponds to a period of high -ray emission, which includes the X-ray flare period. The high state is followed by a lower emission state whose spectrum is averaged in the interval MJD 54780–54840.
The overall SED, plotted in Figure 7, appears quite similar to that measured for other blazars. There is one marked difference: at least for the first period, the X-ray spectrum is soft, yet it is not located on the extrapolation of the optical/UV spectrum. For this to be the case, extinction would have to be significantly greater, with the error at the level of at least 50%, which we consider unlikely. Assuming that we adopted the correct extinction, the broad-band SED does show a distinct feature in the soft X-ray band, separate from the two broad peaks forming the SED in most blazars, and we discuss its origin below.
6 Modeling of the Broad-Band Spectrum
AO 0235+164 (catalog ), like many other luminous, low-frequency-peaked BL Lac objects, shows broad emission lines (Cohen et al., 1987; Nilsson et al., 1996; Raiteri et al., 2007). Using the emission-line spectrum reported in Raiteri et al. (2007), correcting the line flux for extinction, and assuming that the contribution of the lines measured by them to the total luminosity of broad emission lines (BEL) is the same as in the composite spectrum of quasars (Francis et al., 1991), we find . For the typical covering factor of the broad-line region (BLR) this implies a luminosity of the accretion disk of . With such a high accretion luminosity, if observed directly, i.e. without being overshone by the jet nonthermal radiation, AO 0235+164 (catalog ) would satisfy a formal criterion to be classified as a quasar (see also Murphy et al., 1993). This means that, according the the AGN unification models, it should possess a typical dusty torus, a strong source of thermal infrared radiation (IR) with a typical covering factor of (e.g., Haas et al., 2004). Recent mid-IR interferometric observations for a sample of nearby AGN show that such tori can extend beyond 10 pc from the central black hole (Tristram & Schartmann, 2011). The mass of the black hole (BH) in this object is likely to be in the range (Liu et al., 2006; Raiteri et al., 2007; Wu et al., 2010), which implies the Eddington ratio .
In order to determine which process dominates the high-energy emission, whether it is ERC or SSC, one can estimate their luminosity ratio as , where is the co-moving energy density of the external radiation, which depending on the source location could be dominated either by or , and is the co-moving energy density of the synchrotron radiation. These energy densities scale like for , respectively, and , where is the characteristic radius of the broad-line region, is the inner radius of the dusty torus, is the emitting zone radius related to its distance by , is the jet Lorentz factor and is the jet velocity in units of (Sikora et al., 2009). Considering the emitting zone located at either characteristic radius, i.e. , and neglecting the distinction between the Doppler factor and the Lorentz factor , we obtain . In the case of AO 0235+164 (catalog ), we observe and thus . Hence, even for a moderate bulk Lorentz factor, in order for the SSC component to dominate the ERC component, one requires covering factors 2 orders of magnitude lower than typically assumed in quasars.
In this Section, we verify the ERC scenario by fitting the observed SEDs with one-zone leptonic models (Moderski et al., 2003). We follow the evolution of relativistic electrons injected into a thin spherical shell propagating conically with a constant Lorentz factor undergoing adiabatic and radiative losses due to the synchrotron and inverse-Compton emission. The external radiation includes broad emission lines of characteristic photon energy and infrared dust radiation of characteristic energy . We attempted to fit the high state of MJD 54761-3 with a ’blazar zone’ located either within (ERCBEL model) or outside the BLR (ERCIR model). In the ERCBEL model, the electron break inferred from the synchrotron spectrum is too low to reproduce the -ray spectrum above GeV. This problem is absent in the ERCIR model (red lines in Figure 7). This is because Comptonization of IR photons is subject to much weaker Klein-Nishina suppression in the GeV band than Comptonization of optical/UV emission-line photons. The parameters of the ERCIR model are: location , Lorentz factor , opening angle (hence the Doppler factor ), magnetic field strength , viewing angle . Electrons are injected with a doubly-broken energy distribution with , , , , .
The rate of electron energy injection is . Over co-moving time , the total injected electron energy is . At the end of the injection the total number of electrons is and their total energy in the co-moving frame . The average efficiency of electron energy losses is . The electron flux is , where is the volume of the emitting region in the co-moving frame and is the jet radius. The electron energy flux is and the proton energy flux is , where is the total number of protons and is the lepton-to-proton number ratio. The magnetic energy flux is . The resulting jet magnetization parameter is , and the radiative efficiency is , where is the observed bolometric luminosity of the source. The relation between the jet power and accretion disk luminosity is . Parameterizing the jet production efficiency by and the radiative efficiency of the accretion disk , where is the accretion rate, we obtain . For and , we have and hence and . We are thus able to match the jet power with the accretion power onto the central black hole, adopting a reasonably low jet magnetization, which allows formation of strong shock waves. The ratio of electrons to protons is consistent with the results of Sikora & Madejski (2000). This model predicts the observed variability time scale days, consistent with the time scale of the significant variations of the optical and -ray flux.
As we noted above, the X-ray spectrum, at least during the first of the two epochs considered here, is too soft to be interpreted as an SSC component and cannot be the high-energy tail of the synchrotron component since it does not lie on the extrapolation of the optical-UV spectrum (but see the caveats above, related to the corrections for extinction). Instead, it can be explained by Comptonization of external radiation by a population of relatively cold electrons (Begelman & Sikora, 1987; Ravasio et al., 2003). Such bulk Compton radiation is expected to be produced in a jet much closer to the black hole than the nonthermal blazar radiation, at distances at which cooling of even mildly relativistic electrons is very efficient. There the jet is still in the acceleration phase and, therefore, its bulk Lorentz factor is expected to be smaller than in the blazar zone. But noting that according to magnetohydrodynamical models the acceleration process is very smooth (see, e.g., Komissarov et al. 2007) and that the bulk Compton radiation must be significantly Doppler boosted to be visible in the blazar spectra, the dominant contribution to bulk-Compton radiation is expected to be produced at distances which are already well separated from the base of the jet (Sikora et al., 2005; Celotti et al., 2007). We consider a stationary emitting region at characteristic radius , where is the gravitational radius of the central black hole of mass . The bulk Lorentz factor is and the Doppler factor is . Bulk-Compton luminosity is given by the approximate formula
| (4) |
where is the number of electrons enclosed in the portion of a jet, is the rate of production of Compton radiation by a single electron, and is the energy density of external radiation field, which at distances is very likely to be dominated by rescattering of disk radiation by electrons in the accretion disk corona of covering factor . The energy spectrum of the external radiation is approximated by a broken power-law distribution with , and (Richards et al., 2006; Shang et al., 2011). The electron flux is . Assuming that it matches the electron flux in the blazar zone (), we calculate the total number of electrons producing the bulk-Compton component to be . We find that the X-ray spectrum of luminosity can be reproduced with cold electrons for .
Multi-wavelength light curves show that X-rays do not correlate with radiation in other spectral bands. This suggests that X-ray variability of the bulk-Compton radiation can be caused by local wiggling of the jet, e.g. caused by variations of the average direction of non-axisymmetric outflows generated near the BH. Jet wiggling can also explain independent variability in the blazar zone. We have fitted the low state (MJD 54803-5) with an ERCIR model (blue lines in Figure 7) very similar to the one for the high state, changing only the viewing angle, from to , and the magnetic field strength, from to . With the new viewing angle, the observer is placed outside the jet opening cone and the observed luminosity decreases due to a lower effective Doppler factor. The change in the magnetic field strength reduces the synchrotron luminosity by relative to the ERC luminosity. The overall spectral shape is matched without any adjustment in the electron energy distribution.
7 Discussion
Multi-wavelength observations of blazars, including AO 0235+164 (catalog ), show that events associated with periods of greater activity occur over the entire electromagnetic spectrum, from radio to -rays. Light curves taken in different spectral bands correlate on time scales longer than a month, while on shorter time scales correlations are weaker and some lags are claimed. In particular, monthly lags of the radio signals following the -rays are observed (Pushkarev et al., 2010). This is interpreted in terms of the synchrotron opacity at radio frequencies and indicates that -rays are produced at distances from the BH that are several parsecs smaller than the position of the radio cores. Whether -ray emission is smoothly distributed over several decades of distance (Blandford & Levinson, 1995), or is associated with specific locations of energy dissipation in a jet, is still debated. The localized dissipation zones could be related to: reconnection of magnetic fields which may operate efficiently at distances , where the magnetization parameter is expected to be large (Nalewajko et al., 2011); internal shocks resulting from collisions between the jet portions moving with different velocities (Spada et al., 2001), which become efficient at distances at which drops below ; oblique/reconfinement shocks which are formed at distances at which interactions of a supersonic jets start to feel the influence of the external medium (Hughes et al., 2011; Daly & Marscher, 1988; Komissarov & Falle, 1997; Nalewajko & Sikora, 2009).
Using the SED of AO 0235+164 (catalog ), we showed in Section 6 that the spectrum of this object can be reproduced using a model where the dissipation takes place at a distance of from the BH and production of -rays is dominated by Comptonization of NIR radiation of hot dust. The activity of AO 0235+164 (catalog ) during the same epoch was analyzed independently by Agudo et al. (2011b). They included the VLBI imaging data, and concluded that the -ray emission zone is associated with the 7 mm radio core (i.e. at from the BH) and propose that production of -rays is dominated by a turbulent multi-zone SSC process. We comment on these differences below, noting that we perform detailed modelling of the broad-band spectrum of the object.
As the long term radio light curves of AO 0235+164 (catalog ) indicate, the active season in 2008 started about 200 days before reaching the maximum. During this period of time any portion of the jet propagates over a distance of tens of parsecs, i.e. much larger than the length of a ’blazar zone’ inferred from the time scales of the short term flares. Such flares are very likely to be produced by inhomogeneities of the flow, radiating when passing through the region where energy dissipation is intensified. Particularly prominent flares are seen in the optical light curves. Their -day time scales imply that the extension of the dissipative zone is
| (5) |
which nicely corresponds with the location of the blazar zone derived from our model. In order to form such flares at a distance of , a Lorentz factor of is required. Interestingly, a similarly large Lorentz factor is required in the Agudo et al. (2011b) model to explain the observed -day time scale of the flux decay at . This can be inferred by taking into account that radiative cooling of electrons emitting at 1 mm is inefficient and that the time scale of the flux decrease, as determined by the adiabatic losses, is . VLBI observations of AO 0235+164 (catalog ) do not exclude such a large value of the bulk Lorentz factor (Jorstad et al., 2001; Piner et al., 2006).
Finally we comment about the objections made by Agudo et al. (2011b) regarding the application of ERC models for the production of rays in AO 0235+164 (catalog ). They pointed out that in this model it is impossible to explain the lack of correlation between short-term variations of the -ray and optical fluxes because of a lack of variations of the external radiation field. However, in the fast cooling regime, variations of the inverse-Compton flux are determined not by variations of the seed radiation field but by variations of the electron injection function. It does not matter whether the seed radiation is external or internal, so this criticism may also be applied to the SSC models. Hence, the lack of a clear correspondence between variations in these two spectral bands must have a different origin than fluctuations in the background radiation. They can be related to variations of the Doppler factor and magnetic fields in the kinematically and geometrically complex dissipative zone. In particular, this can be the case if such a zone is associated with the oblique and/or reconfinement shocks, which in AO 0235+164 (catalog ) is indicated by roughly perpendicular orientation of the optical EVPA with respect to the jet axis (see Section 4.3).
8 Conclusions
Fermi-LAT detected enhanced activity in the high-redshift BL Lac object AO 0235+164 (catalog ) during the first 6 months of operations. We present the results of an intensive multi-wavelength campaign covering radio, mm, near-IR, optical, UV and X-ray bands, as well as optical polarimetry. Extinction in the optical/UV/X-ray band, complicated by the existence of an additional absorbing system at intermediate redshift, has been carefully taken into account. We proposed a modification to the extinction model introduced by Junkkarinen et al. (2004) and used by Raiteri et al. (2005) that corrects a spurious spectral feature in the FUV band.
The -ray spectrum is consistent with a broken power-law. Hints of spectral variability can be seen in episodic increases of the (1-100 GeV)/(0.1-1 GeV) hardness ratio. The brightest -ray flare is much more pronounced in the 0.1-1 GeV energy band.
The -ray activity is roughly correlated with the activity in the optical/near-IR band. There is a possible delay of 15 days of the R-band flux with respect to the -ray flux. The optical flux is also correlated with the optical polarization degree, which reaches values up to 35%. At the same time, the optical polarization angle is close to with moderate scatter. As is typical for blazars, the activity in the radio band is smoother and begins months before the optical/-ray activity, while the radio-flux peaks are delayed by several weeks with respect to the higher energy bands.
The behavior of the source in the X-ray band is distinct from other bands, as it shows a 20-day high state delayed by a month from the main optical/-ray flare. The X-ray spectrum during the high state is unusually soft, , and is inconsistent with the extrapolation of the optical/UV spectrum, unless we assume a much stronger extinction. We interpret this X-ray component as the bulk-Compton emission, i.e. Comptonization of the accretion-disk radiation reprocessed at the distance of , in the region of ongoing jet acceleration and collimation. Such a feature has been tentatively reported before in a few sources, however the present case is still not definitive. The short duration of the high X-ray state can be explained by a rapid “wiggling” of the inner jet.
The broad-band SEDs extracted for two different activity states are, with the exception of the X-ray feature, typical for luminous blazars. We interpret the broad-band SEDs in the standard leptonic scenario, with the low-energy bump due to synchrotron radiation and the high-energy bump due to Comptonization of the external infrared radiation from the dusty torus (ERCIR). The energetic constraints are very tight, because, if the jet power is comparable to the Eddington luminosity of the central black hole, the required radiative efficiency of the jet is , the magnetization is and the pair-to-proton ratio is . The bulk Compton feature in the high X-ray state requires, if the electron number flux is to be matched to the model of the flaring state, a covering factor of the accretion disk corona . An alternative interpretation of the high-energy bump with the SSC emission requires a very low covering factor for the dusty torus, in conflict with the observations of quasars.
References
- Abdo et al. (2009) Abdo, A. A., et al. 2009, ApJS, 183, 46
- Abdo et al. (2010a) Abdo, A. A., et al. 2010a, ApJS, 188, 405
- Abdo et al. (2010b) Abdo, A. A., et al. 2010b, ApJ, 710, 1271
- Agudo et al. (2011a) Agudo, I., et al. 2011a, ApJ, 726, L13
- Agudo et al. (2011b) Agudo, I., Marscher, A. P., Jorstad, S. G., Larionov, V. M., et al. 2011b, ApJ, 735, L10
- Angelakis et al. (2008) Angelakis, E., Fuhrmann, L., Marchili, N., Krichbaum, T. P. & Zensus, J. A. 2008, arXiv:0809.3912
- Atwood et al. (2009) Atwood, W. B., et al. 2009, ApJ, 697, 1071
- Baars et al. (1977) Baars, J. W. M., et al. 1977, A&A, 61, 99
- Bach et al. (2008) Bach, U., et al. 2008, ATel 1849
- Baldwin & Stone (1984) Baldwin, J.A. & Stone, R.P.S. 1984, MNRAS, 206, 241
- Begelman & Sikora (1987) Begelman, M.C. & Sikora, M. 1987, ApJ, 322, 650
- Blandford & Rees (1978) Blandford, R. D. & Rees, M. J. 1978, “Pittsburgh Conference on BL Lac Objects”, ed. A. M. Wolfe, p.328, Univ. Pittsburgh Press
- Blandford & Levinson (1995) Blandford, R. D. & Leninson, A. 1995, ApJ, 441, 79
- Böttcher (2007) Böttcher, M. 2007, Ap&SS, 309, 95
- Breeveld et al. (2011) Breeveld, A. A. 2011, arXiv:1102.4717
- Burbidge et al. (1976) Burbidge, E. M., Caldwell, R. D., Smith, H. E., Liebert, J. & Spinrad H. 1976, ApJ205, L117
- Burrows et al. (2005) Burrows, D. N., et al. 2005, Space Sci. Rev., 120, 165
- Cardelli et al. (1989) Cardelli, J. A., Clayton, G. C., & Mathis, J. S. 1989, ApJ, 345, 245
- Celotti et al. (2007) Celotti, A., Ghisellini, G. & Fabian, A. C. 2007, MNRAS, 375, 417
- Chu et al. (1996) Chu, H. S., Baath, L. B., Rantakyro, F. T., et al. 1996, A&A, 307, 15
- Cohen et al. (1987) Cohen, R. D., Smith, H. E., Junkkarinen, V. T., et al. 1987, ApJ, 318, 577
- Comastri et al. (1997) Comastri, A., Fossati, G., Ghisellini, G. & Molendi S., 1997, ApJ, 480, 534
- Corbel & Reyes (2008) Corbel, S. & Reyes, L.C. 2008, ATel 1744
- Corbett et al. (2000) Corbett, E. A., et al. 2000, MNRAS, 311, 485
- Cutri et al. (2003) Cutri, R. M., et al. 2003, VizieR On-line Data Catalog, ADS : http://adsabs.harvard.edu/abs/2003yCat.2246….0C
- Daly & Marscher (1988) Daly, R. A. & Marscher, A. P. 1988, ApJ, 334, 539
- DePoy et al. (2003) DePoy, D. L., Atwood, B., Belville, S. R., Brewer, D. F., Byard, P. L., Gould, A., Mason, J. A., O’Brien, T. P., Pappalardo, D. P., Pogge, R. W., Steinbrecher, D. P. & Teiga, E. J. 2003, in Society of Photo-Optical Instrumentation Engineers (SPIE) Conference Series, Vol. 4841, Society of Photo-Optical Instrumentation Engineers (SPIE) Conference Series, ed. M. Iye & A. F. M. Moorwood, 827–838
- D’Ammando et al. (2009) D’Ammando, F., et al. 2009, A&A, 508, 181
- Edelson & Krolik (1988) Edelson, R.A. & Krolik, J.H., 1988, ApJ, 333, 646
- Elvis et al. (1994) Elvis, M., et al. 1994 ApJS, vol. 95, no. 1, p. 1-68
- Foschini et al. (2008) Foschini, L., Iafrate, G., Longo, F. 2008, ATel 1784
- Francis et al. (1991) Francis, P. J., Hewett, P. C., Foltz, C. B., et al. 1991, ApJ, 373, 465
- Fuhrmann et al. (2007) Fuhrmann, L., Zensus, J. A., Krichbaum, T. P., Angelakis, E. & Readhead, A. C. S. 2007, The First GLAST Symposium, 921, 249
- Fuhrmann et al. (2008) Fuhrmann, L., et al. 2008, A&A, 490, 1019
- Gehrels et al. (2004) Gehrels, N., et al. 2004, ApJ, 611, 1005
- Ghosh & Soundararajaperumal (1995) Ghosh, K.K. & Soundararajaperumal S. 1995, ApJS, 100, 37
- Gonzalez-Perez et al. (2001) Gonzalez-Perez, J. N., Kidger, M. R. & Martin-Luis, F. 2001, AJ, 122, 2055
- Haas et al. (2004) Haas, M., Müller, S. A. H., Bertoldi, F., et al. 2004, A&A, 424, 531
- Hagen-Thorn et al. (2008) Hagen-Thorn, V. A., Larionov, V. M., Jorstad, S. G. et al. 2008, ApJ, 672, 40
- Hughes et al. (2011) Hughes, P. A., Aller, M. F. & Aller, H. D. 2011, ApJ, 735, 81
- Hunter et al. (1993) Hunter, S.D., et al. 1993, ApJ, 409, 134
- Jones et al. (1984) Jones, D. L., Unwin, S. C., Baath, L. B. & Davis, M. M. 1984, ApJ, 284, 60
- Jorstad et al. (2001) Jorstad, S. G., Marscher, A. P., Mattox, J. R., et al 2001, ApJS, 134, 181
- Junkkarinen et al. (2004) Junkkarinen, V. T., Cohen, R. D., Beaver, E. A., et al. 2004, ApJ, 614, 658
- Komissarov & Falle (1997) Komissarov, S. S. & Falle, S. A. E. G. 1997, MNRAS, 288, 833
- Komissarov et al. (2007) Komissarov, S. S., Barkov, M. V., Vlahakis, N. & Königl, A. 2007, MNRAS, 380, 51
- Landolt (1992) Landolt, A. U. 1992, ApJ, 104, 340
- Levinson (2006) Levinson, A. 2006, International Journal of Modern Physics A, 21, 6015
- Liu et al. (2006) Liu, F.K., Zhao, G. & Wu, X.-B. 2006, ApJ, 650, 749
- Madejski et al. (1996) Madejski, G., Takahashi, T., Tashiro, M., et al. 1996, ApJ, 459, 156
- Massey et al. (1988) Massey, P., Strobel, K., Barnes, J. V. & Anderson, E. 1988, ApJ, 328, 315
- Mattox et al. (1996) Mattox, J. L., et al. 1996, ApJ, 461, 691
- Moderski et al. (2003) Moderski, R., Sikora, M. & Błażejowski, M. 2003, A&A, 406, 855
- Murphy et al. (1993) Murphy, D. W., Browne, I. W. A. & Perley, R. A. 1993, MNRAS, 264, 298
- Nalewajko (2009) Nalewajko, K., 2009, MNRAS, 395, 524
- Nalewajko et al. (2011) Nalewajko, K., Giannios, D., Begelman, M.C., et al. 2011, MNRAS, 413, 333
- Nalewajko & Sikora (2009) Nalewajko, K. & Sikora, M. 2009, MNRAS, 392, 1205
- Nilsson et al. (1996) Nilsson, K., Charles, P.A., Pursimo, T., et al. 1996, A&A, 314, 754
- Padovani et al. (2004) Padovani, P., Costamante, L., Giommi, P., et al. 2004, MNRAS, 347, 1282
- Pei (1992) Pei, Y. C. 1992, ApJ, 395, 130
- Persson et al. (1998) Persson, S. E., Murphy, D. C., Krzeminski, W., Roth, M. & Rieke, M. J. 1998, AJ, 116, 2475
- Piner et al. (2006) Piner, B. D., Bhattarai, D., Edwards, P. G. & Jones, D. L. 2006, ApJ, 640, 196
- Poole et al. (2008) Poole, T. S., et al. 2008, MNRAS, 383, 627
- Pushkarev et al. (2010) Pushkarev, A. B., Kovalev, Y. Y. & Lister, M. L. 2010, ApJ, 722, L7
- Raiteri et al. (2001) Raiteri, C. M., et al. 2001, A&A, 377, 396
- Raiteri et al. (2005) Raiteri, C. M., et al. 2005, A&A, 438, 39
- Raiteri et al. (2006) Raiteri, C. M., et al. 2006, A&A, 459, 731
- Raiteri et al. (2007) Raiteri, C. M., Villata, M., Capetti, A., et al. 2007, A&A, 464, 871
- Raiteri et al. (2008) Raiteri, C. M., et al. 2008, A&A, 480, 339
- Raiteri et al. (2010) Raiteri, C. M., et al. 2010, A&A, 524, A43
- Ravasio et al. (2003) Ravasio, M., Tagliaferri, G., Ghisellini, G., et al. 2003, A&A, 408, 479
- Richards et al. (2006) Richards, G. T., et al. 2006, ApJS, 166, 470
- Richards et al. (2011) Richards, J., et al., 2011, arXiv:1011.3111 (submitted to ApJS)
- Rieke et al. (1976) Rieke, G. H., Grasdalen, G. L., Kinman, T. D., et al. 1976, Nature, 260, 754
- Roberts (1976) Roberts, M. S., Brown, R. L., Brundage, W. D., Rots, A. H., Haynes, M. P. & Wolfe, A. M. 1976, AJ, 81, 293
- Roming et al. (2005) Roming, P. W. A., et al. 2005, Space Sci. Rev., 120, 95
- Sasada et al. (2011) Sasada, M., Uemura, M., Fukazawa, Y., et al. 2011, PASJ, 63, 489
- Schlegel, Finkbeiner & Davis (1998) Schlegel, D. J., Finkbeiner, D. P. & Davis, M. 1998, ApJS, 500, 525
- Schmidt et al. (1992a) Schmidt, G. D., Stockman, H. S. & Smith, P. S. 1992a, ApJ, 398, L57
- Schmidt et al. (1992b) Schmidt, G. D., Elston, R. & Lupie, O. L. 1992b, AJ, 104 1563
- Shang et al. (2011) Shang, Z., et al. 2011, arXiv:1107.1855
- Sikora (2011) Sikora, M. 2011, Jets at All Scales, IAU Symp. 275, ed. G. E. Romero, R. A. Sunyaev & T. Belloni, p.59
- Sikora & Madejski (2000) Sikora, M. & Madejski, G. 2000, ApJ, 534, 109
- Sikora & Madejski (2001) Sikora, M. & Madejski, G. 2001, American Institute of Physics Conference Series, 558, 275
- Sikora et al. (2005) Sikora, M., Begelman, M. C., Madejski, G. M. & Lasota, J.-P. 2005, ApJ, 625, 72
- Sikora et al. (2009) Sikora, M., Stawarz, Ł., Moderski, R., et al. 2009, ApJ, 704, 38
- Snijders (1982) Snijders, M. A. J., Bocksenberg, A., Penston, M. V., Sargent, W. L. W. 1982, MNRAS, 201, 801
- Smith et al. (2003) Smith, P. S., Schmidt, G. D., Hines, D. C. & Foltz, C. B. 2003, ApJ, 593, 676
- Smith et al. (2009) Smith, P. S., Montiel, E., Rightley, S., Turner, J., Schmidt, G. D. & Jannuzi, B. T. 2009, Fermi Symposium, eConf Proceedings C091122, arXiv:0912.3621
- Spada et al. (2001) Spada, M., Ghisellini, G., Lazzati, D. & Celotti, A. 2001, MNRAS, 325, 1559
- Spearman (1904) Spearman, C., ”The proof and measurement of association between two things” Amer. J. Psychol., 15 (1904) pp. 72–101
- Spinrad & Smith (1975) Spinrad, H. & Smith, H. 1975, ApJ, 201, 275
- Stein et al. (1976) Stein, W. A., O’Dell, S. L. & Strittmatter, P. A. 1976, A. Rev. Astr. Astrophys., 14, 173-195
- Stickel et al. (1991) Stickel, M., et al., 1991, ApJ, 374, 431
- Stocke, Danforth & Perlman (2011) Stocke, J. T., Danforth, C. W. & Perlman, E. S. 2011, ApJ, 732, 1312
- Stone & Baldwin (1983) Stone, R. P. S. & Baldwin, J. A. 1983, MNRAS, 204, 347
- Trippe et al. (2010) Trippe, S., et al. 2010, A&A, 515, A40
- Tristram & Schartmann (2011) Tristram, K. R. W. & Schartmann, M. 2011, A&A, 531, A99
- Urry (1999) Urry, C. M. 1999, PASPC, 159, 3
- Vermeulen et al. (1995) Vermeulen, R. C. & Taylor, G. B. 1995, AJ, 109, 1983
- Villata et al. (2008a) Villata, M., et al. 2008a, A&A, 481, L79
- Villata et al. (2008b) Villata, M., et al. 2008b, ATel 1724
- Villata et al. (2008c) Villata, M., et al. 2008c, ATel 1785
- Villata et al. (2009) Villata, M., et al. 2009, A&A, 504, L9
- Wardle & Kronberg (1973) Wardle, J. F. C. & Kronberg, P. P. 1974, ApJ, 194, 249
-
Watanabe et al. (2005)
Watanabe, M., et al. 2005, PASP, 117, 870
ADS : http://adsabs.harvard.edu/abs/2005PASP..117..870W - Webb et al. (2000) Webb, J. R., Howard, E., Benítez, E., et al. 2000, AJ, 120, 41
- Winters & Neri (2010) Winters, J. M. & Neri, R. 2010, An Introduction to the IRAM Plateau de Bure Interferometer, public IRAM document, version 4.1-01
- Wolfe & Wills (1976) Wolfe, A. M. & Wills, B. 1977, ApJ, 218, 39
-
Wolff, Nordsieck & Nook (1996)
Wolff, M. J., Nordsieck, K. H. & Nook, M. A. 1996, AJ, 111, 856
ADS : http://adsabs.harvard.edu/abs/1996AJ….111..856W - Worral & Wilkes (1990) Worral, D. M. & Wilkes, B. J. 1990, ApJ, 360, 396
- Wu et al. (2010) Wu, X.-B., Liu, F. K., Kong, M. Z., et al. 2010, arXiv:1011.6235