A star-bursting proto-cluster in making associated to a radio galaxy at discovered by H imaging
Abstract
We report a discovery of a proto-cluster in vigorous assembly and hosting strong star forming activities, associated to a radio galaxy USS 1558-003 at =2.53, as traced by a wide-field narrow-band imaging with MOIRCS on Subaru Telescope. We find 68 emitters with dust-uncorrected SFRs down to 8.6 M⊙ yr-1. Their spatial distribution indicates that there are three prominent clumps of emitters, one surrounding the radio galaxy and another located at 1.5 Mpc away to the south-west, and the other located in between the two. These contiguous three systems are very likely to merge together in the near future and may grow to a single more massive cluster at later times. Whilst most emitters reside in the “blue cloud” on the color–magnitude diagram, some emitters have very red colors with (AB). Interestingly, such red emitters are located towards the faint end of the red sequence, and they tend to be located in the high density clumps. We do not see any statistically significant difference in the distributions of individual star formation rates or stellar masses of the emitters between the dense clumps and the other regions, suggesting that this is one of the notable sites where the progenitors of massive galaxies in the present-day clusters were in their vigorous formation phase. Finally, we find that emission of the radio galaxy is fairly extended spatially over ″. However it is not as widespread as its halo, meaning that the emission is indeed severely extended by resonant scattering.
Subject headings:
galaxies: clusters: general – galaxies: clusters: individual: USS 1558-003 – galaxies: evolution.1. Introduction
It is well-known that galaxy properties are strongly dependent on the environment where galaxies reside (e.g., Dressler et al., 1997; Tanaka et al., 2005; Cucciati et al., 2006). Galaxy clusters are one of the most biased environments in the Universe, and local ones are dominated by galaxies with red colors and elliptical morphologies which have already quenched their star forming activities and are passively evolving. In contrast, star forming galaxies with a blue color and spiral/irregular morphologies are preferentially found in the field environment. This trend is known as a star formation – density relation where star formation activity of galaxies decreases gradually in higher density regions (e.g., Kauffmann et al., 2004; Cooper et al., 2008). It is certain that some processes specific to high density environment play an important role in formation and evolution of elliptical galaxies found in the local Universe. The plausible environmental effects include galaxy–intracluster medium (ICM) interactions such as ram-pressure stripping (Gunn & Gott, 1972), galaxy–cluster gravitational interactions (Byrd & Valtonen, 1990), and galaxy–galaxy interactions such as mergers and harassment (Moore et al., 1996). However, the relative importance of the processes still remains unclear.
The fraction of blue star forming galaxies in galaxy clusters increases with redshifts up to (Butcher-Oemler effect, Butcher & Oemler, 1978, 1984). Recent observations have revealed that there are many starburst galaxies even in high density regions at (Hayashi et al., 2010; Hilton et al., 2010; Papovich et al., 2010; Tran et al., 2010; Fassbender et al., 2011). However, as their color–magnitude diagrams show a prominent red sequence, a large fraction of passive galaxies also exist in these clusters, and thus formation epoch of such massive galaxies seems to be much earlier. Indeed, Gobat et al. (2011) have found that there are already mature galaxies in a cluster at which is the most distant -ray cluster to date. It is essential to survey dense regions at higher redshifts of in more detail to investigate the site where a large fraction of progenitors of local elliptical are evolving vigorously and reveal critical processes for their evolution, although these recent studies obviously suggest that star forming activity of galaxies become more active with increasing redshifts. The importance of surveys in high density regions at is supported by the fact that the activities of galaxies and AGNs have peaks at 1–3 (i.e., Madau et al., 1996; Hopkins & Beacom, 2006; Ueda et al., 2003). Moreover, it should be noted that massive galaxies on the red sequence disappear in proto-clusters at (Kodama et al., 2007), while such red galaxies are already in place in proto-clusters at (see also Kajisawa et al., 2006a; Kriek et al., 2008; Doherty et al., 2010).
Proto-clusters at are ideal targets to investigate the environmental dependence of galaxy properties at high redshift. High- radio galaxies (HzRGs) are used as good landmarks to search for proto-clusters, because they are thought to be progenitors of massive elliptical galaxies located in the center of local galaxy clusters (e.g., McLure et al., 1999). Indeed, some over-density regions around HzRGs of various galaxy populations such as Lyman emitters (LAEs), Lyman break galaxies (LBGs), distant red galaxies (DRGs), are identified as proto-clusters (e.g., Pentericci et al., 1997; Miley et al., 2004; Kurk et al., 2004b, a; Kajisawa et al., 2006a; Kodama et al., 2007; Kuiper et al., 2010). Therefore narrow-band imaging surveys targeting emitters (HAEs) around the HzRG is also an effective method to investigate star formation activity in a high- proto-cluster.
There are already several surveys of emission lines in proto-clusters at ; PKS 1338-262 proto-cluster at (Kurk et al., 2004b; Hatch et al., 2011), 4C+10.48 proto-cluster at (Hatch et al., 2011), 4C23.56 proto-cluster at (Tanaka et al., 2011). Hatch et al. (2011) have found statistical excesses in number density of emitting galaxies in the vicinity of the radio galaxies of PKS 1338-262 and 4C+10.48 by a factor of 10 compared with that of general fields. The luminosity functions in the proto-clusters have similar shapes to those in the general fields, but the normalization of the luminosity function in the proto-clusters is a factor of 13 higher than that in the fields. Tanaka et al. (2011) have found a statistical excess in the number density of emitters in the 4C23.56 proto-cluster by a factor of 5 compared to a general field. Combining with mid-infrared photometric data which traces reradiation by dust, they revealed that active star formation must been occurring in the proto-clusters, which is as active as that in the general fields at similar redshifts. They also suggest that it is probable that star formation activity in proto-clusters gets stronger towards higher redshifts. Therefore, it is interesting to probe star formation activity in higher redshift proto-clusters to confirm this trend.
In this paper, we present results of our emission line survey in the 4′7′ region around a radio galaxy USS 1558-003 at with the NB2315 narrow-band filter (). This filter is designed to perfectly match to this particular proto-cluster (Figure 1). The redshift of 2.53 is the highest where emission lines can be traced by near-infrared imaging on a ground-based telescope. Kajisawa et al. (2006a) and Kodama et al. (2007) have reported a statistical excess of bright DRGs around this radio galaxy as an evidence for the existence of a proto-cluster associated to the radio galaxy at . In the current paper, our studies have been conducted under the MAHALO-Subaru project (MApping H-Alpha and Lines of Oxygen with Subaru; Kodama et al., in prep). This project aims to reveal the environmental dependence of star forming activities by wide-field narrow-band imaging of or [O II] emission lines in (proto-)clusters and general fields at . Refer also to Kodama et al. (in prep) for the details, such as the method of selection of emission line galaxies and the estimation of galaxy properties (star formation rates and stellar masses). Our previous studies have demonstrated that the narrow-band imaging is very powerful and useful to completely sample star forming galaxies with emission lines down to a certain limiting flux (Kodama et al., 2004; Koyama et al., 2010, 2011; Hayashi et al., 2010, 2011; Tadaki et al., 2011; Tanaka et al., 2011).
The structure of this paper is the following. Observations and available data are described in § 2. Our sample of emitters at around the proto-cluster are selected from the photometric catalog in § 3. We investigate the spatial distribution and colors of the emitters in § 4. Discussions on star forming activity, properties of emitters on the red sequence, and the emission of the radio galaxy will follow in § 5. Finally, we summarize our results of this paper in § 6. Throughout this paper, magnitudes are presented in the AB system, and we adopt cosmological parameters of , and . Vega magnitudes in , and , if preferred, can be obtained from our AB magnitudes using the following calibrations: (Vega)=(AB)0.94, (Vega)=(AB)1.38, and (Vega)=(AB)1.86, respectively. At , 1 arcmin corresponds to 0.483 Mpc (physical) and 1.705 Mpc (comoving), respectively.

2. Observation and Data
| Filter | FoVaaThe pointings of F1 and F2 for and NB2315 images have an offset of 1′ to the west and 1′ to the south. | Integration time | Limiting mag.bbThe limiting magnitudes are measured with a 1.5″ diameter aperture. | Seeing | Instrument | Observation date |
|---|---|---|---|---|---|---|
| (minutes) | (5) | (arcsec) | ||||
| F1+F2 | 80 | 27.16 | 0.70 | Suprime-Cam | 2011 April 29 | |
| F1+F2 | 90 | 26.87 | 0.63 | Suprime-Cam | 2011 April 29 | |
| F1+F2 | 55 | 25.75 | 0.66 | Suprime-Cam | 2011 April 29 | |
| F2 | 75 | 24.18 | 0.42 | MOIRCS | 2011 March 11 | |
| F2 | 45 | 23.51 | 0.47 | MOIRCS | 2011 March 11 | |
| F1+F2 | 57 | 23.65 | 0.66 | MOIRCS | 2011 March 11, 2011 April 17 | |
| (F1: 32, F2: 25) | (F1: 23.46, F2: 23.17) | (F1: 0.66, F2: 0.40) | ||||
| NB2315 | F1+F2 | 203 | 23.01 | 0.53 | MOIRCS | 2011 March 11, 2011 April 17 |
| (F1: 133, F2: 70) | (F1: 22.74, F2: 22.35) | (F1: 0.53, F2: 0.36) |
Note. — Finally, the FWHMs of PSF in all the images are matched to 0.66″, except for the -band image which has a FWHM of 0.70″.
Observations of the USS 1558-003 proto-cluster were conducted on 2011 March 11, April 17 and 29 as a Subaru open-use intensive program (S10B-028, PI: T. Kodama). The optical and near-infrared (NIR) images were taken with Subaru Prime Focus Camera (Suprime-Cam; Miyazaki et al., 2002) and Multi-Object Infra-Red Camera and Spectrograph (MOIRCS; Ichikawa et al., 2006; Suzuki et al., 2008) on Subaru telescope, respectively. Suprime-Cam has a field-of-view (FoV) of 2734 arcmin2, while MOIRCS has a FoV of 47 arcmin2. The and NB2315 data were obtained with two pointings with an offset of 1′ in right ascension and 1′ in declination, to neatly cover the dense clumps of emitters (see §3.2) which were recognized during the course of observing runs. We call these two pointings as F1 and F2. Although the panoramic Suprime-Cam image covers the entire region of both F1 and F2, the MOIRCS and data are available only in the F2 pointing. Therefore, it should be noted that the area used in this study is limited to the F2 region of about 47 arcmin2 where both optical and NIR data are available. The weather was fine during the observations, and the sky condition was photometric. The seeing was less than 0.66″ in all the images except for 0.70″ in the -band. The total integration times in the optical and NIR broad-bands range from 45 to 90 minutes. We took significantly longer integration (203 minutes) at the narrow-band NB2315. Consequently, the available data set consists of six broad-band data, in optical and in NIR, and the narrow-band data with the NB2315 filter.
All of the optical and NIR data are reduced in a standard manner using a data reduction package for Suprime-Cam (SDFRED ver.2.0: Ouchi et al., 2004) and MOIRCS (MCSRED111http://www.naoj.org/staff/ichi/MCSRED/mcsred.html by I. Tanaka), respectively. Refer to Hayashi et al. (2010, 2011) for the details of the reduction procedures. PSFs in all the reduced images, except for the -band image, are matched to 0.66 arcsec. The zero-points of magnitudes are determined using the standard stars, GD153 and LDS749B for optical data, and FS27, FS137 and G191-B2B for NIR data. The 5 limiting magnitudes are 27.16, 26.87, 25.75, 24.18, 23.51, 23.65, and 23.01 in , , , , , , and NB2315, respectively, which are measured with a 1.5″ diameter aperture. The details of the observation and data are summarized in Table 1.
3. emitters in the USS 1558-003 proto-cluster
3.1. Photometric catalog
Source detection is performed on the original NB2315 image with a FWHM of PSF of 0.53″rather than the PSF matched image, using SExtractor (ver. 2.5.0: Bertin & Arnouts, 1996), and photometry on all the images is conducted by the double-image mode of SExtractor. Color indices are defined with aperture magnitudes mag_aper, which are measured with a 1.5″-diameter aperture, while the total magnitudes are defined with mag_auto magnitudes which are measured with an elliptical aperture (see also Kron, 1980). Magnitude errors are estimated from 1 sky noise at each object position taking account of slightly different exposure times and sensitivities, which is thus corrected for the difference in depth over the entire FoV. The regions near the edges of each image where the exposure time is shorter than 75% of the total in each combined image are masked. If an object is not detected in a broad-band filter, a 2 limiting magnitude is used to estimate the upper/lower limits in color indices or the upper limits in magnitudes. We make sure that the stellar colors are consistent with those of stellar templates given in Gunn & Stryker (1983) in order to check the zero-points of magnitudes. From such comparison, the zero-point magnitudes in , , and are corrected by magnitude at most so that the stellar colors are in good agreement with those of the stellar atlas. Moreover, magnitudes are corrected for the Galactic absorption by the following magnitudes; A()=0.62, A()=0.41, A()=0.23, A()=0.14, A()=0.09, A()=0.06, and A(NB912)=0.05 which are derived from the extinction law of Cardelli et al. (1989) on an assumption of and based on Schlegel et al. (1998).
As a result, 1,035 objects are detected in the NB2315 image at more than 5 level (i.e., 23.01 mag. in the F1+F2 region). Among them, 754 galaxies are distinguished from 281 stars based on their and colors. This method to separate galaxies from stars are devised by Daddi et al. (2004) (see also Kong et al., 2006).
The detection completeness is investigated as follows222 This completeness refers to point sources, and the one for extended objects can be relatively shallower than that. However, the sizes of galaxies at are not generally large enough to be resolved in the current data, and the assumption of point sources may not be so impractical. . First, artificial objects with given magnitudes and Gaussian profiles with FWHM of 0.53″ are distributed on the NB2315 image. Source detection is conducted in the same manner as described above, and then the fraction of detected artificial objects is calculated. The detection completeness is found to be more than 74 (83) % down to 23.0 (22.0) magnitude in NB2315.
3.2. Selection of emitters
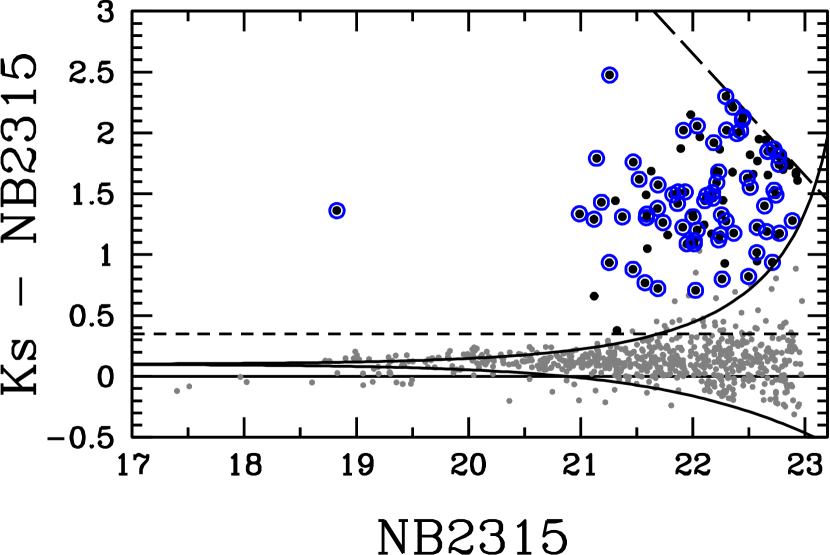
Galaxies with a nebular emission line that happens to enter the NB2315 narrow-band filter should be observed much brighter in NB2315 magnitude compared with the broad-band magnitude which samples primarily the underlying continuum flux density. We thus apply the following criteria to select such galaxies with a emission line at ;
| (1) |
| (2) |
where is the 3 sky noise flux in each band and is the NB2315-band flux density (Figure 2). The continuum flux density is corrected for a color term by 0.1 magnitude as given in the right most side of equation (1), because the effective wavelength of filter is different by 0.163µm from that of NB2315 filter (Figure 1). We note that the –NB2315 colors of Coleman et al. (1980) templates redshifted to are actually distributed around 0.1 magnitude. The second criterion of –NB0.35 corresponds to the observed equivalent width larger than 79Å (22Å in the rest-frame if a galaxy is located at =2.53) after being corrected for the color term of 0.1 magnitude. We select galaxies with color excesses in –NB2315 greater than 3 photometric errors. This means that a emission line with a flux larger than 2.610-17 erg s-1 cm-2 can be firmly detected. If the color excess is due to a +[N II] emission line pair at , the limiting line flux corresponds to L()= erg s-1 and a dust-free SFR of 8.6 M⊙ yr-1 (Kennicutt, 1998), where the ratio of [N II] to ([N II]/) is assumed to be 0.22 (Sobral et al., 2012). We also find 12 galaxies whose line fluxes are larger than this limit, but color excesses are smaller than the 3 level due to their location near the edge of the images where the depth is shallower. These galaxies are not included in our emitter sample. As a result, we select 102 NB2315 emitters out of 754 galaxies over the arcmin2 area (Figure 2).
Although we aim to select emitters at , it is possible that some of the emission lines detected with the NB2315 filter are some other lines at different redshifts such as or [O III] at , [O II] at , and Paschen series lines at . However, it is unlikely that the bulk of the NB2315 emitters originate from , [O III], or [O II] lines at , because the color excesses of the emitters are quite large as shown in Figure 2. Note that the large color excesses we see in –NB2315 may correspond to unrealistically large emission line fluxes, if they are all located at such high redshifts. Indeed, all but seven NB2315 emitters are detected in -band and 64 out of 68 emitters classified below also have the detection. If a nebular line detected by the NB2315 filter would be either an [O III] or an [O II] line, the line luminosity of [O III] (or [O II]) is larger than erg s-1, respectively. The luminosity functions of [O III] at =0.84 (Ly et al., 2007) and [O II] at (Sobral et al., 2012) imply that no more than one [O III] or [O II] emitter with such a high luminosity can be included in our NB2315 emitter sample with limited field coverage, if any. Therefore, we believe that there is few contamination from the lines at in our NB2315 emitter sample. Moreover, it should be noted that our NB2315 survey is targeting the plausible proto-cluster at =2.53 associated to the radio galaxy, and we must be preferentially detecting emitters at rather than other high- emitters in the general field. However, as reported by Geach et al. (2008) who conducted the H2S1 narrow-band (µm) imaging with WFCAM on UKIRT to search for emitters at in the COSMOS field, other lower- emission lines such as Pa and Pa at can be significant contaminations. In order to discriminate from other lower- contaminant lines, we set the following color selection criteria on the color–color diagram, versus ;
|
(3) |
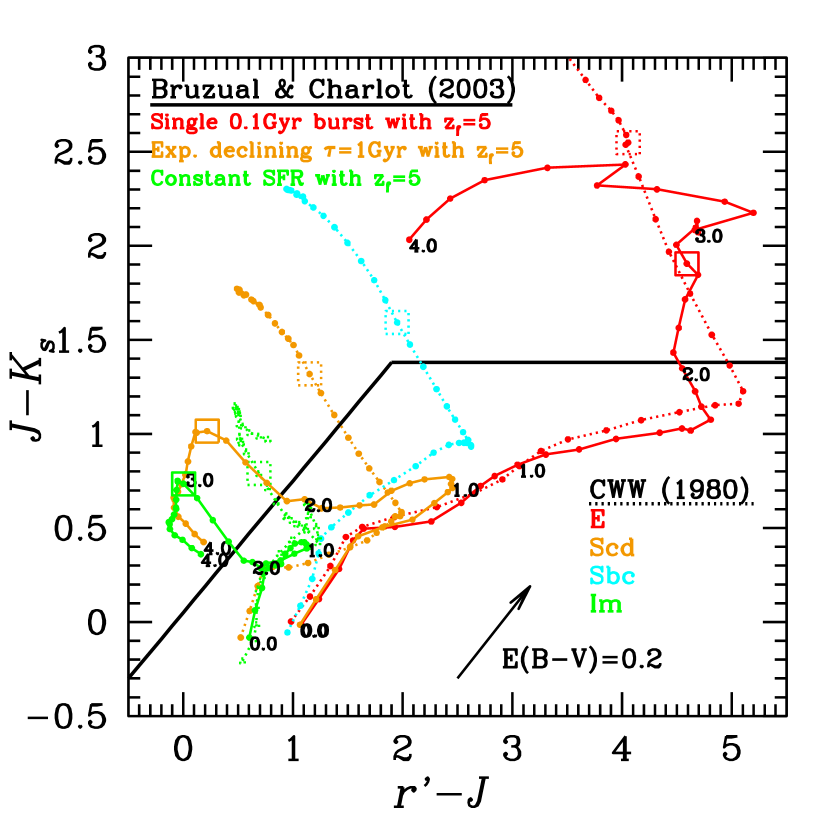
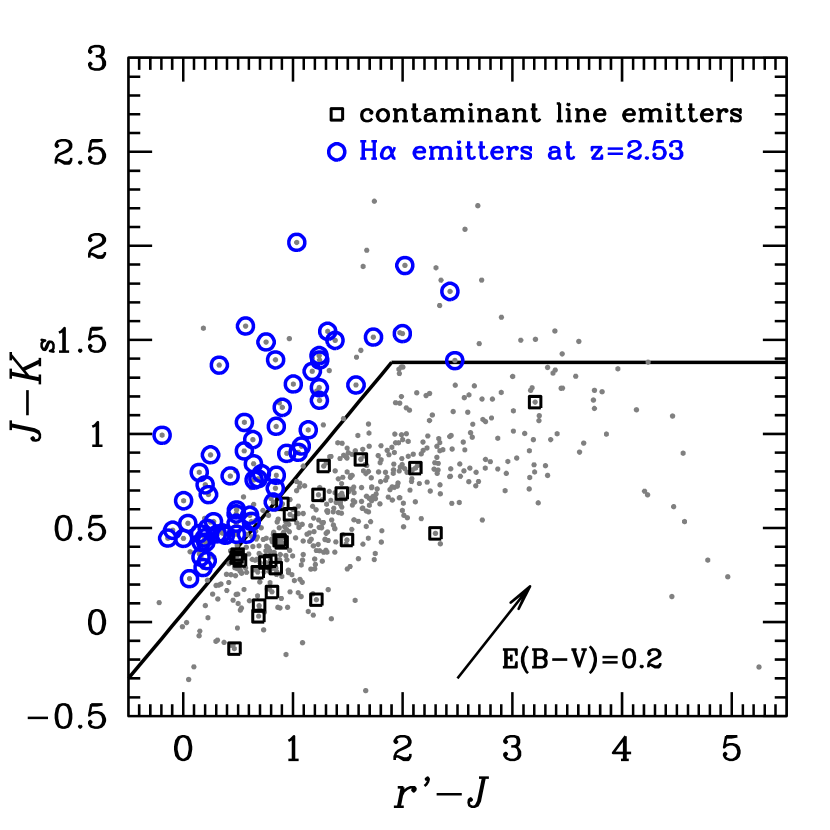
This classification with colors is an analogue of the color selection of galaxies at devised by Daddi et al. (2004), but it is optimized to identify galaxies at . Figure 3 shows the color tracks of model spectra with various star formation histories and fixed formation redshift of based on Bruzual & Charlot (2003), and four SED templates in Coleman et al. (1980) which are redshifted from to . This figure suggests that the criteria enable us not only to select DRGs as galaxies with red colors ((vega)), but also to isolate star forming galaxies at from those at lower redshifts. Although no dust extinction is taken into account for the color tracks, the arrow in the figure shows the reddening vector of based on the Calzetti et al. (2000) extinction curve. This indicates that our selection criteria are relatively free from the dust reddening effect, as the vector is almost parallel to the slanted boundary line. Indeed, a group of emission line galaxies which are likely to be emitters at seem to be located separately from the bulk of galaxies at lower redshifts as shown in the right panel of Figure 3. Thus, our selection criteria work well to select emitters at .
We attempted to apply other color selection methods such as the original selection (Daddi et al., 2004) and selection as well (Kajisawa et al., 2006a; Kodama et al., 2007). However, the selection is effective to select galaxies at , while we aim to pick out emitters at among the NB2315 emitters. Since they are located just at the upper edge of the redshift range of the selection, the selection of emitters may well be quite incomplete. On the other hand, it is found that the selection do not work well due to the shallowness of -band data and the incompleteness in the selection of blue star-forming galaxies. Therefore, we judge that the classification with colors works best among them to identify emitters at . Instead of the color selection, one may consider the use of photometric redshifts to discriminate among different emission lines at different redshifts. We also derive photometric redshifts of our NB2315-detected galaxies using six bands photometry of and the EAZY code (Brammer et al., 2008). However, we find that it is difficult to cleanly discriminate emitters from other possible lines, especially those at , based on the photometric redshifts. In the end, we decide to use the diagram to identify emitters. Consequently, we select 68 emitters in total (Figure 3).
3.3. Selection of Distant Red Galaxies
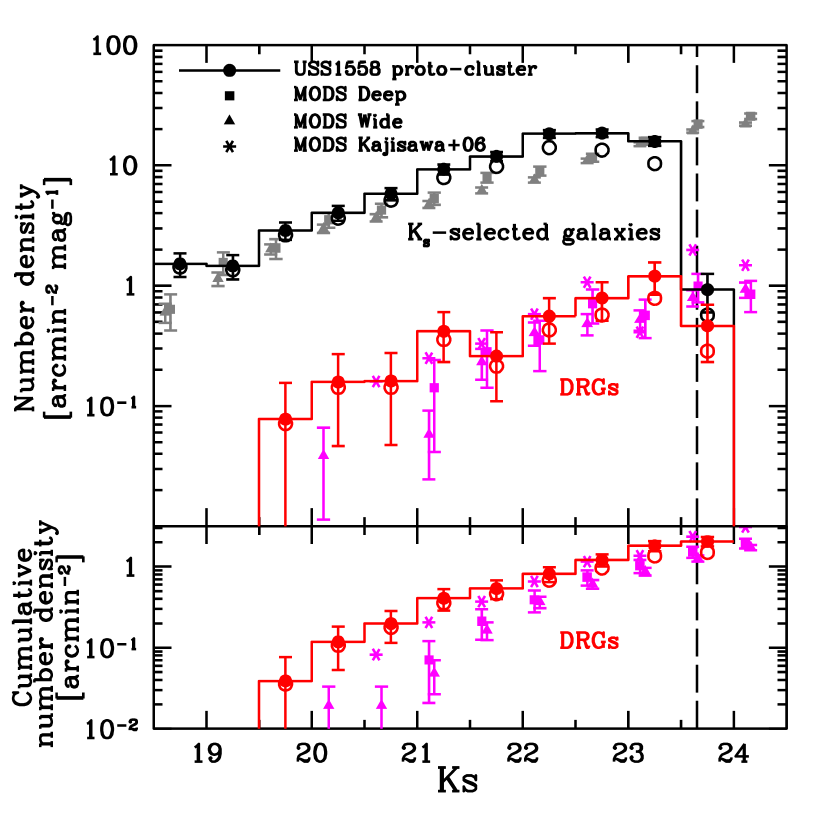
DRG is a class of galaxy populations at with red colors of or (vega) (Franx et al., 2003) which consist of dusty starburst galaxies and quiescent galaxies. To select such red galaxies in this region, the DRG color selection is applied to the -selected catalog which is made with the same procedures as those described in § 3.1 except that source detection is performed on the image. The -selected catalog is used only for the selection of DRGs, since such catalog enables us to select DRGs more completely down to fainter magnitude than the NB2315-limiting magnitude. The catalog includes 1,340 objects brighter than 5 limiting magnitude in . Among them, 1,002 objects are classified as galaxies, while the remaining 338 objects are classified as stars. Consequently, 42 DRGs are selected from the -selected catalog. It is expected that red galaxies associated to the proto-cluster at tend to be seen as DRGs, although DRGs in general can be located in a much wider redshift range of .
Figure 4 shows the number densities of DRGs and -selected galaxies which are corrected for detection incompleteness estimated in the same manner as in §3.1. For comparison with other studies, we also plot the results of the general blank field survey, MOIRCS Deep Survey (MODS) (Kajisawa et al., 2006b, 2011) where the deep and wide surveys have FoVs of 28.2 and 103.3 arcmin2, respectively. The number densities of DRGs as well as -selected galaxies in the USS1558 proto-cluster do not show strong overdensities compared to those in the MODS, although some excesses by a factor of a few are seen at several bins. Kodama et al. (2007) found that this region shows an overdensity of bright DRGs compared to the GOODS-S field (Giavalisco et al., 2004). Figure 4 indeed shows that there is an excess of bright DRGs with in the USS 1558-003 proto-cluster which are almost absent in the general blank field. The difference in number densities of DRGs between the proto-cluster and the general field is clearer in the cumulative densities, showing the excess at level in the bin with . Moreover, the spatial distribution of DRGs is not homogeneous but clustered around the radio galaxy (see §4.1). The fact that there is no significant excess of faint DRGs in the proto-cluster region may suggest that most of the faint member galaxies in this proto-cluster have bluer colors due probably to on-going star formation activities, and that passive red galaxies would be gradually emerging later on. Although we do not have yet any spectroscopic confirmation of membership of the DRGs except for the radio galaxy itself, it is likely that the region around the USS 1558-003 radio galaxy is a proto-cluster at .
| Region | Area | Number | Density | ||
|---|---|---|---|---|---|
| (arcmin2) | (arcmin-2) | ||||
| HAE | DRG | HAE | DRG | ||
| Clump 1 | 3.36 | 15 | 12 | 4.461.15 | 3.571.03 |
| Clump 2 | 1.64 | 20 | 8 | 12.22.73 | 4.881.72 |
| Clump 3 | 0.94 | 8 | 3 | 8.513.01 | 3.191.84 |
| All clumps | 5.94 | 43 | 23 | 7.241.10 | 3.870.81 |
| Others | 21.16 | 25 | 19 | 1.180.24 | 0.900.21 |
| Entire field | 27.10 | 68 | 42 | 2.510.30 | 1.550.24 |
Note. — Errors in the number density are estimated based on Poisson statistics.
4. Results
4.1. Spatial distribution of emitters
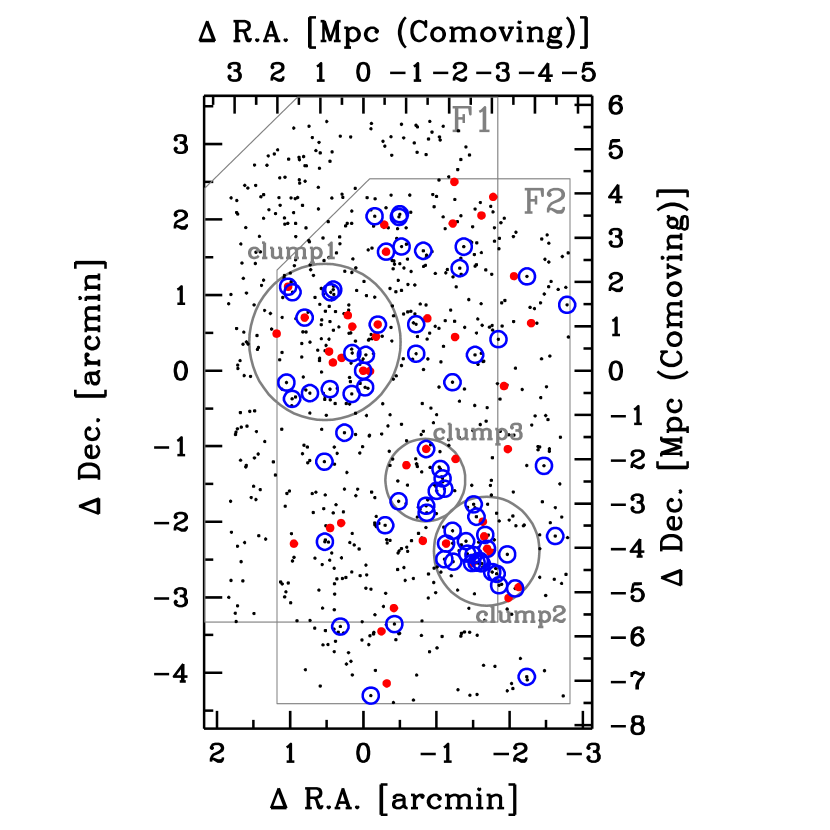
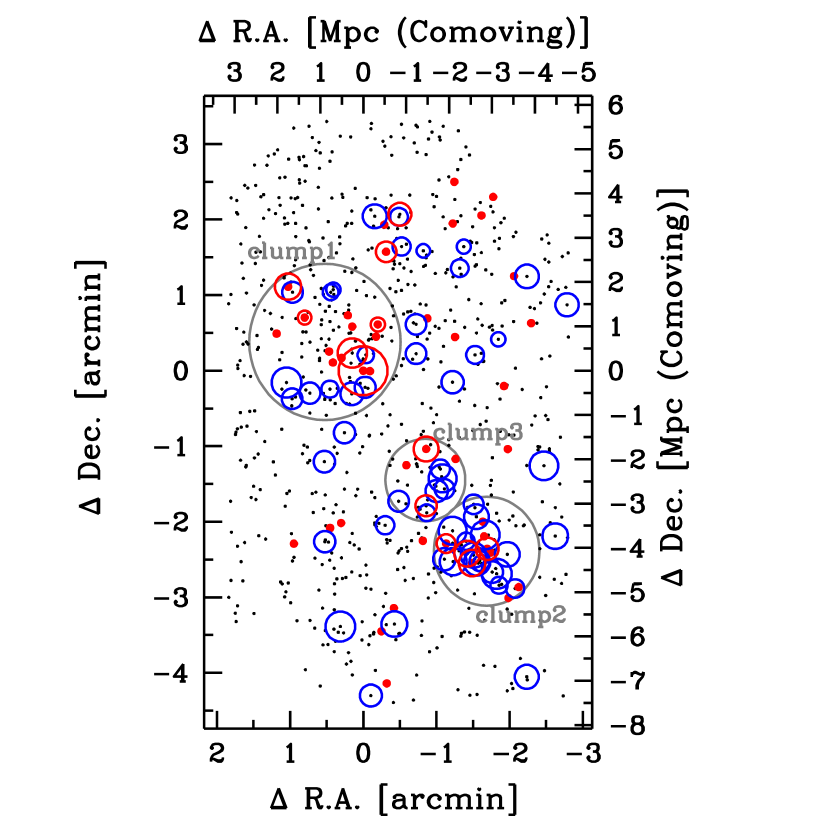
Figure 5 shows the spatial distribution of our 68 emitter (HAE) candidates associated to the USS 1558-003 radio galaxy at located at (0,0) in the figure. The 42 DRGs are also plotted with red filled circles. We find that there are three outstanding regions where HAEs and/or DRGs are strongly clustered, which we hereafter call clump-1, clump-2, and clump-3. In fact, as summarized in Table 2, the number densities of HAEs and DRGs in these three clumps are all higher than those of averaged values across the observed fields by factors of 2–5 for HAEs and 2–3 for DRGs. The clump-1 is the vicinity of the radio galaxy, and it contains both HAEs and DRGs around the radio galaxy. If we assume that the central dominant radio galaxy grows to a cD galaxy in the future, this region may correspond to the central part of the cluster. The fact that DRGs are also clustered in this clump may also suggest that this part of the proto-cluster is the oldest. The clump-2 is the most conspicuous, densest association of the HAEs and DRGs, and is located at ′ (about 1.5 Mpc in physical scale) away from the radio galaxy to the south-west. The clump-3 is a smaller group of emitters located in between the clump-1 and the clump-2.
It is interesting to note that the emitters are more strongly clustered towards the south-west clumps (clump-2 and clump-3) rather than in the immediate surrounding region around the radio galaxy (clump-1). They constitute a part of large scale structure hosting the radio galaxy and clump-1, and they would all merge together in the near future to form a more massive single cluster around the radio galaxy. It is obvious that this proto-cluster region is not relaxed yet and just in the process of galaxy assembly from the the surrounding regions. We note that such distribution of the emitters is similar to that of DRGs reported by Kodama et al. (2007) based on NTT/SOFI imaging data. In fact, we also confirm that the DRGs tend to be located in and along the structures traced by the emitters based on our deeper MOIRCS data (Figure 5). Furthermore, we find that these DRGs also meet the criteria which select galaxies primarily at , suggesting that significant fraction of these DRGs are likely to be physically associated to the proto-cluster hosting the radio galaxy at .
The three clumps in the 1558-003 proto-cluster host a large number of emitters. The surface number density of emitters in the three clumps is 3713 times larger than those in the redshift slice at in the GOODS-North field ( emission survey with NB209 narrow-band filter; Tadaki et al., 2011). Similarly, we also find that it seems that the surface number density is 143 and 174 times larger than those in the redshift slices of 2.2 and 2.53 in the SXDS field ( emission survey with NB209 and NB2315; Tadaki et al. in prep.).
Tanaka et al. (2011) conducted a emitters survey in the field around the 4C 23.56 radio galaxy at with CO narrow-band filter on MOIRCS, and found 11 emitters candidates to flux down to erg s-1 cm-1 and rest-frame EW 50Å over a 23.6 arcmin2 area, which is similar to our survey area. It is found that emitters are distributed on the east side of the radio galaxy 4C 23.56, and there is a clump of emitters Mpc (in comoving scale) away from the radio galaxy. Such an offset distribution of emitters from the radio galaxy is similar to that in our USS 1558-003 field, although our emitters are more strongly clustered than the 4C 23.56 field. However, note that the EW cut and the limiting flux used for emitter selection are slightly different between our survey and Tanaka et al. (2011). Our survey enables us to sample emitters with fainter line fluxes and smaller EWs. If we apply the same EW cut and the limiting flux as in Tanaka et al. (2011) to our sample in the USS 1558-003 field, the number of emitters reduces to 27, but it is still considerably larger than that in the 4C 23.56 field. The discovery of clumps of emitters in these proto-clusters around the radio galaxy at clearly indicates that we are witnessing the process of mass assembly of clusters at their early stage when galaxies are vigorously assembling to form dense cluster cores while they are actively forming stars.
Moreover, Hatch et al. (2011) report the studies for two proto-clusters around the radio galaxies MRC 1138-262 at and 4C+10.48 at . These studies suggest that proto-clusters at tend to show the statistical excess of emitters compared to the general fields at similar redshifts. However, they found that emitters in the 4C+10.48 region are not strongly clustered, while those in the MRC 1138-262 region are clustered (see Kurk et al., 2004b). Moreover, both proto-clusters show inhomogeneous spatial distribution of emitters around each radio galaxy, and most of the emitters are distributed only on one side of the radio galaxies, similar to 4C 23.56 (Tanaka et al., 2011) and USS 1558-003 (this study).
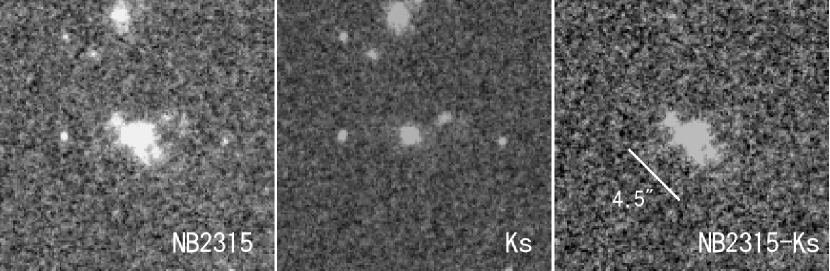
Another interesting result we find is that the radio galaxy show an extremely extended emission spatially as shown in Figure 6. In the NB2315 image, we can notice that the structure of the emission is stretched in the northeast–southwest direction. The size of the emission is ″which corresponds to 36 kpc in physical scale. We discuss the extended emission of radio galaxy itself in §5.2.
4.2. Color–magnitude diagram
Color–magnitude diagram is a powerful tool to investigate the properties of galaxies in clusters or proto-clusters. It is well-known that galaxy clusters at low redshifts are dominated by quiescent galaxies which make up the red sequence on the color–magnitude diagram. The tight sequence of red galaxies is one of the prominent features seen in galaxy clusters. However, when and how do such red quiescent galaxies form and then evolve? The answer to this question still remains unclear, although there are some evidences suggesting that the blue star forming galaxies in the early Universe evolve and become red quiescent galaxies in high density regions during the redshift interval of 2–3 (e.g., Kajisawa et al., 2006a; Kodama et al., 2007; Kriek et al., 2008; Doherty et al., 2010; Gobat et al., 2011). To address this, it is essential to investigate further the color–magnitude diagram for galaxy cluster and proto-cluster at high redshifts when the clusters are vigorously evolving.
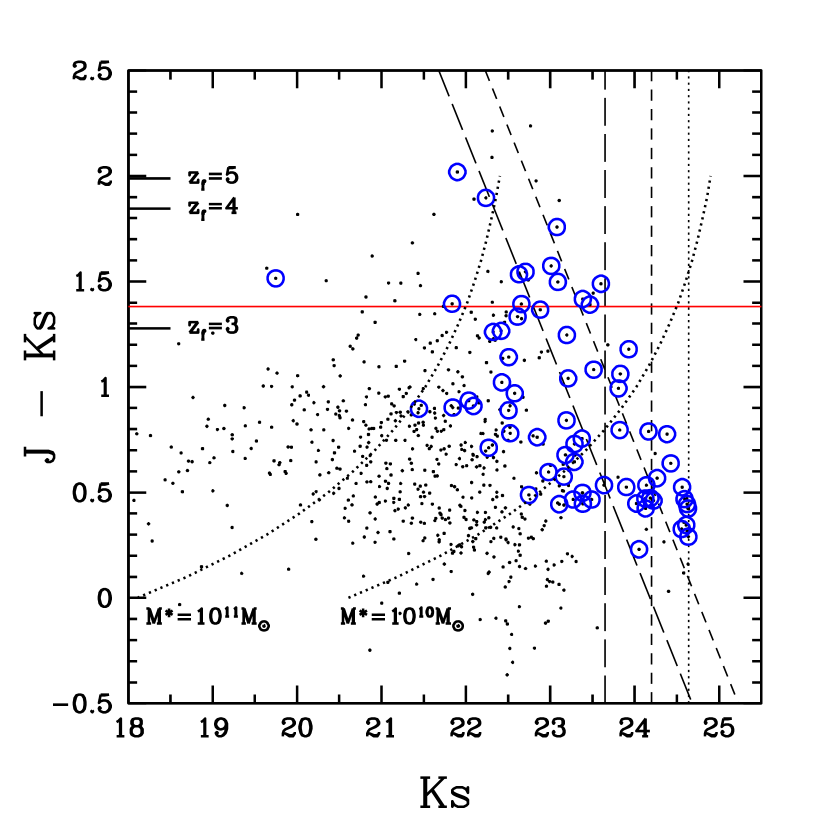
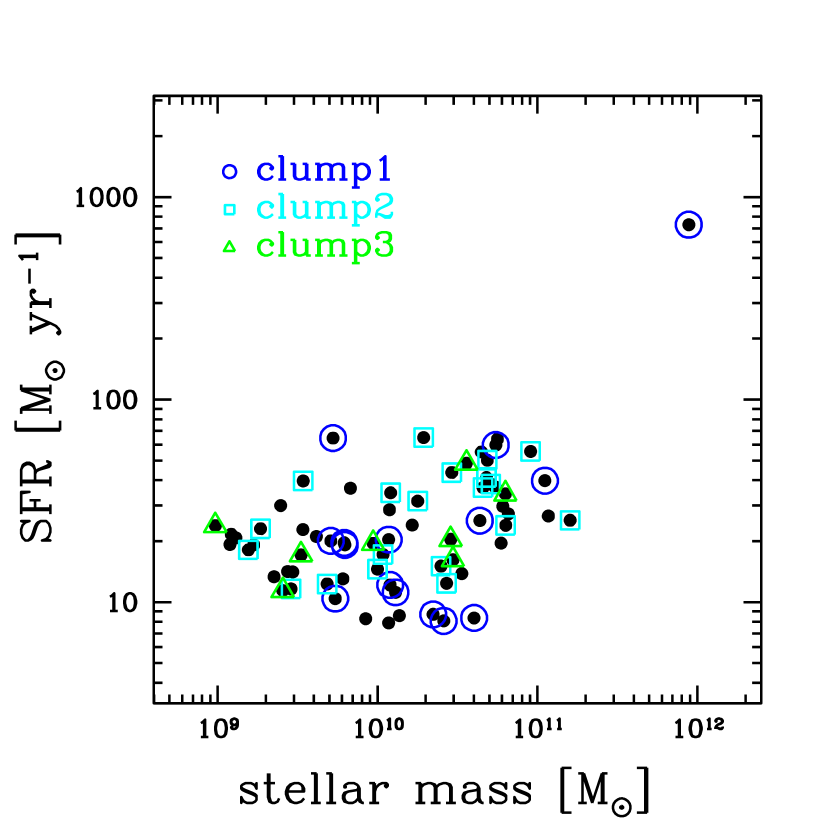
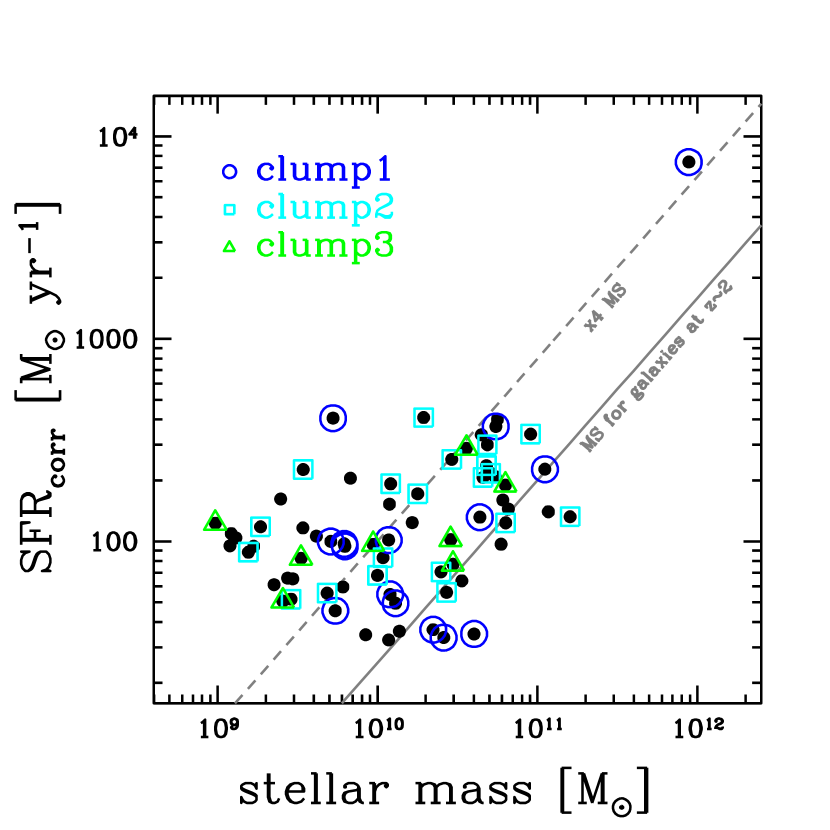
Figure 7 shows a color–magnitude diagram of versus for the galaxies in the observed field towards the proto-cluster USS 1558-003. The emitters associated to the proto-cluster are plotted by open circles. As presented by Kodama et al. (2007), we may be able to recognize a sequence of DRGs at which corresponds to the color of quiescent galaxies with formation redshift of (Kodama et al., 1998), as indicated by the tickmarks in the figure. It is not surprising that the majority of the emitters are located on the bluer side of the diagram. However, it is intriguing that some emitters have very red colors satisfying the DRG criterion and constitute mainly the faint end of the red sequence. We also note that there is a significant color scatter among the red emitters. Similarly red emitters and dusty star forming galaxies have also been recognized by recent observations of clusters at lower redshifts (Geach et al., 2006; Koyama et al., 2010, 2011). They tend to be dusty star forming galaxies and are considered to be in the transition phase from active star forming galaxies to passive quiescent galaxies probably under the influence of some environmental effects, because these are preferentially found in the medium density regions of galaxy clusters at intermediate redshifts () when and where we see a sharp transition in the distribution of galaxy colors from blue to red (Tanaka et al., 2005; Koyama et al., 2008). Therefore it is suggestive that the faint end of the red sequence is just being built by those transitional galaxies recognized as the red emitters.
For a galaxy at , its band luminosity is still a good proxy for the stellar mass. However, the mass-to-luminosity ratio (/) is dependent on SED, and it should be corrected to get more precise stellar mass from the -band luminosity. We use a simple method to estimate stellar masses of the emitters based on their -band magnitudes and colors. The relationship between colors and / are approximately estimated using the stellar population synthesis model of Kodama et al. (1998, 1999) where we constructed a sequence of model with varying bulge-to-disk ratios. We note here that because of the SED degeneracy among age, metallicity, and dust extinction, the relationship between and / is relatively insensitive to the detailed modeling of stellar populations except for the effect of IMF variation. We here assume the Salpeter (1955) IMF, and the stellar masses in the models are scaled accordingly. From this experiment, we establish the following relationship between stellar mass (), magnitude, and color;
| (4) |
where is the -band total magnitude corresponding to the stellar mass of 1011M⊙ for a passively evolving galaxy formed at =5 and observed at =2.53, which is estimated to 22.41. The mass-to-luminosity ratio is corrected for depending on the color by,
| (5) |
The iso-stellar mass curves of 1M⊙ and 1M⊙ are shown in Figure 7. All the emitters but the radio galaxy have stellar masses of M⊙. Among them, the bluest emitters with are less massive galaxies with stellar masses of M⊙. This gives a dichotomy in the distribution of star forming galaxies on the stellar mass–color plane, separated at M⊙, below which the emitters are the bluest hence the youngest or the most actively star forming.
It should be also noted that the brightest emitter is the radio galaxy, and it is located at the brightest end of the red sequence. Note that similar results are also found in other proto-clusters at 2–2.5 (Tanaka et al., 2011; Hatch et al., 2011). Its stellar mass is estimated to M⊙, which is typical for HzRGs (e.g., Rocca-Volmerange et al., 2004; Seymour et al., 2007; Hatch et al., 2009). Since the radio galaxy hosts an AGN, it is not straightforward to quantify its star formation rate from the emission line strength as it is affected by photoionization by AGN (§5.2).
4.3. Star formation activity
The luminosity is a good indicator of star formation rate in the individual galaxy, because emission line is originated from the photoionization by young O and B stars, and thus it probes the instantaneous star formation activity on a time scale of 20 Myr. The advantage of using line to estimate star formation rate is that it is well-calibrated and widely used in the studies of galaxies both in the local and high- Universe. Moreover it is relatively insensitive to dust extinction compared to [O II] and UV luminosities.
The luminosity is estimated from the emission line flux entering into the narrow-band NB2315, which is the combination of and [N II] lines in most cases. Since the emission lines do not enter the broad-band filter for the emitters at , as shown in Figure 1, the flux densities in the narrow-band and the broad-band filters are expressed as and , and thus the emission line flux is:
| (6) |
where Å is FWHMs of the filters, and is the flux density of continuum level of a spectrum. It should be noted that the fluxes are derived under the assumption that the emission lines are shifted into the center of the narrow-band filter. Since the response curve of the filter is not perfectly top-hat (Figure 1), the fluxes can be underestimated if the emission lines are not located in the center of the filter. In that case, the SFR derived from the flux can be a lower limit. The contribution of [N II] is removed from the line flux, F(+[N II]) by assuming the relation between the ratio of [N II]/ and the rest-frame equivalent width of EW0(+[N II]) given by Sobral et al. (2012).
We derive SFR from flux using the Kennicutt (1998) relation, where flux is corrected for dust extinction using the SFR-dependent calibration given by Garn et al. (2010). The dust extinction correction is important even for line which is located in the rest-frame optical wavelength (). It is often assumed that the amount of dust extinction, A(), is unity in many papers. However, we adopt the Garn et al. (2010) relation to more realistically estimate the intrinsic luminosity. The specific SFR is also calculated by dividing the SFR by the stellar mass estimated in §4.2.
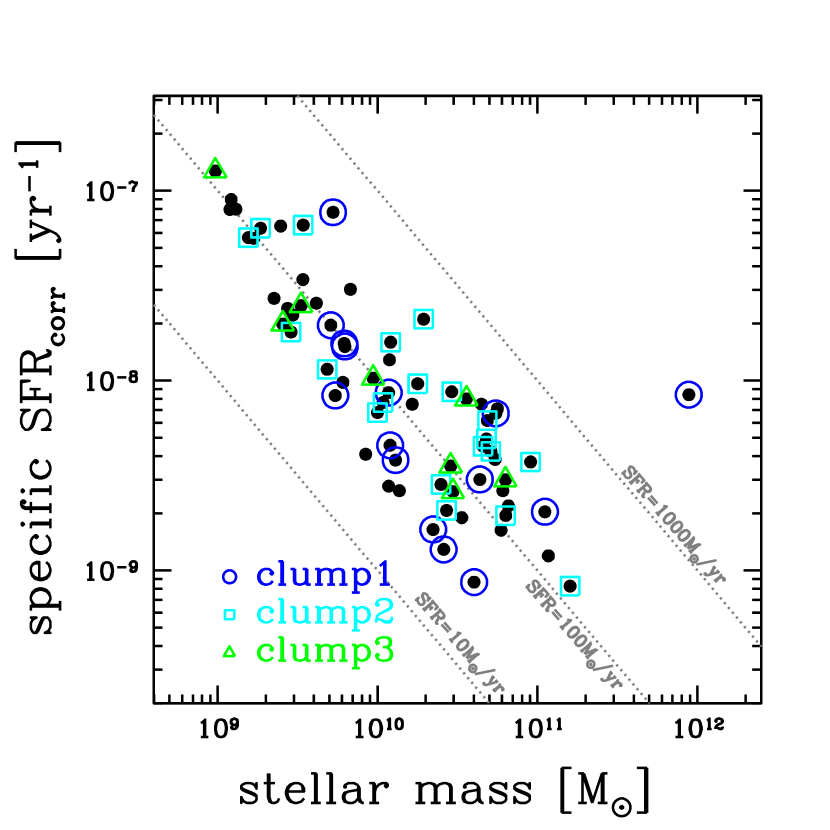
Figure 8 shows SFRs of the emitters as a function of stellar mass, where dust-uncorrected and dust-corrected SFRs (SFRcorr) are shown in separate panels. There is a correlation that more massive galaxies tend to have higher SFRs, but the dependence is weak because there is a significant scatter in SFR for a given stellar mass. A large fraction of the emitters have high SFRcorr larger than 100 M⊙ yr-1, meaning that many star forming galaxies in this proto-cluster are in the starburst phase. The object with the stellar mass of M⊙ is the radio galaxy USS 1558-003 and it apparently shows a considerably high SFR. However, this value must be wrong because its line intensity is severely contaminated by the AGN component. In the right panel of Figure 8, we plot the main sequence of star forming galaxies at (Daddi et al., 2007). In Rodighiero et al. (2011), the galaxies whose SFRs are more than 4 times larger than those on the main sequence for a given stellar are defined as star-burst galaxies. Following this definition, a large fraction of galaxies with M⊙ are starburst galaxies, while the massive galaxies are more or less located around the main sequence. This is somewhat expected by the fact that less massive galaxies show the bluest colors on the color–magnitude diagram (Figure 7). In contrast, none of massive galaxies shows such bluest colors. It should be noted, however, that the red emitters with stellar masses larger than M⊙ are subject to large amount of dust attenuation, and thus they are actually in dusty starburst phase as we will discuss later in § 5.1. Figure 9 shows specific SFRs of the emitters plotted as a function of stellar mass. It indicates that specific SFR and stellar mass are anti-correlated as seen in many other studies. Massive galaxies have lower star formation rates for a given stellar mass compared to less massive galaxies, indicating that star forming activities have been somewhat truncated and weakened in massive galaxies.
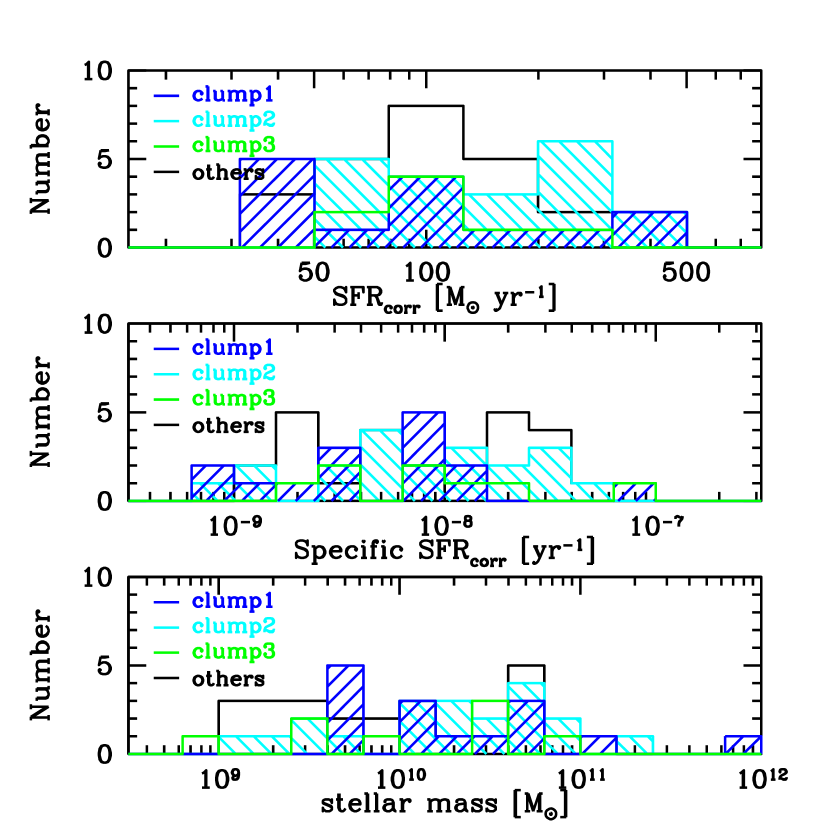
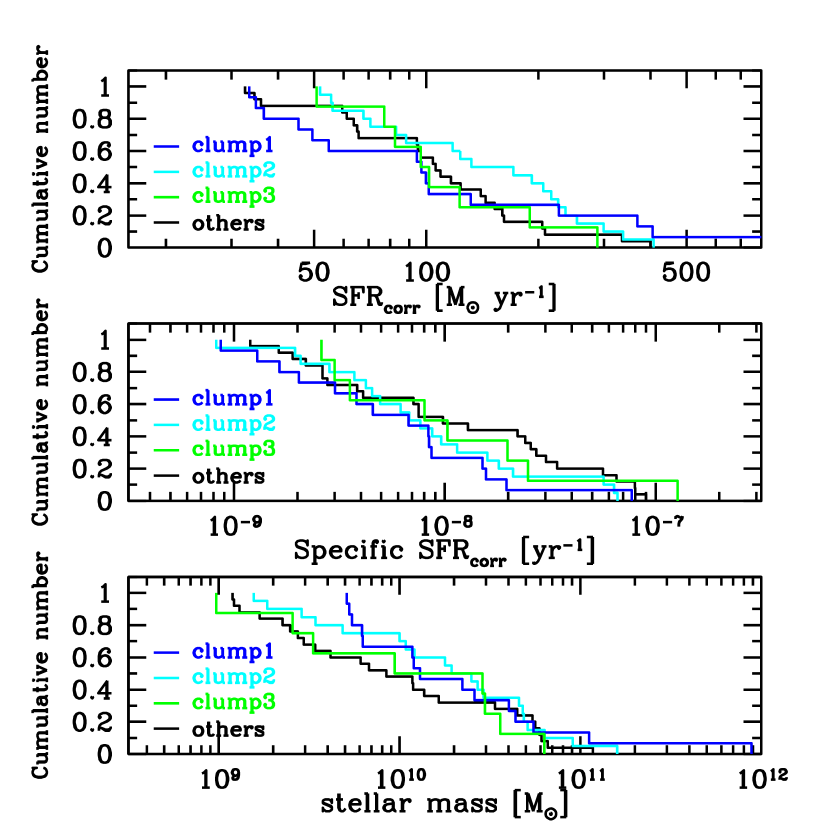
In Figures 8 and 9, emitters in the three clumps are marked with open circles, squares, and triangles. It appears that the emitters in the clump-2 (i.e., the south-west clump Mpc away from the radio galaxy) tend to have higher star formation rates than those in other regions. To investigate any environmental dependence in the properties of emitters more quantitatively, we show in Figure 10 the differential histograms of SFRs, specific SFRs, and stellar masses of the emitters divided by the regions in the left panels, and their cumulative and normalized number counts in the right panels.
There is no large difference in the distribution of all these physical quantities among different regions in general, except for the weak tendency that SFRs in the clump-2 may be slightly higher. In fact, the median SFR of HAE in the clump-2 is 152 M⊙ yr-1 which compared to 97 M⊙ yr-1 in the clump-1, 99 M⊙ yr-1 in the clump-3 and 106 M⊙ yr-1 in the other regions. However, the Kolmogorov-Smirnov (KS) test that is applied on the top right panel suggests that the difference does not show high enough significance in statistics. The probability to accept the hypothesis that the SFRs in these clumps have different distributions is less than 2 at most. Therefore we may conclude that star formation activity at this high redshift (2.5) is high everywhere regardless of environment, not only in the low density outskirts but also in the dense clumps of the proto-cluster. Because we are targeting a proto-cluster and its surrounding region, it is yet unknown whether such absence of environmental dependence at is universal from a proto-cluster to another, as well as in the general low density fields which are not in the vicinity of proto-clusters.
Furthermore, it is interesting to know how much star formation activity and stellar mass are confined in this proto-cluster region as a whole, as most of the structures and the emitters are likely to assemble to form a single richer cluster at later times. The integrated stellar mass and SFR of the emitters in each clump and those in the entire region are shown in Table 3. The uncertainty in the integrated stellar mass and SFR originated from photometric errors are small enough not to give a large influence on the discussions below. Also, in this analysis, we exclude the most massive radio galaxy in the clump-1 (11012 M⊙), since its line flux is severely contaminated by the AGN component. The integrated stellar mass of DRGs associated to the proto-cluster is derived by subtracting the component of DRGs outside the cluster but projected along the line of slight. Here we use the number count of DRGs in the MODS general field survey (Kajisawa et al., 2006b, 2011). We note that the total stellar masses estimated here should be taken as the lower limits, because we miss less massive galaxies fainter than our observational limits. All clumps but clump-3 have a total stellar mass of M⊙, while clump-3 has a factor of 10 lower mass of M⊙. The integrated specific SFR of the clump-1 is slightly lower than those of the clump-2 and the clump-3, by a factor of 1.6 and 3.9, respectively, which might suggest that the star formation activity per unit stellar mass is slightly lower in the closest vicinity of the radio galaxy which may grow to the center of the cluster in the future, and the age of the system is slightly older than the other clumps. However, the statistics is again too poor for us to say anything conclusive yet.
| Region | Stellar mass ( ) [M⊙] | SFR ( SFR) [M⊙ yr-1] | Specific SFR ( SFR / ) [yr-1] | ||
|---|---|---|---|---|---|
| HAE(blue) | HAE(red) | DRG | HAE | HAE+DRG | |
| Clump 1 | 1.3 | 2.3 | 1.2 | 1.8 | 1.4 |
| Clump 2 | 3.9 | 2.7 | 1.2 | 3.4 | 2.2 |
| Clump 3 | 8.2 | 9.1 | 1.1 | 1.0 | 5.4 |
| All clumps | 6.1 | 6.0 | 2.2 | 6.2 | 2.2 |
| Others | 4.1 | 1.8 | 9.2 | 3.2 | 2.4 |
| Entire field | 1.0 | 7.8 | 2.8 | 9.4 | 2.4 |
Note. — The numbers are also divided into clumps and to the other region. For HAEs, blue and red ones are separated at (same as the DRG criterion). For DRGs, the field contamination from foreground/background fields along the line of sight is statistically subtracted using the general field data (MODS). In estimation of specific SFR for combined samples with HAE and DRG, stellar masses are calculated by summing up those for HAE(blue) and DRG. The radio galaxy in the clump-1 is excluded in this table, because its flux is severely contaminated by the AGN component.
5. Discussions
5.1. red emitters
As described in § 4.2, there are some HAEs with colors redder than =1.38. Figure 11 shows the distribution of the HAEs and DRGs, where the red HAEs with are marked by red open circles. It seems that the red HAEs are clustered around the radio galaxy (clump-1) and in the south-west clumps (clump-2 and clump-3). Such concentration of the red emitters in high density regions is qualitatively different from what is seen in the lower redshift cluster at where red HAEs prefer to medium density regions, as mentioned in § 4.2. This may indicate that, in this proto-cluster at , the transition of galaxies is occurring in the densest environment rather than in the outskirts. We note that most of the red HAEs are less massive than M⊙ as shown in Figure 7. If the dusty starburst phase does not last so long, these red HAEs would stay on relatively faint end of the red sequence even after they quench star formation. If the DRGs without emission lines with stellar masses of a few M⊙are really proto-cluster members, the active phase of these massive quiescent galaxies should have been seen at . Some of their progenitors would be like the populations of LBGs or LAEs which are in fact often identified in over-dense regions (proto-clusters) at (e.g., Steidel et al., 1998; Miley et al., 2004; Venemans et al., 2005, 2007; Ouchi et al., 2005; Kuiper et al., 2011).
On the other hand, as another possibility, the red HAEs can be quiescent galaxies with AGN activity in the galaxy core, not dusty starburst galaxies. Even in that case, the fact that the red HAEs are clustered in high density region is very interesting. This is because the considered situation suggests that AGN activity is enhanced in the core regions of the clumps, and thus AGN must give a significant influence on the evolution of high- galaxies in high density region. Perhaps, AGN activity has something to do with process to quench the star formation of cluster galaxies, i.e., so-called AGN feedback. Although it is difficult to reveal which hypotheses are true between dust starbursts and quiescent galaxies hosting an AGN with only the data now available, in any case, there is no doubt that galaxies are activated in the densest regions such as clumps at .
In lower- clusters (), the fraction of star forming galaxies to all cluster members decreases as we go closer to cluster centers or as the number density of galaxies increases (e.g., Kodama et al., 2004; Koyama et al., 2010, 2011). In this USS 1558-003 proto-cluster, however, it is difficult to completely sample red quiescent galaxies, since DRGs have broad redshift distribution such as and also contain both populations of quiescent galaxies and dusty starbursts. This makes it hard for us to quantify the fraction of star forming galaxies in this proto-cluster. However, even if we assume that all the DRGs are quiescent galaxies associated to the proto-cluster at , a large fraction of proto-cluster members are star-formers, and there are much fewer red quiescent galaxies.
5.2. extended emission in radio galaxy
As shown in Figure 6, the radio galaxy USS 1558-003 has quite an extended emission with the apparent scale of ″ or the physical scale of 36 kpc. Although the spatially extended nebular line emission ( and ) have already been recognized around this radio galaxy (Villar-Martín et al., 2007; Humphrey et al., 2008), we here reveal for the first time the two-dimensional distribution of emission. Such extended nebular emission is a remarkable feature commonly seen in HzRGs (e.g., Heckman et al., 1991; Humphrey et al., 2007). In particular, it is well-known that they show extended emission aligned with radio structure (alignment effect). Our extended emission is tilted with the position angle (PA) of 50° (Figure 6). This direction is approximately aligned to but slightly different from the radio axis which has the PA of 75° (Pentericci et al., 2000). Based on the integral field spectroscopy, Villar-Martín et al. (2007) found that the extent of the emission is 9.0″7.5″, and is misaligned by 305° relatively to the radio structures. Therefore, the direction of the stretch of emission is more or less similar to that of emission. However, the size of emission is , and is much smaller than the emission. It is possible that this smaller size of emission is due to the fact that surface brightness of the outer region is less than the detection limit. To check the possibility, we compare the distribution of flux density given in Villar-Martín et al. (2007) with the NB2315– image and find that the emission can be detected at more than 2 if / ratio is constant over the whole region where emission is detected. This thus means the ratio of / is not constant but larger in the outer region of the radio galaxy. Such smaller size of emission compared to emission is also seen in the radio galaxy MRC 1138-262 at =2.16 (Kurk et al., 2002). Kurk et al. (2002) conclude that such fairly extended emission is due to scattered radiation. Since we see a similar nature in the USS 1558-003 radio galaxy, the existence of abundant scattering material around the radio galaxy trapped in deep potential wells and large emission probably due to resonant scattering seem to be a common characteristic of HzRGs.
Furthermore, we find that the radio galaxy also has extended emission in and -band, where there seems to be the contribution of and He II emissions to some extend in the and -band, respectively. However, we do not see any extended emission in the -band. Such extended emission in the rest-frame UV wavelengths, and the compactness of old stellar component may suggest that star forming activity is also currently on-going in the extended regions. In that case, such extended star formation is likely triggered by some physical processes associated to the radio activity. The jet-induced star formation is one of the plausible options (e.g., Bicknell et al., 2000; Hatch et al., 2011).
Many studies have been conducted to investigate the physical origin of nebular emission around the radio galaxy. Possible mechanisms include the photoionization by AGN, young stars and X-ray emission from shock heated gas, and collisional ionization by jet-induced shock (e.g., Miley & De Breuck, 2008, and references therein). Although the ionization mechanism has not yet been completely understood, recent studies suggest that AGN could be the dominant source to ionize the surrounding nebular gas (e.g., Humphrey et al., 2008; Miley & De Breuck, 2008). However, for radio galaxies at , Best et al. (2000) found that the cause of nebular emission is dependent on the size of radio morphology based on the diagnostic with line ratios of nebular emission. Small sources with a radio structure smaller than kpc tend to have emission originated from shock ionization, while larger sources prefer the mechanism of photoionization by AGNs. Since the radio observation of USS 1558-003 shows that the size of the radio galaxy is 9.2″ (74kpc) (Pentericci et al., 2000), the shock ionization would be preferred. It is therefore interesting to investigate the origin of emission of this radio galaxy more in detail.
For this purpose, a diagnostic with nebular emission in rest-frame optical wavelength is useful. Humphrey et al. (2008) conducted optical and NIR spectroscopies where a slit was placed on the radio galaxy along the radio axis, and investigated the ratios of detected emission lines. They detected a lot of emission lines in the rest-frame wavelength range of 1216–6585Å, and found that the radio galaxy has a broad emission line with a velocity width of 12000 km s-1, and that the amount of dust is negligibly small (A). Consequently, they concluded that the line ratios were best explained by AGN photoionization. However, they also find that the sources with high Av do not show evidence for jet-gas interactions, while the sources undergoing strong jet-gas interactions have low Av. The small amount of dust in this radio galaxy implies that the surrounding gas is undergoing interaction with the jet-induced shock. If this is indeed the case, the result is consistent with the proposed relation between the ionization mechanism and the radio size. It is suggestive therefore that the shock induced star formation is occurring to some extent as well as AGN photoionization, and thus both mechanisms are probably contributing to the large extent of the emission. It is difficult, however, to quantify the relative contribution of the two mechanisms, and it is beyond the scope of this paper. Integral field spectroscopy at NIR is essential to resolve the two-dimensional structure of the emission line regions and to fully understand the physical origins of nebular emission.
6. Conclusions
We have conducted a panoramic narrow-band imaging of emitters (HAEs) in the proto-cluster candidate around the radio galaxy USS 1558-003 at using NB2315 filter () installed in MOIRCS on Subaru Telescope. This target is known as an over-dense region where distant red galaxies (DRGs) are clustered (Kodama et al., 2007). We have confirmed that this is indeed a rich proto-cluster in making with lots of star forming galaxies (HAEs) associated to the radio galaxy. We have mapped out the 2-D structure of the proto-cluster, and investigated the star forming activities and the stellar mass content of this forming cluster. The main results we have found are summarized below.
-
(i)
The proto-cluster is mainly composed of three conspicuous groups of galaxies. One of them is surrounding the radio galaxy, and another is about 1.5 Mpc (physical scale) away from the radio galaxy to the south-west, and the other is in between the two clumps. These groups show significant excess in the number densities of both HAEs and DRGs. Their close separations suggest that they would merge together in the near future and grow to a single, more massive galaxy cluster at later times.
-
(ii)
A large fraction of the emitters in this proto-cluster have SFRs higher than 100 M⊙ yr-1, indicating that at , the progenitors of cluster early-type galaxies are vigorously forming in the biased high density regions. Star formation activity is high everywhere irrespective of environment within the proto-cluster region, and the properties of individual HAEs show little environmental dependence, except that the HAEs in the densest clump may have slightly higher star formation rates compared to those in other regions.
-
(iii)
Most of the emitters have blue colors, but some emitters have very red colors comparable to DRG (i.e., ). Those red emitters are located on the fainter side of the red sequence on the color-magnitude diagram, except for the radio galaxy itself. Moreover, the red emitters tend to be clustered in the three highest density clumps in contrast to lower- clusters where similar red emitters are avoiding the cluster cores and preferentially located in the medium density regions or the outskirts of the clusters. Since the red emitters are likely to be dusty starburst galaxies in the transitional phase, this result may indicate that some environmental effects, such as galaxy-galaxy interaction, are at work on galaxies in the dense proto-cluster core at and they are just changing their properties rapidly.
-
(iv)
The radio galaxy shows a large halo extended over 4.5″ (i.e., 36 kpc), indicating that some ionization mechanisms (AGN, young stars, and shocks) are at work in the surrounding material around the radio galaxy. Such spatial extent of emission is still much smaller than the halo. This means that the emission is severely extended by resonant scattering.
These results we present in this paper are all intriguing and there is no doubt that proto-clusters at have high star forming activity and are in vigorously evolving phase. However, we need to investigate more samples of proto-clusters at in detail in order to answer the question whether our results represent the universal properties of proto-clusters at or showing the specific characteristics of the USS1558 proto-cluster. Our on-going MAHALO-Subaru project has been surveying other proto-clusters as well as un-biasedly selected fields at similar redshifts, and enabling us to reveal the universality or variation of properties among proto-clusters at . Such discussion will be presented in our future papers (e.g., Koyama et al. in prep.).
References
- Bertin & Arnouts (1996) Bertin, E., & Arnouts, S. 1996, A&AS, 117, 393
- Best et al. (2000) Best, P. N., Röttgering, H. J. A., & Longair, M. S. 2000, MNRAS, 311, 23
- Bicknell et al. (2000) Bicknell, G. V., Sutherland, R. S., van Breugel, W. J. M., Dopita, M. A., Dey, A., & Miley, G. K. 2000, ApJ, 540, 678
- Brammer et al. (2008) Brammer, G. B., van Dokkum, P. G., & Coppi, P. 2008, ApJ, 686, 1503
- Bruzual & Charlot (2003) Bruzual, G., & Charlot, S. 2003, MNRAS, 344, 1000
- Butcher & Oemler (1978) Butcher, H., & Oemler, Jr., A. 1978, ApJ, 219, 18
- Butcher & Oemler (1984) —. 1984, ApJ, 285, 426
- Byrd & Valtonen (1990) Byrd, G., & Valtonen, M. 1990, ApJ, 350, 89
- Calzetti et al. (2000) Calzetti, D., Armus, L., Bohlin, R. C., Kinney, A. L., Koornneef, J., & Storchi-Bergmann, T. 2000, ApJ, 533, 682
- Cardelli et al. (1989) Cardelli, J. A., Clayton, G. C., & Mathis, J. S. 1989, ApJ, 345, 245
- Coleman et al. (1980) Coleman, G. D., Wu, C., & Weedman, D. W. 1980, ApJS, 43, 393
- Cooper et al. (2008) Cooper, M. C., et al. 2008, MNRAS, 383, 1058
- Cucciati et al. (2006) Cucciati, O., et al. 2006, A&A, 458, 39
- Daddi et al. (2004) Daddi, E., Cimatti, A., Renzini, A., Fontana, A., Mignoli, M., Pozzetti, L., Tozzi, P., & Zamorani, G. 2004, ApJ, 617, 746
- Daddi et al. (2007) Daddi, E., et al. 2007, ApJ, 670, 156
- Doherty et al. (2010) Doherty, M., et al. 2010, A&A, 509, A83+
- Dressler et al. (1997) Dressler, A., et al. 1997, ApJ, 490, 577
- Fassbender et al. (2011) Fassbender, R., et al. 2011, A&A, 527, L10+
- Franx et al. (2003) Franx, M., et al. 2003, ApJ, 587, L79
- Garn et al. (2010) Garn, T., et al. 2010, MNRAS, 402, 2017
- Geach et al. (2008) Geach, J. E., Smail, I., Best, P. N., Kurk, J., Casali, M., Ivison, R. J., & Coppin, K. 2008, MNRAS, 388, 1473
- Geach et al. (2006) Geach, J. E., et al. 2006, ApJ, 649, 661
- Giavalisco et al. (2004) Giavalisco, M., et al. 2004, ApJ, 600, L93
- Gobat et al. (2011) Gobat, R., et al. 2011, A&A, 526, A133+
- Gunn & Gott (1972) Gunn, J. E., & Gott, III, J. R. 1972, ApJ, 176, 1
- Gunn & Stryker (1983) Gunn, J. E., & Stryker, L. L. 1983, ApJS, 52, 121
- Hatch et al. (2011) Hatch, N. A., Kurk, J. D., Pentericci, L., Venemans, B. P., Kuiper, E., Miley, G. K., & Röttgering, H. J. A. 2011, MNRAS, 1103
- Hatch et al. (2009) Hatch, N. A., Overzier, R. A., Kurk, J. D., Miley, G. K., Röttgering, H. J. A., & Zirm, A. W. 2009, MNRAS, 395, 114
- Hayashi et al. (2011) Hayashi, M., Kodama, T., Koyama, Y., Tadaki, K.-i., & Tanaka, I. 2011, ArXiv e-prints
- Hayashi et al. (2010) Hayashi, M., Kodama, T., Koyama, Y., Tanaka, I., Shimasaku, K., & Okamura, S. 2010, MNRAS, 402, 1980
- Heckman et al. (1991) Heckman, T. M., Miley, G. K., Lehnert, M. D., & van Breugel, W. 1991, ApJ, 370, 78
- Hilton et al. (2010) Hilton, M., et al. 2010, ApJ, 718, 133
- Hopkins & Beacom (2006) Hopkins, A. M., & Beacom, J. F. 2006, ApJ, 651, 142
- Humphrey et al. (2007) Humphrey, A., Villar-Martín, M., Fosbury, R., Binette, L., Vernet, J., De Breuck, C., & di Serego Alighieri, S. 2007, MNRAS, 375, 705
- Humphrey et al. (2008) Humphrey, A., Villar-Martín, M., Vernet, J., Fosbury, R., di Serego Alighieri, S., & Binette, L. 2008, MNRAS, 383, 11
- Ichikawa et al. (2006) Ichikawa, T., et al. 2006, in Society of Photo-Optical Instrumentation Engineers (SPIE) Conference Series, Vol. 6269, Society of Photo-Optical Instrumentation Engineers (SPIE) Conference Series
- Kajisawa et al. (2006a) Kajisawa, M., Kodama, T., Tanaka, I., Yamada, T., & Bower, R. 2006a, MNRAS, 371, 577
- Kajisawa et al. (2006b) Kajisawa, M., et al. 2006b, PASJ, 58, 951
- Kajisawa et al. (2011) —. 2011, PASJ, 63, 379
- Kauffmann et al. (2004) Kauffmann, G., White, S. D. M., Heckman, T. M., Ménard, B., Brinchmann, J., Charlot, S., Tremonti, C., & Brinkmann, J. 2004, MNRAS, 353, 713
- Kennicutt (1998) Kennicutt, Jr., R. C. 1998, ARA&A, 36, 189
- Kodama et al. (1998) Kodama, T., Arimoto, N., Barger, A. J., & Arag’on-Salamanca, A. 1998, A&A, 334, 99
- Kodama et al. (2004) Kodama, T., Balogh, M. L., Smail, I., Bower, R. G., & Nakata, F. 2004, MNRAS, 354, 1103
- Kodama et al. (1999) Kodama, T., Bell, E. F., & Bower, R. G. 1999, MNRAS, 302, 152
- Kodama et al. (2007) Kodama, T., Tanaka, I., Kajisawa, M., Kurk, J., Venemans, B., De Breuck, C., Vernet, J., & Lidman, C. 2007, MNRAS, 377, 1717
- Kong et al. (2006) Kong, X., et al. 2006, ApJ, 638, 72
- Koyama et al. (2011) Koyama, Y., Kodama, T., Nakata, F., Shimasaku, K., & Okamura, S. 2011, ApJ, 734, 66
- Koyama et al. (2010) Koyama, Y., Kodama, T., Shimasaku, K., Hayashi, M., Okamura, S., Tanaka, I., & Tokoku, C. 2010, MNRAS, 403, 1611
- Koyama et al. (2008) Koyama, Y., et al. 2008, MNRAS, 391, 1758
- Kriek et al. (2008) Kriek, M., van der Wel, A., van Dokkum, P. G., Franx, M., & Illingworth, G. D. 2008, ApJ, 682, 896
- Kron (1980) Kron, R. G. 1980, ApJS, 43, 305
- Kuiper et al. (2010) Kuiper, E., et al. 2010, MNRAS, 405, 969
- Kuiper et al. (2011) —. 2011, MNRAS, 417, 1088
- Kurk et al. (2004a) Kurk, J. D., Pentericci, L., Overzier, R. A., Röttgering, H. J. A., & Miley, G. K. 2004a, A&A, 428, 817
- Kurk et al. (2002) Kurk, J. D., Pentericci, L., Röttgering, H. J. A., & Miley, G. K. 2002, in Revista Mexicana de Astronomia y Astrofisica Conference Series, Vol. 13, Revista Mexicana de Astronomia y Astrofisica Conference Series, ed. W. J. Henney, W. Steffen, L. Binette, & A. Raga, 191–195
- Kurk et al. (2004b) Kurk, J. D., Pentericci, L., Röttgering, H. J. A., & Miley, G. K. 2004b, A&A, 428, 793
- Ly et al. (2007) Ly, C., et al. 2007, ApJ, 657, 738
- Madau (1995) Madau, P. 1995, ApJ, 441, 18
- Madau et al. (1996) Madau, P., Ferguson, H. C., Dickinson, M. E., Giavalisco, M., Steidel, C. C., & Fruchter, A. 1996, MNRAS, 283, 1388
- McLure et al. (1999) McLure, R. J., Kukula, M. J., Dunlop, J. S., Baum, S. A., O’Dea, C. P., & Hughes, D. H. 1999, MNRAS, 308, 377
- Miley & De Breuck (2008) Miley, G., & De Breuck, C. 2008, A&A Rev., 15, 67
- Miley et al. (2004) Miley, G. K., et al. 2004, Nature, 427, 47
- Miyazaki et al. (2002) Miyazaki, S., et al. 2002, PASJ, 54, 833
- Moore et al. (1996) Moore, B., Katz, N., Lake, G., Dressler, A., & Oemler, A. 1996, Nature, 379, 613
- Ouchi et al. (2004) Ouchi, M., et al. 2004, ApJ, 611, 660
- Ouchi et al. (2005) —. 2005, ApJ, 620, L1
- Papovich et al. (2010) Papovich, C., et al. 2010, ApJ, 716, 1503
- Pentericci et al. (1997) Pentericci, L., Roettgering, H. J. A., Miley, G. K., Carilli, C. L., & McCarthy, P. 1997, A&A, 326, 580
- Pentericci et al. (2000) Pentericci, L., Van Reeven, W., Carilli, C. L., Röttgering, H. J. A., & Miley, G. K. 2000, A&AS, 145, 121
- Rocca-Volmerange et al. (2004) Rocca-Volmerange, B., Le Borgne, D., De Breuck, C., Fioc, M., & Moy, E. 2004, A&A, 415, 931
- Rodighiero et al. (2011) Rodighiero, G., et al. 2011, ApJ, 739, L40
- Salpeter (1955) Salpeter, E. E. 1955, ApJ, 121, 161
- Schlegel et al. (1998) Schlegel, D. J., Finkbeiner, D. P., & Davis, M. 1998, ApJ, 500, 525
- Seymour et al. (2007) Seymour, N., et al. 2007, ApJS, 171, 353
- Sobral et al. (2012) Sobral, D., Best, P. N., Matsuda, Y., Smail, I., Geach, J. E., & Cirasuolo, M. 2012, MNRAS, 420, 1926
- Steidel et al. (1998) Steidel, C. C., Adelberger, K. L., Dickinson, M., Giavalisco, M., Pettini, M., & Kellogg, M. 1998, ApJ, 492, 428
- Suzuki et al. (2008) Suzuki, R., et al. 2008, PASJ, 60, 1347
- Tadaki et al. (2011) Tadaki, K.-I., Kodama, T., Koyama, Y., Hayashi, M., Tanaka, I., & Tokoku, C. 2011, PASJ, 63, 437
- Tanaka et al. (2011) Tanaka, I., et al. 2011, PASJ, 63, 415
- Tanaka et al. (2005) Tanaka, M., Kodama, T., Arimoto, N., Okamura, S., Umetsu, K., Shimasaku, K., Tanaka, I., & Yamada, T. 2005, MNRAS, 362, 268
- Tran et al. (2010) Tran, K., et al. 2010, ApJL, 719, L126
- Ueda et al. (2003) Ueda, Y., Akiyama, M., Ohta, K., & Miyaji, T. 2003, ApJ, 598, 886
- Venemans et al. (2005) Venemans, B. P., et al. 2005, A&A, 431, 793
- Venemans et al. (2007) —. 2007, A&A, 461, 823
- Villar-Martín et al. (2007) Villar-Martín, M., Sánchez, S. F., Humphrey, A., Dijkstra, M., di Serego Alighieri, S., De Breuck, C., & González Delgado, R. 2007, MNRAS, 378, 416