A public void catalog from the SDSS DR7 Galaxy Redshift Surveys based on the watershed transform
Abstract
We produce the most comprehensive public void catalog to date using the Sloan Digital Sky Survey Data Release 7 main sample out to redshift and the luminous red galaxy sample out to . Using a modified version of the parameter-free void finder ZOBOV, we fully take into account the presence of the survey boundary and masks. Our strategy for finding voids is thus appropriate for any survey configuration. We produce two distinct catalogs: a complete catalog including voids near any masks, which would be appropriate for void galaxy surveys, and a bias-free catalog of voids away from any masks, which is necessary for analyses that require a fair sampling of void shapes and alignments. Our discovered voids have effective radii from 5 to 135 Mpc. We discuss basic catalog statistics such as number counts and redshift distributions and describe some additional data products derived from our catalog, such as radial density profiles and projected density maps. We find that radial profiles of stacked voids show a qualitatively similar behavior across nearly two decades of void radii and throughout the full redshift range.
Subject headings:
cosmology: observations, cosmology: large-scale structure of universe, astronomical databases: catalogs1. Introduction
The hierarchical clustering of matter in the universe naturally leads to large underdense regions, called voids. Indeed, the presence of voids in the large-scale distribution of galaxies was one of the early predictions of cold dark matter cosmological theories (Hausman et al. 1983), and the discovery of voids in some of the first galaxy redshift surveys (Gregory & Thompson 1978; Kirshner et al. 1981) quickly provided a rich source of interest. Today, galaxy surveys, such as the Void Galaxy Survey (van de Weygaert et al. 2011) and the Las Companas Redshift Survey (Muller et al. 2000) routinely find and characterize both voids themselves and their contents for useful astrophysical and cosmological information (see Thompson & Gregory 2011 for a review).
A combination of observations and simulations gives a coherent picture of void properties. In the cosmological constant plus cold dark matter (CDM) picture of cosmic evolution, voids — usually defined to have densities of 10-20% the cosmic mean — have characteristic radii of 10-40 Mpc, with the smallest identifiable voids in the local universe having radii Mpc (Tikhonov & Karachentsev 2006). Early structure formation simulations successfully reconstructed observed voids (Hoffman & Shaham 1982; White et al. 1987). Later studies of voids from surveys such as IRAS (Plionis & Basilakos 2002), the 2dF Galaxy Redshift Survey (Hoyle & Vogeley 2004), and the Sloan Digital Sky Survey (Pan et al. 2012) confirmed these properties. Semi-analytic models (Benson et al. 2003; Tinker & Conroy 2009) and large-scale ab initio simulations (Dubinski et al. 1993; Colberg et al. 2005; Ceccarelli et al. 2006; Park & Lee 2007; Kreckel et al. 2011) have further elucidated the evolution, internal structure, and distribution of voids.
Since voids are nearly empty, their dynamics are dominated by dark energy. Thus, they may provide crucial probes of primordial density fluctuations (Sahni et al. 1994), fifth forces (Li & Zhao 2009), and gravity models (Li et al. 2012). The Alcock-Paczynski test (Alcock & Paczynski 1979) can be applied to measurements of void ellipticities, directly probing the expansion history of the universe (Ryden 1995; Ryden & Melott 1996; Park & Lee 2007; Biswas et al. 2010; Lavaux & Wandelt 2012). The internal structure of voids behaves as a universe in miniature, allowing for probes of the history of dark energy (Gottlober et al. 2003; Goldberg & Vogeley 2004). The ellipticity distribution of voids can provide insights into the growth of structure and the correctness of General Relativity (Shoji & Lee 2012; Lavaux & Wandelt 2010). Void orientation and spin statistics reveal information on large-scale tidal fields (Lee & Park 2006; Platen et al. 2008). Understanding the locations and sizes of voids is also crucial for cosmic microwave background (CMB) missions, since they affect the CMB signal via the integrated Sachs-Wolfe effect (Thompson & Vishniac 1987; Vadas 1998; Cruz et al. 2008; Gurzadyan et al. 2009; Granett et al. 2008).
The reliability of the above conclusions and predictions rests on the ability to robustly produce void catalogs from galaxy surveys. While void finders are well-studied in the context of the large-scale dark matter simulations (e.g., Colberg et al. 2005, 2008), few are applied directly to large-scale redshift surveys. The largest void catalogs previous to this work use void finders that rely on overlapping spheres of underdensities (Hoyle & Vogeley 2004; Pan et al. 2012). While simple to apply, this approach fails to capture the full geometry of the voids and relies on finely-tuned parameters to correctly capture them. Additionally, previous works ignore the presence of survey boundaries and masks and do not extend to the full redshift range of the available surveys.
In this work, we describe our techniques for accounting for biases due to the presence of a survey boundary and masks. We employ these techniques along with a modified version of the parameter-free void finder ZOBOV (Neyrinck 2008; Lavaux & Wandelt 2012) to produce a catalog of voids from both the main sample (Strauss et al. 2002) and luminous red galaxy (LRG) (Eisenstein et al. 2001) sample of the Sloan Digital Sky Survey (SDSS) Data Release 7 (Abazajian et al. 2009). The void catalog we produce will be useful for many void-based astrophysical and cosmological studies, as already noted. This void catalog extends to higher redshifts than other catalogs (e.g., Plionis & Basilakos 2002; Hoyle & Vogeley 2004; Pan et al. 2012; Sousbie 2011; van de Weygaert et al. 2011) and is the first to include not only main sample galaxies but also LRGs. While the voids we will identify in the LRG sample are topologically consistent (based on the tessellation and watershed procedures in ZOBOV), they may not fully correspond to underdensities in the cosmological sense due to undersampling of the density field and galaxy biasing effects. We will return to this discussion in Section 7.
We begin in Section 2 with a presentation of our selection of data samples from the SDSS catalog. In Section 3 we describe our modifications to ZOBOV to handle the survey boundary and masks as well as our process for eliminating alignment biases in the void catalog. We characterize the demographics of our void catalog, including redshift-dependent number counts and radial density profiles, in Section 4. We provide two examples of derived data products from the void catalog: radial profiles of stacked voids in Section 5 and projected density maps of stacked voids in Section 6. We discuss the potential for future applications in Section 7 and provide details of the layout of the public void catalog in the Appendix.
2. Data samples
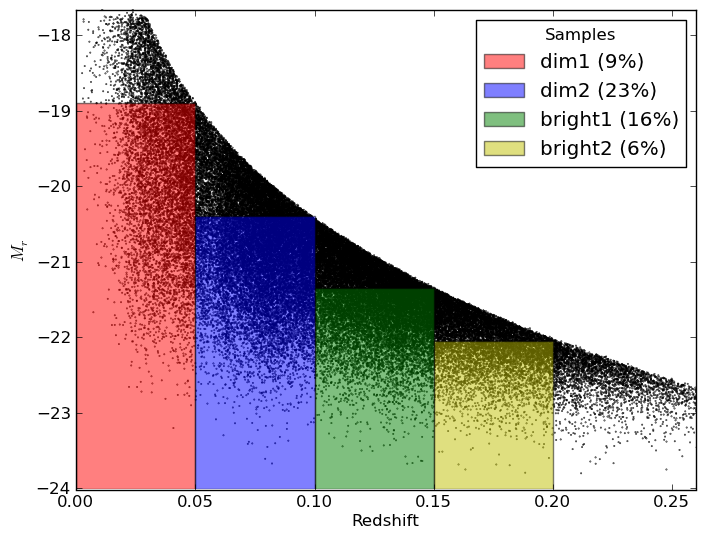
We identify voids in both the SDSS main galaxy redshift survey (Strauss et al. 2002) and the SDSS luminous red galaxy (LRG) redshift survey (Eisenstein et al. 2001). We take our main galaxy sample from the New York University Value-Added Galaxy Catalog (Blanton et al. 2005) which cross-matches galaxies from SDSS (Abazajian et al. 2009) with other surveys using improved photometric calibrations (Padmanabhan et al. 2008). We draw our samples from the full1 catalog, which enforces evolution- and -corrected magnitude limits of . This catalog extends to and contains 671,451 galaxies. We take the LRG catalog of Kazin et al. (2010), which extends from to and enforces magnitude limits of . This catalog contains 105,831 galaxies.
The properties of a void necessarily depend on the galaxy distribution used to define it. We wish to have statistically uniform void populations, so for this work we choose statistically uniform, volume-limited subsets of the above catalog. Although our algorithm does not strictly require it, using volume-limited samples maintains similar effects of shot noise and galaxy bias throughout each void catalog and in principle allows one to make prompt comparison to predictions based on halo occupation models fit to galaxy correlation functions (Berlind & Weinberg 2002; Zehavi et al. 2011).
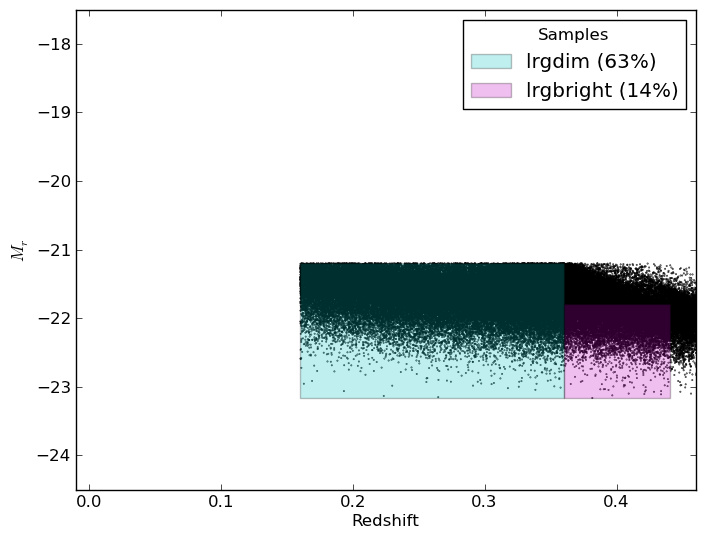
For the main sample, we apply evolution and -corrections and compute absolute magnitudes assuming a cosmology consistent with the latest WMAP 7-year results (Komatsu et al. 2011): , , and . Figure 1 shows the absolute -band magnitude versus redshift for each catalog and illustrates our chosen samples. We choose four redshift bins. Each redshift range is characterized by a typical galaxy luminosity, which we differentiate by the labels dim and bright. Our redshift bins are: , which we label dim1, , labeled as dim2, , called bright1, and , which we label bright2. For the LRGs, we use two volume-limited samples which we label here as lrgdim and lrgbright. The LRG catalogs are already nearly volume-limited by construction, and details of constructing these two subsamples can be found in Kazin et al. (2010). Table 2 lists the sample name, source catalog, limiting absolute magnitude, redshift bound, number of galaxies, and average galaxy spacing. The average galaxy spacing is , where is the number of galaxies within each sample and is the sample volume.
To gather as many voids as possible, we take each sample from redshift to its given redshift cutoff. However, we drop from the sample any void whose center crosses the outer redshift limit of an interior sample. This minimizes boundary effects.
| Sample Name | Catalog | Number of Galaxies | Mean Spacing (Mpc) | |||
|---|---|---|---|---|---|---|
| dim1 | NYU VAGC | -18.9 | 0.0 | 0.05 | 63639 | 3 |
| dim2 | NYU VAGC | -20.4 | 0.05 | 0.1 | 156266 | 5 |
| bright1 | NYU VAGC | -21.35 | 0.1 | 0.15 | 113713 | 8 |
| bright2 | NYU VAGC | -22.05 | 0.15 | 0.2 | 43340 | 13 |
| lrgdim | LRGs | -21.2 | 0.16 | 0.36 | 67567 | 24 |
| lrgbright | LRGs | -21.8 | 0.36 | 0.44 | 15212 | 38 |
3. Voids in survey data
3.1. Coordinates
Given a galaxy’s sky latitude , sky longitude , and redshift , we transform to a hybrid coordinate system
where is the speed of light and is the Hubble parameter at redshift . This coordinate system preserves relative distances; thus, we are essentially finding voids in redshift space. This choice is motivated by our desire to apply the Alcock-Paczynski test to void shapes (Ryden 1995) in a forthcoming work. For completeness, we will also make publicly available a void catalog derived from galaxies in real space with the same cosmology used to construct the volume-limited samples above. Our samples are no longer strictly volume-limited with this choice of coordinates; however, the void properties that we are interested in should be only mildly sensitive to this in the narrow range of each redshift bin. Also, as we will discuss below the Voronoi tessellation preserves topological information. This means that mild distortions due to coordinate transformations will not destroy voids.
3.2. Defining voids
We identify voids using a substantially modified version of the parameter-free void finder ZOBOV (Neyrinck 2008; Lavaux & Wandelt 2012), which is based on a Voronoi tessellation of the tracer particles (in this case, galaxies) to reconstruct the density field (van de Weygaert 2007; Platen et al. 2011) followed by a watershed algorithm to group Voronoi cells into zones and subsequently voids (Platen et al. 2007).
The algorithm works as follows. First, we build a Delaunay tessellation of the volume from the tracer positions in redshift coordinates. Second, we assign a density to each galaxy based on its Voronoi volume. Using this estimated density ZOBOV executes a procedure similar to the Watershed algorithm: the entire volume is split into “zones”, with each zone corresponding to the attraction basin of a local minimum of the density field. ZOBOV then assigns a core density to each zone that corresponds to the lowest local minimum and assembles these zones into voids by successively joining pairs of zones if they share the lowest common saddle point in the density field. This approach is related to the theory of persistence brought to the field of large scale structures by Sousbie (2011). Note that there are no parameters that control the density determination, the construction of zones, their evolution into voids, or indeed any portion of this algorithm.
Under this framework a “void” is a collection of zones that share common saddle points; walls, filaments, and clusters naturally divide a given volume into these voids. The volume of the void is defined as the sum of the Voronoi volumes of its zones. We may record these voids either by their geometrical definition (e.g., a collection of Voronoi cells) or by the tracers contained within them.
While all available void finders accurately identify the largest voids in simulations, there are many differences at the smallest void sizes (Colberg et al. 2008), and all potentially suffer from effects such as artificial bridging between voids (Park & Lee 2009). However, methods based on Voronoi tessellation offer several advantages over competing methods (e.g., Aikio & Mahonen 1998; Foster & Nelson 2009; Forero-Romero et al. 2009; Gaite 2009; Way et al. 2011), which typically gather voids by building overlapping spheres of underdensities. First, a Voronoi tessellation provides a natural construction of the local density of each particle, and hence an accurate measurement of the void volume. This construction is directly related to the local number of neighbors of a particle: more local neighbors induce smaller Voronoi cells and thus a higher local density, as expected. The use of topological criteria, like local minima and saddle points, is what makes a void finder like ZOBOV or DisPerSe (Sousbie 2011) particularly appealing for measuring geometry distortions. Since the topology is resilient to metric transformations, these methods recover mostly the same structures even if those structures have been affected by redshift distortions. This resilience is essential for our analysis because we will be eliminating potential voids and arranging them in a tree based on density and volume characteristics. Secondly, the tessellation procedure allows voids to assume arbitrary shapes while still obeying an overall mean density threshold during the watershed phase. Finally, ZOBOV is able to work cleanly with any sampling of the density field — from sparse LRGs in surveys to dense dark matter particles in simulations — without fine-tuning or parameter adjustments.
Analogous to groups and clusters, voids are naturally organized into a tree-like hierarchy (Aragon-Calvo & Szalay 2012; Paranjape et al. 2012). Following the technique of Lavaux & Wandelt (2012), we organize voids into such a tree based on the natural definitions of boundaries and basins provided by ZOBOV (see Figure 1 of Lavaux & Wandelt 2012). The tree is built from the smallest void to the largest. A given void accepts another void as a parent in the tree if all the zones of the void are present in the parent void and the parent void is larger than the considered void. This structure allows us to double count regions that are sampled by different void sizes at the same time. This is particularly useful when grouping void sizes into large bins.
We impose two independent density-based selection criteria. First, we restrict ZOBOV to report only voids with mean density contrasts of (in practice, we require the mean density contrast of the set of Voronoi cells that constitute a void to be ; voids will generally have density contrasts slightly below this threshold). This reduces the effects of sampling noise in the estimated size of each void (Schmidt et al. 2001). Next we reject any void that has overdensity greater than within a central region, which we take to be one quarter the effective radius (defined below). We do this to eliminate the effects of Poisson noise in these extremely underdense regions. Note that these quantities are defined relative to the mean number density of galaxies in the survey volume. Finally, for a given survey sample, we ignore any voids whose effective radius is smaller than the mean galaxy separation, which analyses have shown to be the minimum resolvable void size (Colberg et al. 2005; Tikhonov & Karachentsev 2006; Platen et al. 2011).
In the following discussion, we define the center of each void to be the volume-weighted barycenter of all the galaxies contained in the void volume:
| (1) |
where is the position and Voronoi volume of each galaxy . In other words, this is the volume-weighted average position of the Voronoi cells which make up a void, and also the density-weighted average position of the galaxies. This reduces the effects of shot noise on the determination of the void center compared to other methods, such as unweighted averaging or choosing the most-underdense galaxy position. Also, we define the void radius as the effective radius, or the radius of the sphere which has the same volume as the Voronoi-based void volume:
| (2) |
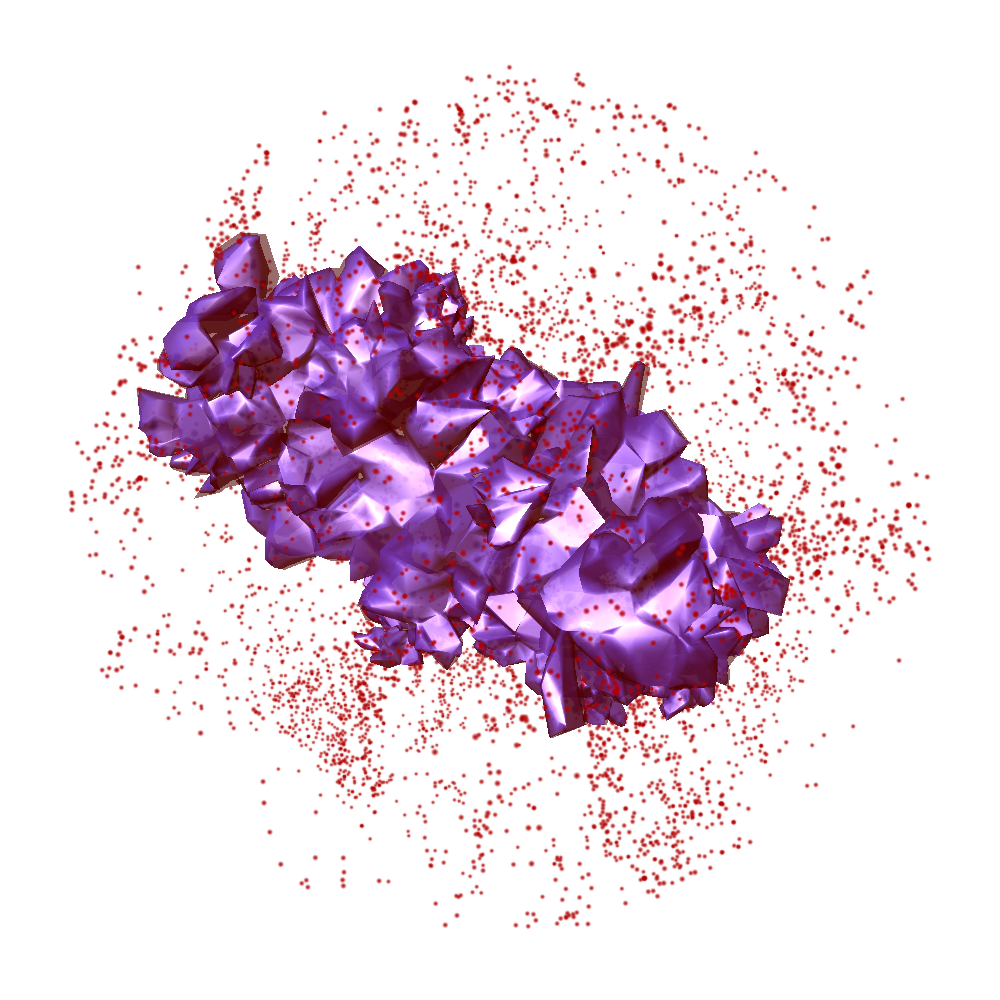
Figure 2 shows an example Mpc void from the dim2 sample with both its galaxy members and surrounding non-members. This highlights how the Voronoi and watershed technique of ZOBOV stretches and deforms the void shape to fill the entire underdense region. The void is clearly buttressed by denser patches of galaxies identified as clusters and walls. The highly non-spherical shape is characteristic of voids identified with the Watershed Transform. One consequence, which will become apparent below, is that a sphere of radius is not necessarily underdense, even though the Voronoi volume itself has a mean density contrast of .

3.3. Accounting for survey boundaries
We must make a few modification to ZOBOV to account for survey masks, boundaries, and redshift cutoffs so that voids do not include volumes outside the survey extent. We begin with a pixelization of the survey mask using HEALPix (Gorski et al. 2005)111http://healpix.jpl.nasa.gov. The HEALPix description of the sphere provides equal-area pixels, and the HEALPix implementation itself provides built-in tools to easily determine which pixels lie on the boundary between the survey area and any masked region. Figure 3 shows our pixelization of the SDSS DR7 mask and the location of the boundary pixels. To accurately capture the shape of the mask we required a resolution of .

We wish to prevent voids from extending into the boundary or near any masks within the survey area. To accomplish this we inject boundary particles along each boundary pixel with a density . Testing has shown that we require an order of magnitude lower density to ensure that every galaxy near the survey edge is closer to a boundary particle than any other galaxy and to stabilize the resulting voids for the most dense sample; lower density samples require even fewer boundary particles. We place the boundary particles randomly within the volume defined by the surface area of the HEALPix pixel and the redshift extent along the line of sight. This process and our chosen density results in a very thin sheath of particles that completely encloses the galaxy distribution. In addition, we place boundary particles at the minimum and maximum redshift “caps” of the survey. Finally, we define a cubic box that completely contains the survey volume and distribute boundary particles evenly along the surface of that box. This last placement provides closure to the Voronoi tessellations of the boundary particles so that we do not have to directly modify this portion of ZOBOV.
We assign infinite densities to the boundary particles — this prevents boundary particles from joining zones and voids and hence stops voids from expanding past the survey region. In addition, since the volume of any Voronoi cell that touches a boundary particle is by definition arbitrary, we cannot include that cell in any constructed void. Thus, after the tessellation phase we remove both the boundary particles and any galaxies adjacent to the boundary population (i.e., closer to a boundary particle than any other galaxy) together with their associated Voronoi cells. This process removed approximately 10% of the true galaxy population.
3.4. Handling mask-induced bias
The above prescription produces a complete and robust void catalog that fully accounts for survey boundaries and masks: the Voronoi volumes that define each void lie completely within the survey volume, and the mean density contrast of the summed Voronoi volumes of each void is . The resulting catalog is appropriate for many applications, such as studying the fractional volume of the universe occupied by voids or studying the properties of galaxies within voids.
However, the survey mask, boundaries, and redshift cutoffs introduce a subtle bias: they will preferentially select voids that lie along the line of sight (for boundaries and masks) and perpendicular to the line of site (for redshift cutoffs). For example, a void parallel and near to the survey boundary will be relatively complete, but a void perpendicular to the survey boundary will appear as a smaller, truncated void, which will tend to be below the resolution threshold and hence expunged from the catalog. Thus, analyses that rely on the shapes of voids, such as the ellipticity probability distribution or the Alcock-Paczynski test, will be strongly affected because they will see more voids aligned with the mask and boundary than perpendicular to it.
To eliminate this bias, we produce a culled sample of voids that we refer to as the “central” sample in later discussions. To produce this sample we remove any void which, when rotated in any direction about its barycenter, intersects a boundary galaxy. Operationally we perform this by taking the distance from the void barycenter to the furthermost particle and comparing that to the distance to the nearest boundary particle. This ensures that we have a fair distribution of void shapes and alignments within the survey volume.
4. Void demographics
We begin with a discussion of the identified void locations and distributions within the four volume-limited samples. Figures 4, 5, and 6 show the barycenters of all voids in each sample overlaid on galaxy positions. To clarify plotting, we have rotated all galaxy and void positions about the -axis so that they lie on the - plane (i.e., a rotational projection). We only show galaxies and voids within a 25 degree opening angle. We plot the void positions with different colors to distinguish their sizes.
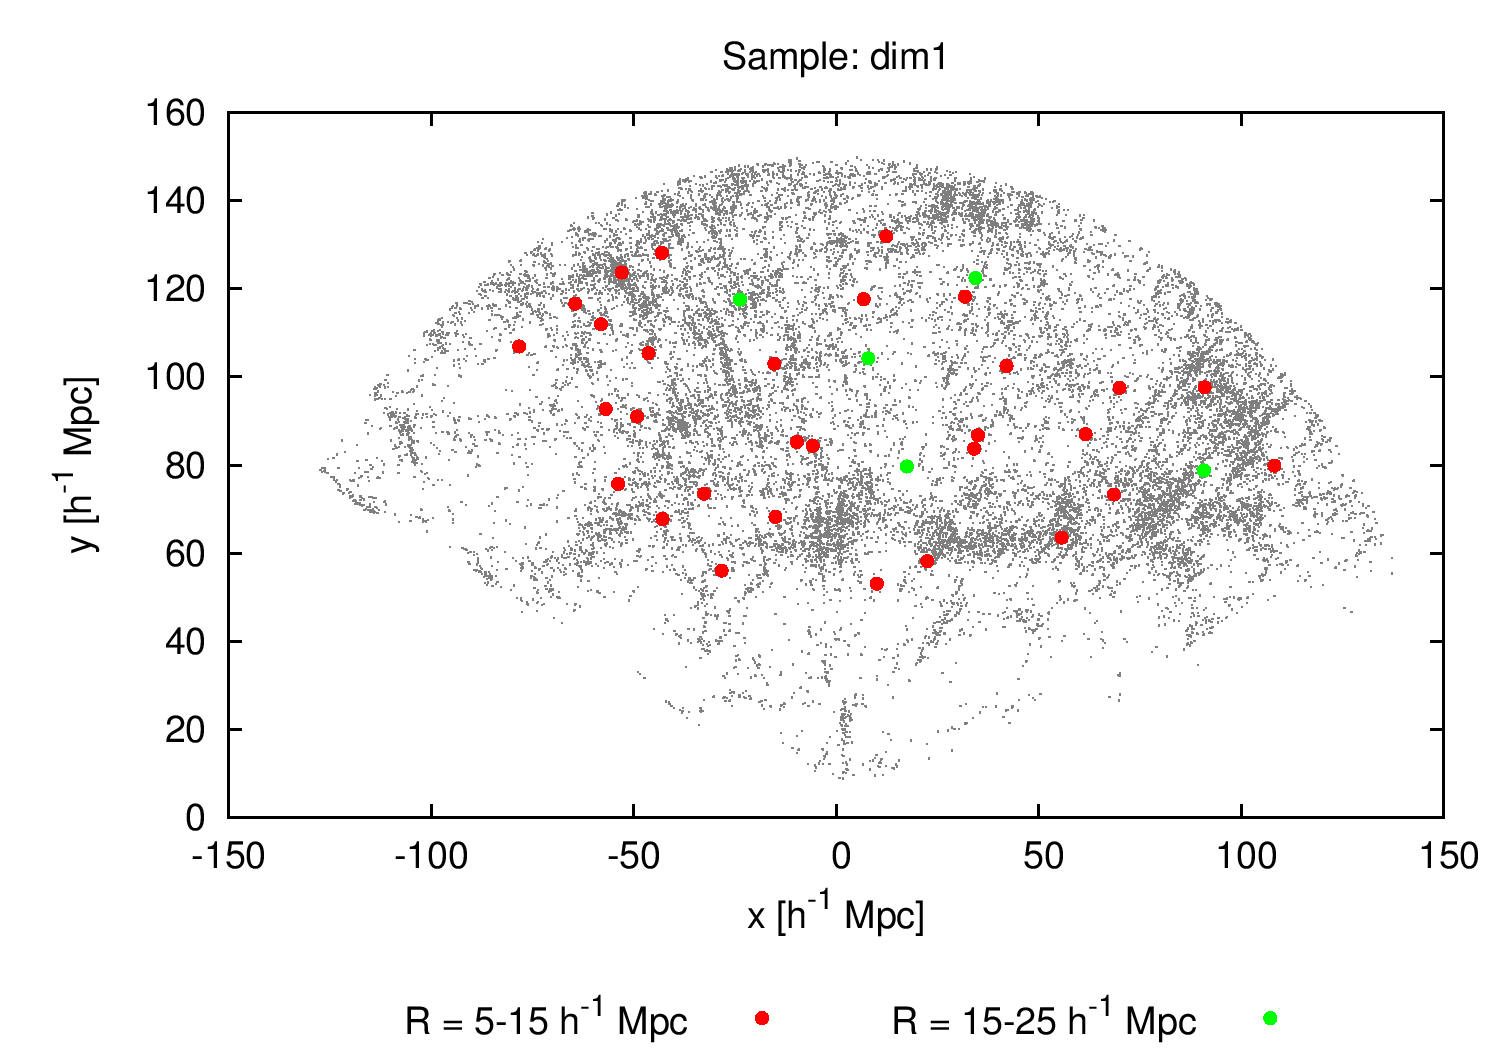
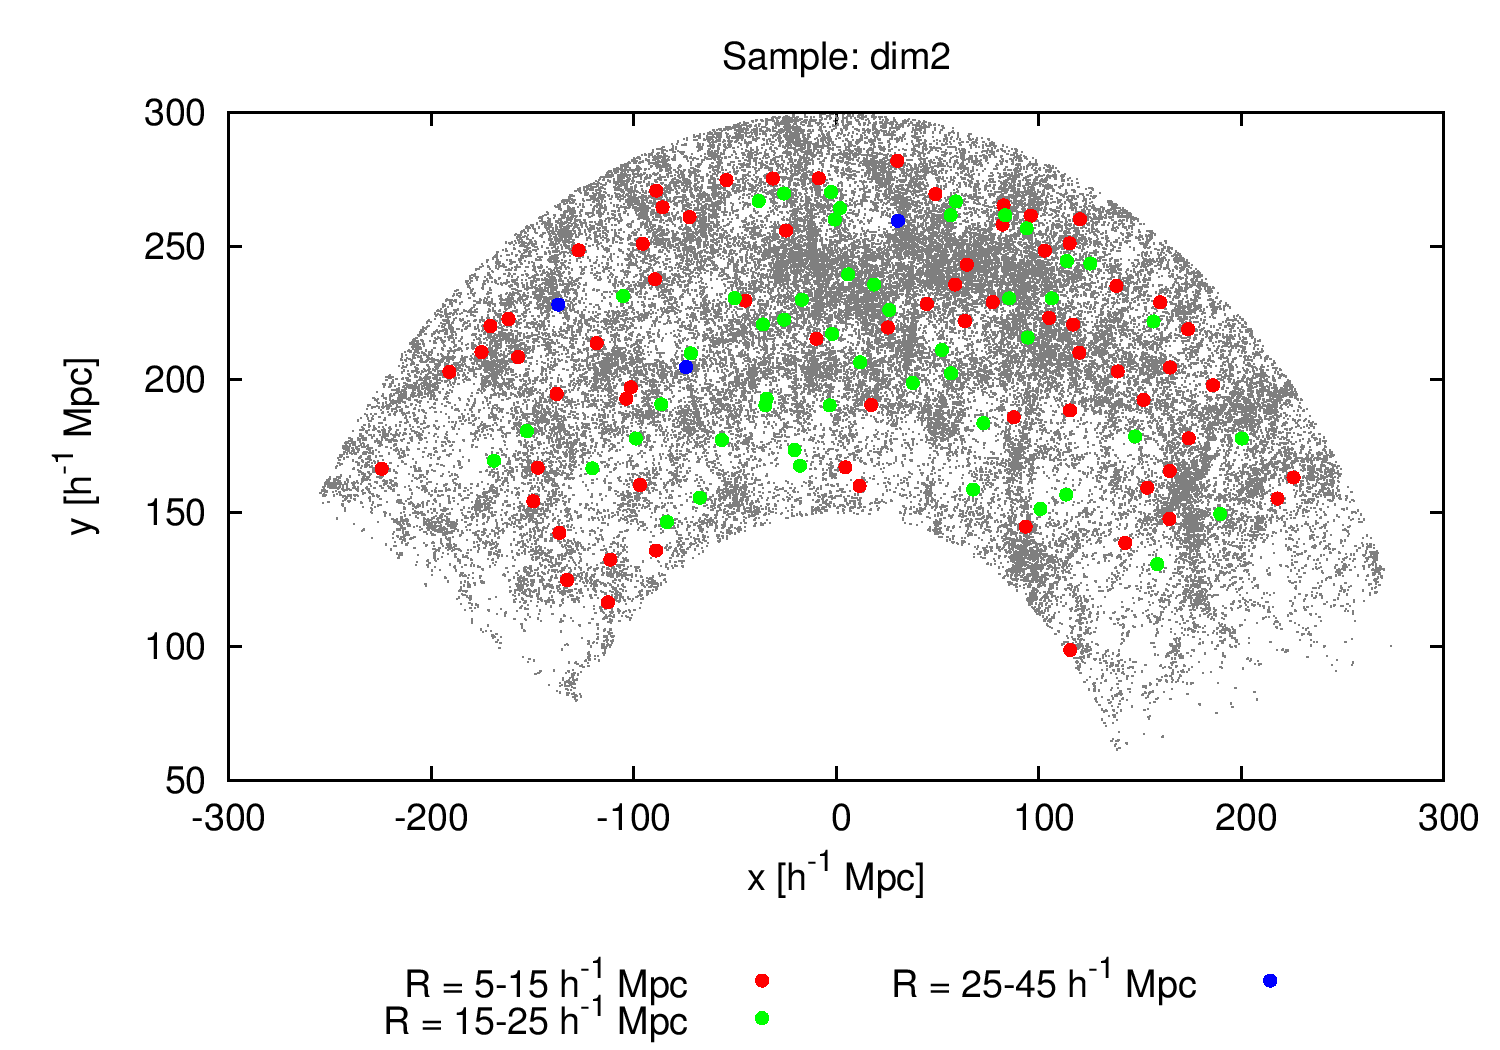
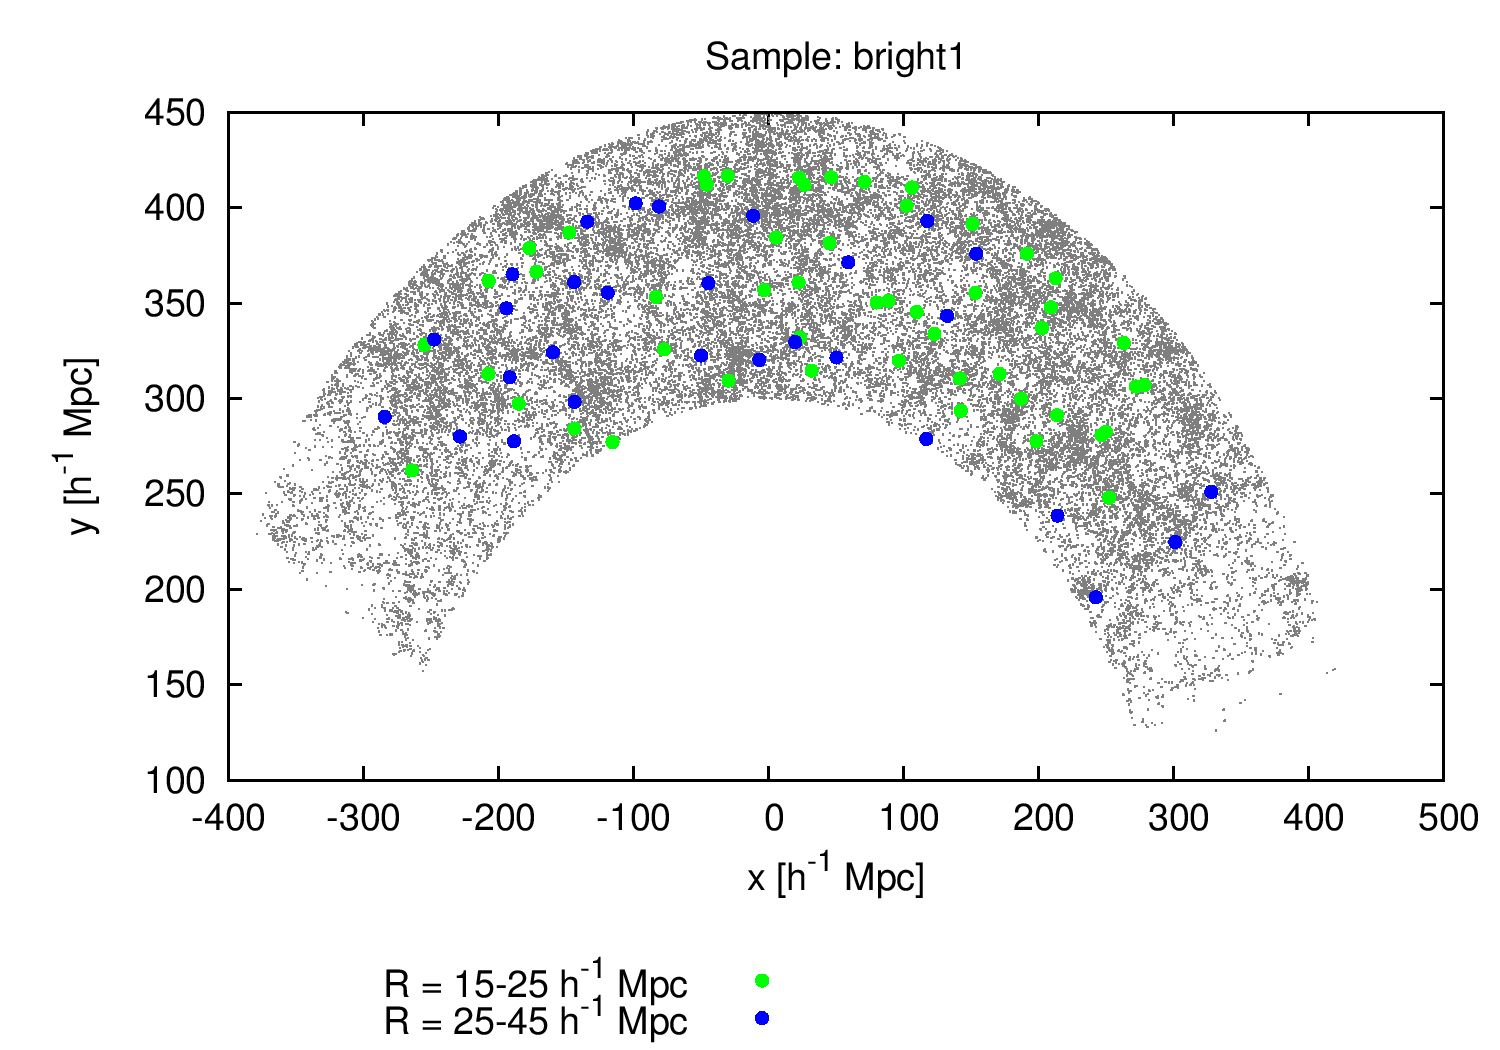
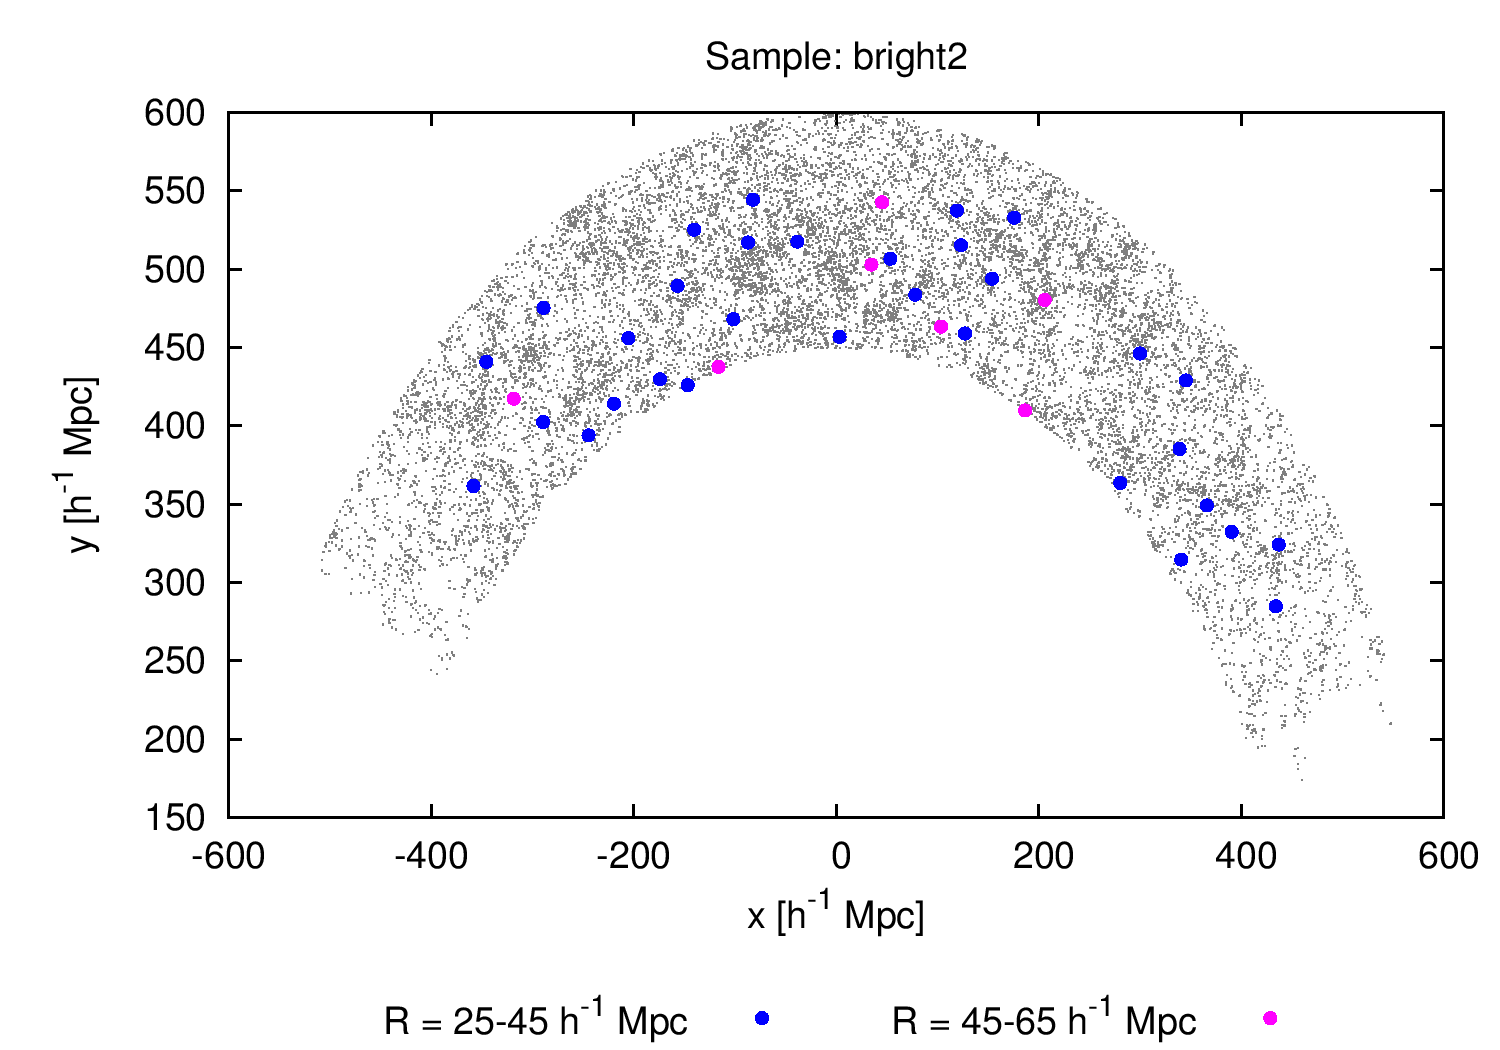
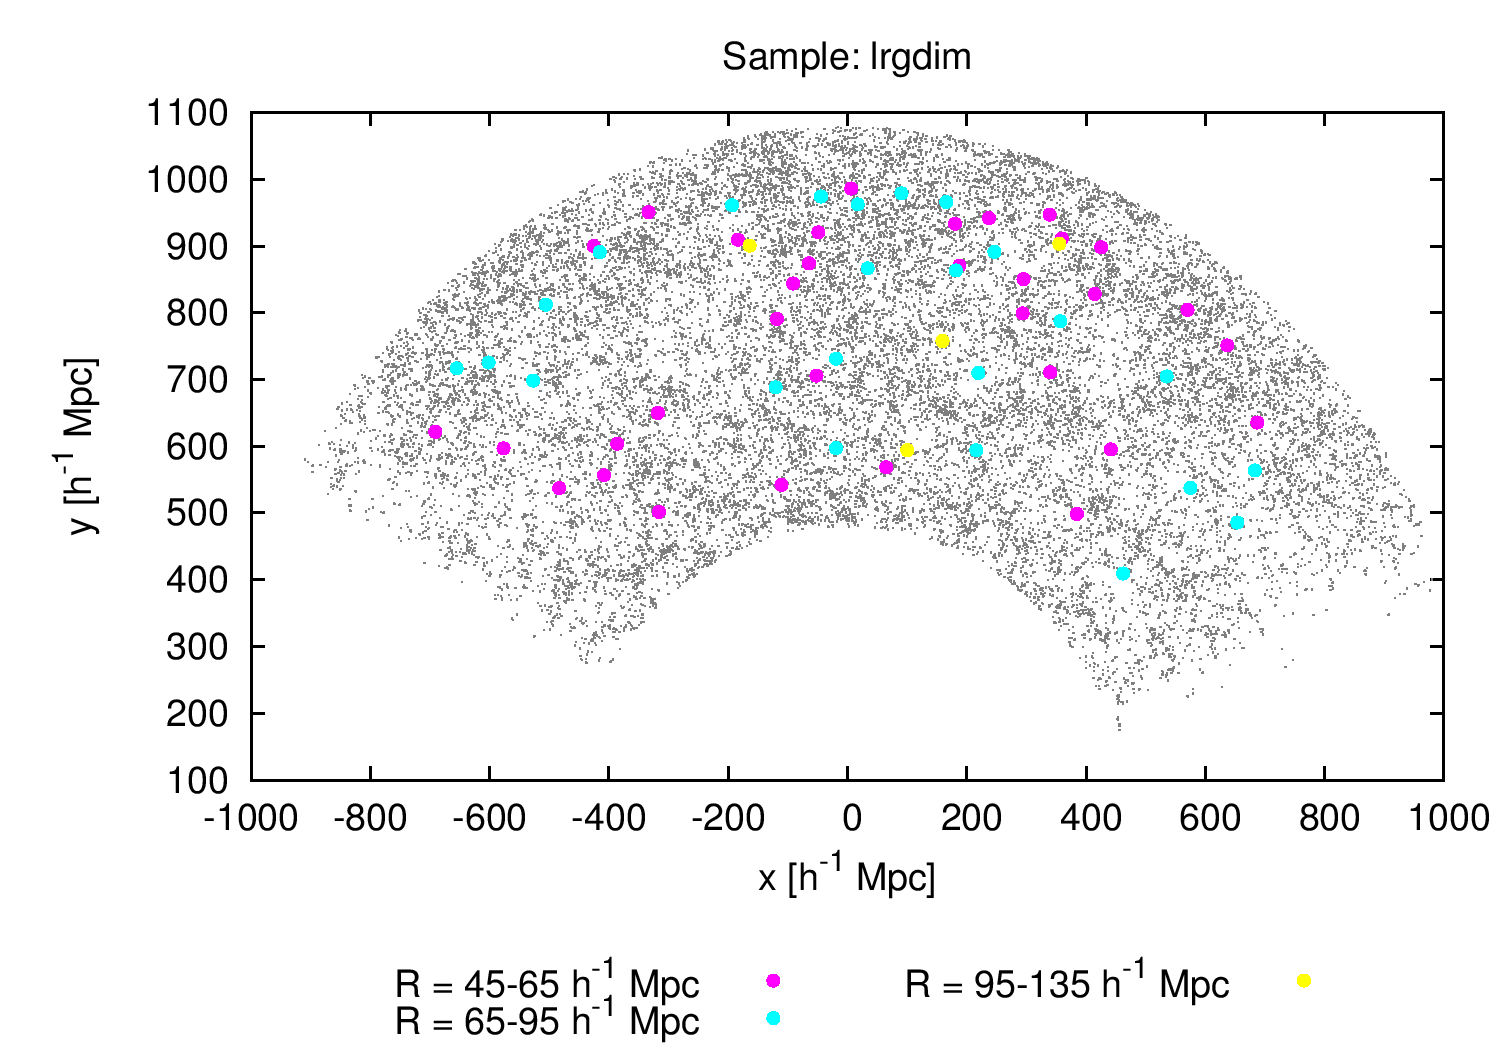
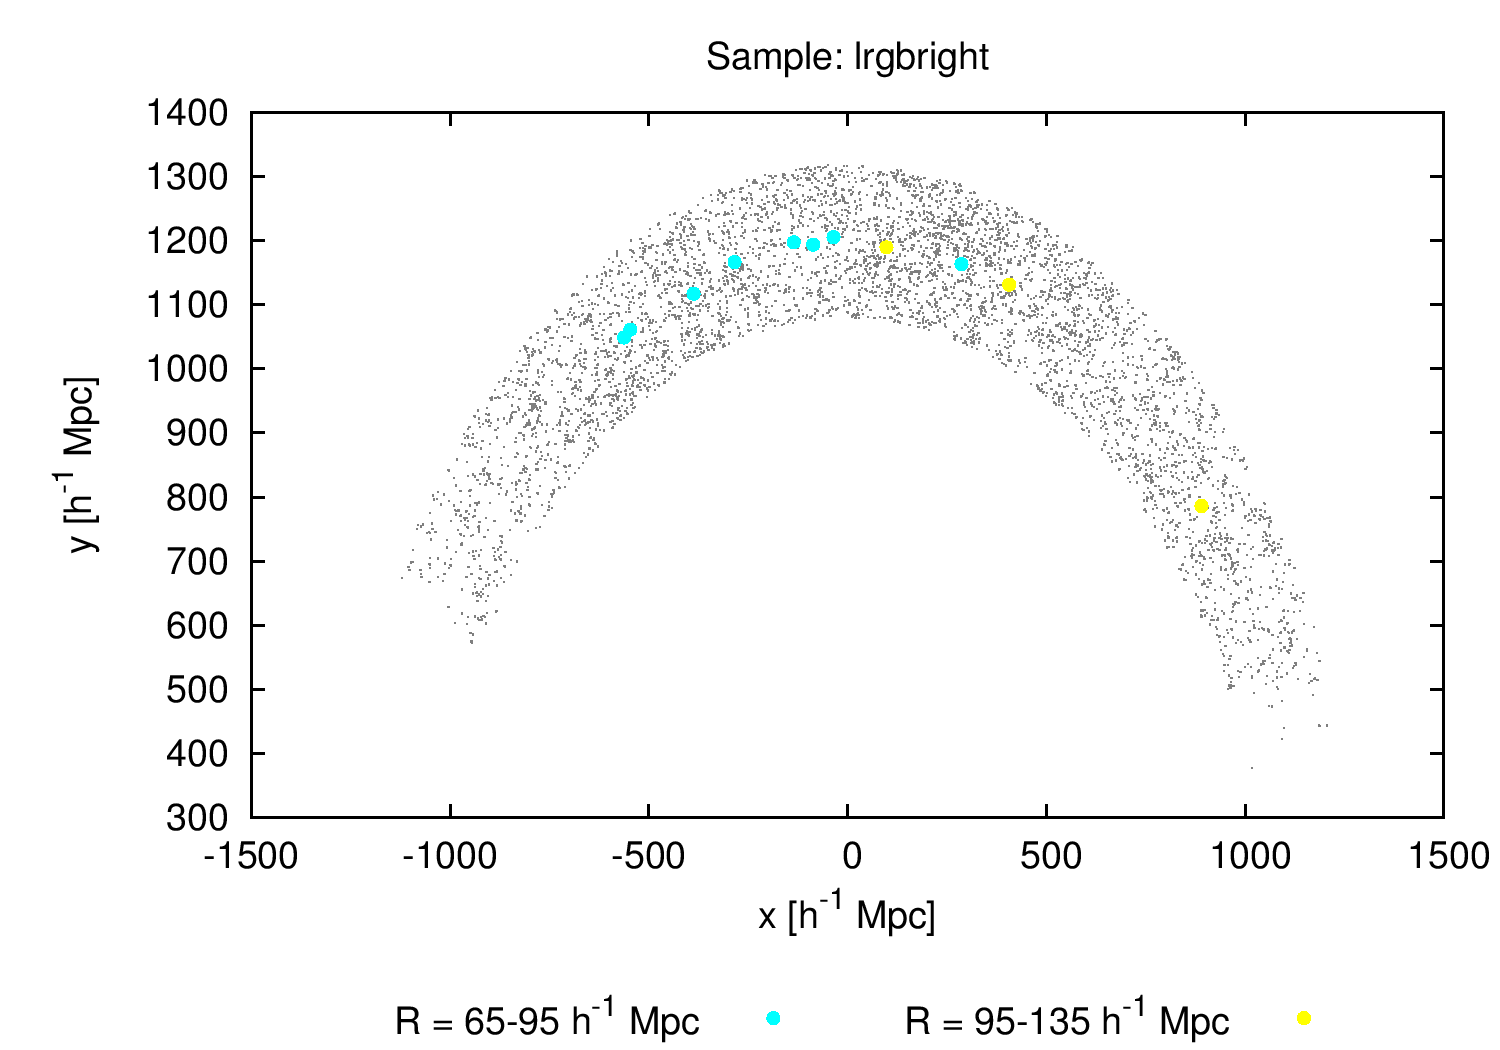
We immediately notice that voids naturally avoid the edges of the survey volume, with the exception of the lower-redshift boundary, where high-redshift samples include low-redshift galaxies in order to capture as many voids near the boundaries as possible. Voids that intersect the edges tend to be smaller, and we remove from the catalog any voids smaller than the mean galaxy separation. This is especially evident in the lrgbright subsample: since the mean galaxy separation is so large compared to the redshift extent of the subsample, we only find the few voids near the median redshift. Despite this natural edge-avoidance, as we will see below there are still voids that need to be removed to produce a fully bias-free sample. We do not find any voids in any sample in the southern sky; the survey slices are so thin that they truncate any identified void there.
The surviving voids distribute as expected: we clearly see smaller voids “hugging” the edges of filaments and sheets, while larger voids inhabit the more expansive empty regions of the survey. As we move to higher-redshift and sparser samples, we see ever-larger void sizes, although for each sample the same general distribution of smaller and larger voids applies. In all samples, we tend to find more small voids near the boundaries, since the mask tends to miss small voids while truncating larger voids, making them appear smaller.
Figure 7 shows the size distribution of voids in each of our samples. While we see the same number of large voids in the dim1 and dim2 samples as in the study of Pan et al. (2012), which used a single volume-limited sample out to , we see many smaller voids because we are using an extra low-redshift subsample. Each successively higher-redshift sample produces larger voids. Our smallest voids, in the dim1 sample, have effective radii Mpc, while the very largest in the lrgdim reach Mpc. This is caused by several factors. First, brighter galaxies are more strongly biased, which can lead to larger voids at higher redshifts. Second, shot noise is larger in a sparser sample, and some void sizes may be enhanced by including regions that are underdense because of sampling effects, but Bos et al. (2012) find that this is a small effect. Third, at lower redshifts the ratio of survey surface area to volume is much higher; this truncates any potential large void at low redshift. Finally, there is a simple volume effect: if a void of a given size has a given probability to occupy a region of space due to cosmic variance, we require a certain minimum sample volume to discover it. While there is some overlap of void sizes between adjacent samples, the multiple samples allow us to extract a large range of void sizes.

By removing voids that can intersect the mask after rotation, we mostly affect the smaller voids of each sample. The mask already truncates larger voids so that they tend to appear as smaller voids. Thus, the remaining large voids are unaffected during the production of the central catalog. This is especially true for the lrgbright sample, where the catalog contains only the very largest voids, which all survive in the central catalog. The de-biasing procedure removes of the smaller voids in each sample.
We show binned void number counts as a function of redshift in Figure 8. Below redshift 0.05 we roughly agree with the number counts from the Pan et al. (2012) void catalog, except at the redshift cap of the dim1 sample, where we remove voids near the edge. In the dim2 sample, we count roughly half as many voids as Pan et al. (2012). This is not surprising since we have several strict void criteria: a minimum void size, a maximum density threshold, and a maximum central density threshold. The last criterion removes a significant number of voids, especially in lower-density samples. Thus we include many fewer voids in our catalog, by construction.
Within each volume-limited sample with redshift , the number of voids grows strongly with redshift. Since the volume-limited samples have a fixed number density of galaxies throughout the redshift range, we expect to be able to count all the smaller — and more common — voids as we probe to higher redshifts within the samples. This trend is not as strong for the LRG-based samples, since we can only identify very large voids. For the lrgbright sample, our voids are confined to a very narrow redshift range centered on . Within each sample the number density per unit volume remains relatively constant. However, between slices the number density drops as we lose the smallest voids due to the reduced galaxy number densities.

We see the strongest effect of cutting out biased voids at the redshift caps of each sample: we remove of the voids at the highest redshift ranges of each sample and only a small fraction of the voids within the bulk of the sample volume. The surface area of each redshift boundary is much larger than the line-of-sight boundaries; thus, we expect to remove more truncated voids here.
Table 4 summarizes the void volumes versus the available volume for each sample, where we list the sample volume, void fraction, central sample volume, and central void fraction. We calculate the sample volume by including any regions of the survey mask. Since our void finding approach builds voids to the very edge of the survey, this gives us the effective usable sample volume. The void fraction is the ratio of the total volume of all voids in that sample to the usable sample volume. The central sample volume is an estimate of the usable volume after we have removed voids near the edge, and the central void fraction is the ratio of the total volume of voids in the central sample of voids to the central sample volume.
5. Radial profiles
We now move to another example data product of our catalog: radial profiles. We build radial profiles of the mean density in thin spherical shells of several stacks of voids. Each stack contains voids with radii within a 5 Mpc range. To construct the stacks, we reposition each void such that their barycenters coincide and rotate them so that their directions along the line of sight share a common vector. We show these profiles in Figure 9. In this figure, we show stacks from the all-void catalog in solid lines and stacks from central voids with dotted lines. We also show the number of voids in the given stack. To construct these, we do not rescale the voids, since the radial bin widths are small compared to the sizes of the voids, and rescaling voids requires difficult calibration of the normalization. We have normalized each density profile to the mean number densities of galaxies in the sample, .


These stacked void profiles clearly show a qualitatively similar behavior across all void sizes: an extremely underdense center (by construction), a steep wall, a large compensation at the wall, and a gradual decline to the mean density. These radial profiles reflect the qualitatively universal behavior of densities inside the shell region seen in Lavaux & Wandelt (2012). The steep walls observed here are expected in line with other observations: we are building profiles based on a relatively sparse sampling of the underdensity, so we expect voids from observations to have sharply-defined edges and large gradients at the walls (Fillmore & Goldreich 1984; Benson et al. 2003; Furlanetto & Piran 2006). Indeed, our profiles are similar to those found in previous works based on earlier observations and mock galaxy catalogs (e.g. Hoyle & Vogeley 2004; Padilla et al. 2005). The density profile shown in Pan et al. (2012) does not show the characteristic overdensity because their voids are based on overlapping spherical underdensities and they average together and rescale voids of all sizes. Simulations, which probe the underlying dark matter distribution with high sampling density, produce voids with shallower walls (e.g., Colberg et al. 2005; Lavaux & Wandelt 2012).
In some cases the density profile drops below the mean density at large distances, especially for the largest voids in the stack. This is especially apparent in the lrgbright sample, which never reaches the mean density (see the lower panel of Figure 6). While we have constructed our catalog such that the interiors of voids do not include any regions outside the survey, at large radial distances from the void center we eventually encounter the mask, where the spherically-averaged mean density drops precipitously. However, this is only a minor issue affecting the largest radii for all the other stacks.
Even though we construct our voids to have mean overdensities of , the radial profiles reach the mean density at much smaller radii. Since voids are elliptical, with a mean ratio of major to minor axis of two (Lavaux & Wandelt 2010), we expect spherical profiles to reach the void wall along the minor axis first, producing a steeper profile. Also, since we are stacking voids of different sizes without rescaling, the smaller voids will add to the density at smaller radii, again producing steeper profiles.
The effects of shot noise are apparent in stacks that contain few voids. For example, the Mpc stack of bright2 voids contains only five voids, and a single void with an excess of galaxies near the center drives up the stacked density profile in that region.
6. Projections
Our fourth and final example derived data product is projections of stacked voids, which are useful — after appropriate rescaling onto the sky — for analyses such as probing the ISW effect in CMB observations (e.g., Thompson & Vishniac 1987; Granett et al. 2008) and reconstruction of the undistorted void shape. We show in Figure 10 the projected density maps of stacked voids for various bin sizes. To construct these we assume a flat sky approximation within the area of the projected stacked void. In cases where multiple samples produce voids within the same radial bin, we have combined their voids into a single projection. We take all galaxies within a spherical region with radius twice that of the void effective radius.
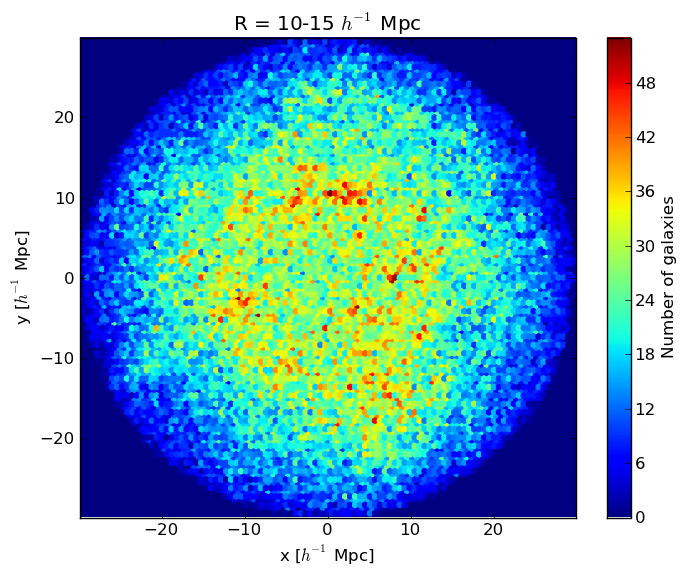
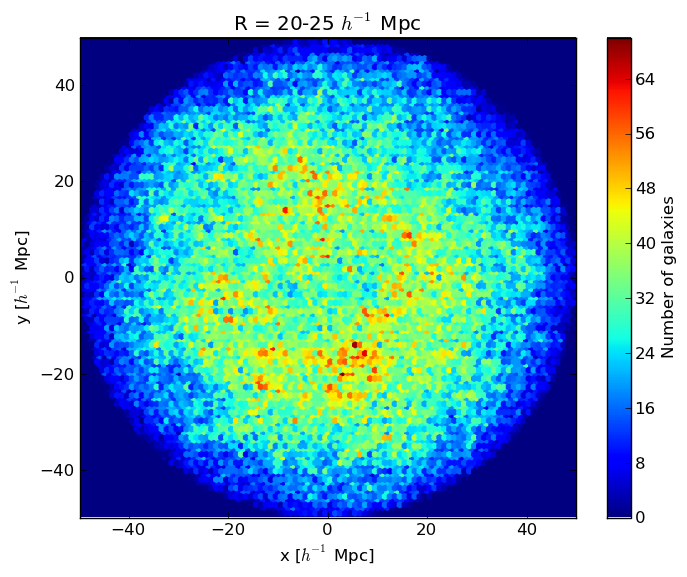
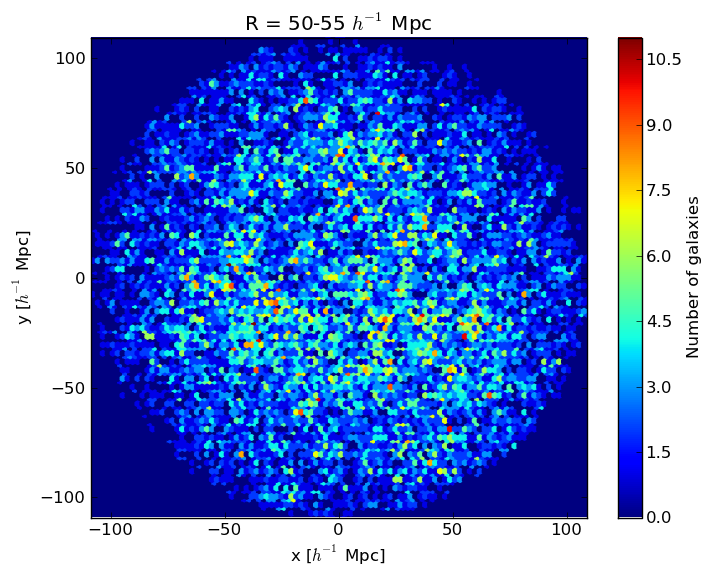
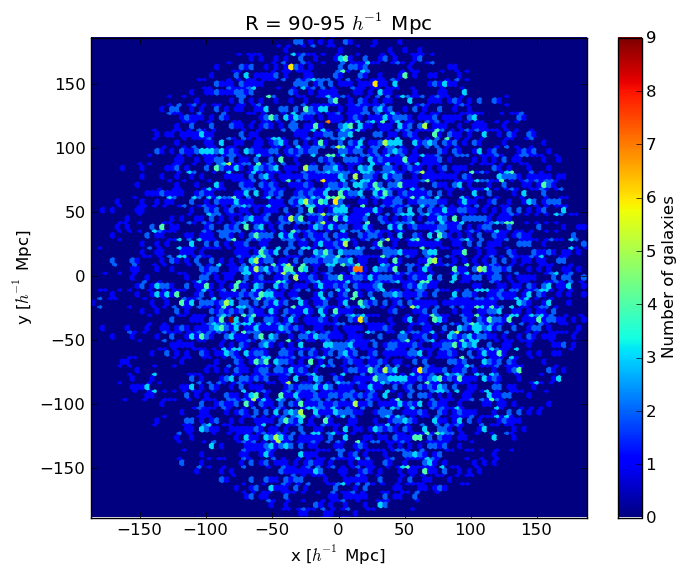
As with the radial profiles, we see a qualitatively similar distribution that roughly scales with void size: a minimum-density core, a strongly-defined inner wall, and a gradual decrease in density. The signal quickly degrades as we move to lower-density samples: the voids structure is barely visible in the Mpc stack and altogether lost to Poisson noise in the Mpc stack. However, these projections reveal structures not apparent in the azimuthally-averages radial profiles. Distortions or elongations in the wall structure will simply appear as wider compensation regions in the profiles but will be immediately noticeable here. Also, these projections effectively remove any cosmology dependence of the void shape, since we have projected them along the redshift direction.
7. Conclusions
We have modified the parameter-free void finding algorithm ZOBOV to account for the survey boundaries and internal masks in observational data sets. This prevents voids from growing past the survey boundary or into any internal masks. Thus our approach is more generally applicable to any given survey and mask. To demonstrate our technique we have constructed the first public void catalog using the full extent of the SDSS DR7 spectroscopic survey, including the LRGs. We combined multiple volume-limited samples of the SDSS galaxy catalogs to maximize the number of discovered voids. We have produced two catalogs: one catalog that includes all discovered voids, including truncated voids near the survey boundaries, and a central catalog, which removes voids with questionable shapes and alignments.
The general statistics of our void catalog, such as number counts as a function of redshift and size distributions, broadly agree with — but significantly extend — both past analyses of observational data (e.g., Muller et al. 2000; van de Weygaert et al. 2011; Pan et al. 2012; Patiri et al. 2012) and results from simulations (e.g., Dubinski et al. 1993; Park & Lee 2007). In addition, radial profiles and projections of stacked voids show a qualitatively similar shape across the entire sample and agree well with previous efforts.
Due to the relatively poor sampling and the high redshift of the LRG samples, the topological voids we identify there may not be strict cosmological features understood as underdensities bounded by filaments and walls. We may also be overestimating the size of these voids and possibly miscalculating their centers. However, the largest voids found in the main sample ( Mpc) overlap with the size distribution of voids from the lrgdim sample, indicating that there is at least some correspondence between the void populations in these samples. Also, our radial profiles show a qualitatively universal shape in all volume-limited subsamples (excepting the lrgbright sample), which again is a point of evidence that these are truly cosmic voids (note especially the similarity in shape in the Mpc bin of Figure 9). In either case, these structures are useful for many kinds of analysis (e.g., Granett et al. 2008).
Our catalogs are useful for many pursuits, including studies of the ellipticity distribution of voids, correlations of void positions with CMB fluctuations, Alcock-Paczynski tests using the shapes of voids in redshift space, and studies of the properties of galaxies within voids. We have constructed useful data sets to enable these studies, such as catalogs of void galaxies, void stacks of various radial sizes, and two-dimensional projections of void densities. We have constructed these data sets using both all discovered voids and a central void catalog free from survey edge effects.
We are making our catalogs and data products publicly available at http://www.cosmicvoids.net.
Acknowledgments
PMS and BDW acknowledge support from NSF Grant AST-0908902. GL acknowledges support from CITA National Fellowship and financial support from the Government of Canada Post-Doctoral Research Fellowship. Research at Perimeter Institute is supported by the Government of Canada through Industry Canada and by the Province of Ontario through the Ministry of Research and Innovation. DW acknowledges support from NSF Grant AST-1009505. This material is based upon work supported in part by NSF Grant AST-1066293 and the hospitality of the Aspen Center for Physics.
Some of the results in this paper have been derived using the HEALPix (Gorski et al. 2005) package.
Funding for the Sloan Digital Sky Survey (SDSS) has been provided by the Alfred P. Sloan Foundation, the Participating Institutions, the National Aeronautics and Space Administration, the National Science Foundation, the U.S. Department of Energy, the Japanese Monbukagakusho, and the Max Planck Society. The SDSS Web site is http://www.sdss.org/.
Appendix A Layout of the Catalog
We provide the catalog as a single downloadable gzip-archived file at http://www.cosmicvoids.net. Most files are in human-readable ASCII format, with the exception of the raw ZOBOV-generated catalog in binary and the projections which are NumPy array files.
There are two top-level directories within the catalog: figures and sdss_dr7. sdss_dr7 contains the void catalog and subsequent analysis as presented in this paper. The figures directory contains data files necessary to reproduce the figures found in this paper.
We divide the catalog into directories based on each of our six volume-limited subsamples. Each directory contains the complete ZOBOV void catalog (i.e., without any size or density cuts). For each sample there are four files which describe the voids and their member zones and galaxies: one text file which lists the voids, two binary files which link voids to zones and zones to particle members, and finally a binary file which contains the galaxy positions of the volume-limited sample. Note that there are two void description files, corresponding to the all and central void catalogs. To aid in parsing these files, we provide a small exampling catalog reading routine in C, dumpVoidParticles.
Each sample directory also contains two subdirectories: all and central, which only include voids after size and density cuts. Each of these subdirectories contains two text files: centers.txt and sky_positions.txt, which describe the coordinates and properties of each void.
The figures directory contains data files which can be used to reproduce various figures in this paper. The file names indicate the figure and whether they are from the central or all catalog.
An alternate catalog, called lcdm, is available and contains only a raw ZOBOV void catalog where galaxy positions are converted to real space using a CDM cosmology.
References
- Abazajian et al. (2009) Abazajian, K. N. et al. 2009, ApJS, 182, 543
- Aikio & Mahonen (1998) Aikio, J. & Mahonen, P. 1998, ApJ, 497, 534
- Alcock & Paczynski (1979) Alcock, C. & Paczynski, B. 1979, Nature, 281, 358
- Aragon-Calvo & Szalay (2012) Aragon-Calvo, M. A. & Szalay, A. S. 2012, ArXiv e-prints: 1203.0248
- Benson et al. (2003) Benson, A. J., Hoyle, F., Torres, F., & Vogeley, M. S. 2003, MNRAS, 340, 160
- Berlind & Weinberg (2002) Berlind, A. A. & Weinberg, D. H. 2002, ApJ, 575, 587
- Biswas et al. (2010) Biswas, R., Alizadeh, E., & Wandelt, B. 2010, Phys. Rev. D, 82
- Blanton et al. (2005) Blanton, M. R. et al. 2005, The Astronomical Journal, 129, 2562
- Bos et al. (2012) Bos, E. G. P., van de Weygaert, R., Dolag, K., & Pettorino, V. 2012, MNRAS, 426, 440
- Ceccarelli et al. (2006) Ceccarelli, L., Padilla, N. D., Valotto, C., & Lambas, D. G. 2006, MNRAS, 373, 1440
- Colberg et al. (2005) Colberg, J. M., Sheth, R. K., Diaferio, A., Gao, L., & Yoshida, N. 2005, MNRAS, 360, 216
- Colberg et al. (2008) Colberg, J. M. et al. 2008, MNRAS, 387, 933
- Cruz et al. (2008) Cruz, M., Martínez-González, E., Vielva, P., Diego, J. M., Hobson, M., & Turok, N. 2008, MNRAS, 390, 913
- Dubinski et al. (1993) Dubinski, J., da Costa, L. N., Goldwirth, D. S., Lecar, M., & Piran, T. 1993, ApJ, 410, 458
- Eisenstein et al. (2001) Eisenstein, D. J. et al. 2001, AJ, 122, 2267
- Fillmore & Goldreich (1984) Fillmore, J. A. & Goldreich, P. 1984, ApJ, 281, 9
- Forero-Romero et al. (2009) Forero-Romero, J. E., Hoffman, Y., Gottlöber, S., Klypin, A., & Yepes, G. 2009, MNRAS, 396, 1815
- Foster & Nelson (2009) Foster, C. & Nelson, L. A. 2009, ApJ, 699, 1252
- Furlanetto & Piran (2006) Furlanetto, S. R. & Piran, T. 2006, MNRAS, 366, 467
- Gaite (2009) Gaite, J. 2009, JCAP, 2009, 004
- Goldberg & Vogeley (2004) Goldberg, D. M. & Vogeley, M. S. 2004, ApJ, 605, 1
- Gorski et al. (2005) Gorski, K. M., Hivon, E., Banday, A. J., Wandelt, B. D., Hansen, F. K., Reinecke, M., & Bartelmann, M. 2005, ApJ, 622, 759
- Gottlober et al. (2003) Gottlober, S., Lokas, E. L., Klypin, A., & Hoffman, Y. 2003, MNRAS, 344, 715
- Granett et al. (2008) Granett, B. R., Neyrinck, M. C., & Szapudi, I. 2008, ApJ, 683, L99
- Gregory & Thompson (1978) Gregory, S. A. & Thompson, L. A. 1978, ApJ, 222, 784
- Gurzadyan et al. (2009) Gurzadyan, V. G., Kashin, A. L., Khachatryan, H. G., Kocharyan, A. A., Poghosian, E., Vetrugno, D., & Yegorian, G. 2009, A&A, 506, L37
- Hausman et al. (1983) Hausman, M. A., Olson, D. W., & Roth, B. D. 1983, ApJ, 270, 351
- Hoffman & Shaham (1982) Hoffman, Y. & Shaham, J. 1982, ApJ, 262, L23
- Hoyle & Vogeley (2004) Hoyle, F. & Vogeley, M. S. 2004, ApJ, 607, 751
- Kazin et al. (2010) Kazin, E. A. et al. 2010, ApJ, 710, 1444
- Kirshner et al. (1981) Kirshner, R. P., Oemler, A., Schechter, P. L., & Shectman, S. A. 1981, ApJ, 248, L57
- Komatsu et al. (2011) Komatsu, E. et al. 2011, ApJS, 192, 18
- Kreckel et al. (2011) Kreckel, K., Ryan Joung, M., & Cen, R. 2011, ApJ, 735, 132
- Lavaux & Wandelt (2010) Lavaux, G. & Wandelt, B. D. 2010, MNRAS, 403, 1392
- Lavaux & Wandelt (2012) —. 2012, ApJ, 754, 109
- Lee & Park (2006) Lee, J. & Park, D. 2006, ApJ, 652, 1
- Li et al. (2012) Li, B., Zhao, G.-B., & Koyama, K. 2012, MNRAS, 421, 3481
- Li & Zhao (2009) Li, B. & Zhao, H. 2009, Phys. Rev. D, 80
- Muller et al. (2000) Muller, V., Arbabi-Bidgoli, S., Einasto, J., & Tucker, D. 2000, MNRAS, 318, 280
- Neyrinck (2008) Neyrinck, M. C. 2008, MNRAS, 386, 2101
- Padilla et al. (2005) Padilla, N. D., Ceccarelli, L., & Lambas, D. G. 2005, MNRAS, 363, 977
- Padmanabhan et al. (2008) Padmanabhan, N. et al. 2008, ApJ, 674, 1217
- Pan et al. (2012) Pan, D. C., Vogeley, M. S., Hoyle, F., Choi, Y.-Y., & Park, C. 2012, MNRAS, 421, 926
- Paranjape et al. (2012) Paranjape, A., Lam, T. Y., & Sheth, R. K. 2012, MNRAS, 420, 1648
- Park & Lee (2007) Park, D. & Lee, J. 2007, ApJ, 665, 96
- Park & Lee (2009) —. 2009, MNRAS, 400, 1105
- Patiri et al. (2012) Patiri, S. G., Betancort-Rijo, J., & Prada, F. 2012, A&A, 541, L4
- Platen et al. (2007) Platen, E., van de Weygaert, R., & Jones, B. J. T. 2007, MNRAS, 380, 551
- Platen et al. (2008) —. 2008, MNRAS, 387, 128
- Platen et al. (2011) Platen, E., van de Weygaert, R., Jones, B. J. T., Vegter, G., & Calvo, M. A. A. 2011, MNRAS, 416, 2494
- Plionis & Basilakos (2002) Plionis, M. & Basilakos, S. 2002, MNRAS, 330, 399
- Ryden (1995) Ryden, B. S. 1995, ApJ, 452, 25
- Ryden & Melott (1996) Ryden, B. S. & Melott, A. L. 1996, ApJ, 470, 160
- Sahni et al. (1994) Sahni, V., Sathyaprakah, B. S., & Shandarin, S. F. 1994, ApJ, 431, 20
- Schmidt et al. (2001) Schmidt, J. D., Ryden, B. S., & Melott, A. L. 2001, ApJ, 546, 609
- Shoji & Lee (2012) Shoji, M. & Lee, J. 2012, ArXiv e-prints
- Sousbie (2011) Sousbie, T. 2011, MNRAS, 414, 350
- Strauss et al. (2002) Strauss, M. A. et al. 2002, AJ, 124, 1810
- Thompson & Vishniac (1987) Thompson, K. L. & Vishniac, E. T. 1987, ApJ, 313, 517
- Thompson & Gregory (2011) Thompson, L. A. & Gregory, S. A. 2011
- Tikhonov & Karachentsev (2006) Tikhonov, A. V. & Karachentsev, I. D. 2006, ApJ, 653, 969
- Tinker & Conroy (2009) Tinker, J. L. & Conroy, C. 2009, ApJ, 691, 633
- Vadas (1998) Vadas, S. L. 1998, MNRAS, 299, 285
- van de Weygaert (2007) van de Weygaert, R. 2007, ArXiv e-prints: 0707.2877
- van de Weygaert et al. (2011) van de Weygaert, R. et al. 2011, Environment and the Formation of Galaxies: 30 years later, ed. I. Ferreras & A. Pasquali, Astrophysics and Space Science Proceedings (Berlin, Heidelberg: Springer Berlin Heidelberg)
- Way et al. (2011) Way, M. J., Gazis, P. R., & Scargle, J. D. 2011, ApJ, 727, 48
- White et al. (1987) White, S. D. M., Frenk, C. S., Davis, M., & Efstathiou, G. 1987, ApJ, 313, 505
- Zehavi et al. (2011) Zehavi, I. et al. 2011, ApJ, 736, 59