Optical properties of the iron-pnictide analog BaMn2As2
Abstract
We have investigated the infrared and Raman optical properties of BaMn2As2 in the -plane and along the -axis. The most prominent features in the infrared spectra are the and phonon modes which show clear TO-LO splitting from the energy loss function analysis. All the phonon features we observed in infrared and Raman spectra are consistent with the calculated values. Compared to the iron-pnictide analog Fe2As2, this compound is much more two-dimensional in its electronic properties. For -axis, the overall infrared reflectivity is insulating like. Within the -plane the material exhibits a semiconducting behavior. An energy gap =48 meV can be clearly identified below room temperature.
pacs:
74.25.Gz, 74.70.Xa, 74.25.Jb, 74.20.RpI Introduction
The discovery of superconductivity in layered LaFeAsO0.9F0.1 four years ago has brought a new trend to synthesize and study new materials which are analogous to this compound.Hosono08 ; David10 By now, most of the interest is focussed on the materials as “122”-type, Fe “111”-type and Fe “11”-type which have high superconducting transition temperature and can be obtained as high-quality single crystals. Only few studies have been reported on low pnictide compounds or those that do not show superconductivity at all.David10 ; Ronning08 ; Nath10 ; Singh09-1 Among those is BaMn2As2, that has the same tetragonal ThCr2Si2-type structure as Fe2As2 at room temperature and undergoes no structural transition upon cooling.Singh09-1 The antiferromagnetic order appears at K; i.e. at much higher temperature than for the Fe2As2 compounds.Singh09-2 While most of the parent compounds are metallic, BaMn2As2 is a semiconductor with a small band gap 27 meV according to -resistivity measurement.Singh09-1 An suggested that the difference in magnetic and electronic properties compared to those of Fe2As2 is due to the strong Hund’s coupling, the stability of the half-filled -shell of the Mn2+ ( ion) and strong spin-dependent Mn-As hybridization.An09
In this paper, we present mainly the infrared studies on BaMn2As2 single crystals with the electric field polarized within the -plane and parallel to the -axis. The sample with a size of was grown out of Sn fluxes. The magnetic, transport, and thermal properties of our material have been reported recently.Singh09-1 ; Singh09-2 For the infrared reflectance measurements, we cleaved the crystal within the -plane and finely polished the -plane in order to get shiny surfaces. The temperature dependent reflectivity spectra were measured in a wide frequency range from 40 to 37 000 cm-1 using Fourier-transform infrared spectrometers ( cm-1) and a variable-angle spectroscopic ellipsometer ( cm-1, restricted to room temperature). Raman spectra were measured using Jobin-Yvon T64000 spectrometer equipped with a microscope at room temperature. We used 514.5 nm Ar-laser excitation line with intensity below 1 mW. Spectra were measured in (a,a) and (b,b) polarizations. Several infrared and Raman phonon modes are assigned and compared to the calculated values.
II Experimental result and discussion
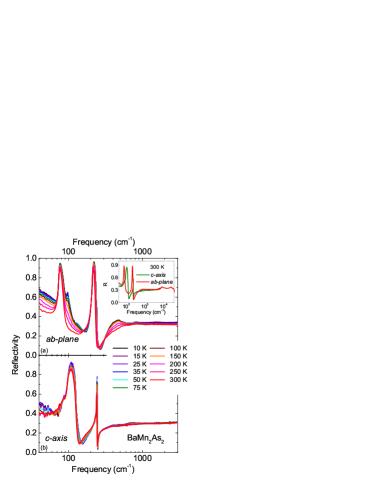
In the inset of Fig. 1, we plot the room temperature reflectivity for both -plane and -axis polarization in the entire measured frequency range (40 to 37 000 cm-1). As approaching the zero frequency, shows an upturn towards unity reflectance while tends to keep a constant value of approximately 40%. The rather low overall reflectivity ( 30%) indicates that BaMn2As2 is a rather bad metal or a semiconductor. Besides the pronounced phonon vibrations in far-infrared region which we will discuss in detail later in this paper, two interband transition can be identified at approximately 7000 cm-1 (0.87 eV) and 26 000 cm-1 (3.2 eV).Wu09 ; Li08 The temperature dependence of the reflectivity spectra is displayed in Fig. 1(a) and (b). In the -plane, the reflectivity below 700 cm-1 increases with decreasing temperature, indicating a metallic behavior. This is consistent with the -resistivity measurement reported in Ref. 5. Only a very small temperature dependence is observed along the -axis due to the less conducting property.
II.1 Phonon vibrations
| Mode | CaFe2As2 | SrFe2As2 | BaFe2As2 | EuFe2As2 | BaMn2As2 |
| A1g | 189 | 182 | 174 | ||
| B1g | 211 | 204 | 209 | ||
| Eg | 114 | 124 | |||
| Eg | 264 | 264 | |||
| A2u | 96/131 | ||||
| A2u | 230/243 | ||||
| Eu | 94 | 74/92 | |||
| Eu | 253 , 254 | 260 | 210/238 | ||
| Ref. | 12 | 13 | 14-16 | 8 | this work |
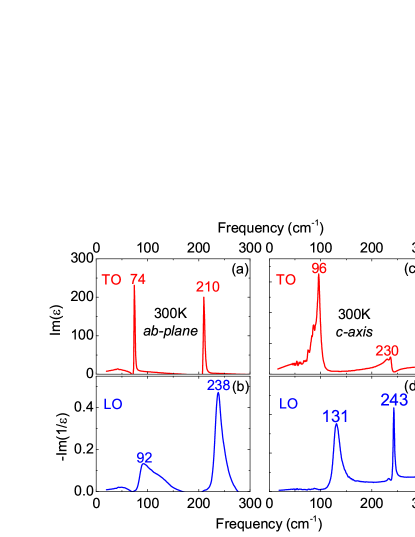
Due to the low reflection and weak absorption of BaMn2As2 in the -polarization, a small fraction (about 5%) of the far-mid infrared light was found to be transmitted through the sample during the quality-check measurement. This prevents us from a correct evaluation of conductivity spectra as commonly done by a Kramers-Kronig analysis.DresselGruner02 Nevertheless, all the pronounced phonon vibration modes show Lorentzian like shapes and thus are applicable for extracting the physics behind. According to the tetragonal ThCr2Si2-type structure (with space group I4/mmm) in which the usually crystallizes, a group theoretical analysis of the phonon modes in BaMn2As2 yields A1g+B1g+2Eg Raman-active, 2A2u+2Eu infrared-active and A2u+Eu acoustic optical zone center phonons, where A/B and E modes correspond to an atomic motion perpendicular and parallel to MnAs planes, respectively.Chu08 ; Krou10 In our infrared spectra, however interestingly, we observe at least four vibration modes both in ab-plane and along the c-axis, as shown in Fig. 1. Thus we extract the imaginary part of the dielectric function and (known as the energy loss function) to identify the possible split transverse optical (TO) and longitudinal optical (LO) modes, respectively.Cardona According to Fig. 2, we can directly label the TO/LO energies to be 74/92 cm-1 and 210/238 cm-1 for two Eu modes, 96/131 cm-1 and 230/243 cm-1 for two A2u modes.
In Fig. 3 we show a room-temperature XX (A1g and B1g modes are allowed) Raman spectrum of BaMn2As2 as obtained in (a,a) and (b,b) polarizations. A pronounced peak can be observed at 174 cm-1. We refer this contribution to the A1g mode which is corresponding to the As-As displacement along c-axis (see also in Fig. 4).
In Table.I a comparison of phonon modes frequencies found in BaMn2As2 and several Fe2As2 (=Ca, Ba, Sr and Eu) compounds is shown. Due to the differences in lattice constant, atomic mass, and possible magnetic interactions (especially for EuFe2As2 and BaMn2As2 ), the vibration frequencies for the same phonon mode are slightly different in these materials.

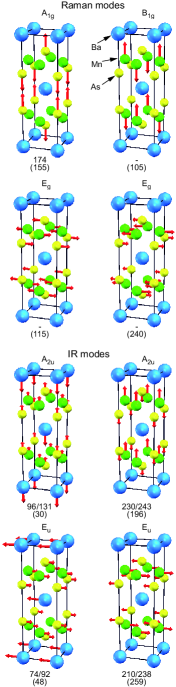
To compare with theoretical values, we also carried out phonon calculations (in the nonmagnetic state (NM)) on the density-functional perturbation theory level within the plane-wave method with the generalized gradient approximation (GGA) of Perdew-Burke-Enzerhof.Baroni01 ; Perdew96 We used the quantum espresso package for the electronic structure calculation with the implemented ultrasoft plane-wave basis set.Giannozzi09 The band occupation was fixed and the literature lattice parameters has been used.Singh09 Only the atomic positions in the unit cell were optimized. The Brillouin zone is sampled in the k space with a uniform Monkhorst-Pack grid (121212).Monkhorst76 In Fig. 4, we display the calculated atomic transverse optical displacements and the measured TO/LO frequencies for all zone center phonons. Note that, in our calculations only a small LO-TO splitting of less than 1 cm-1 could be observed. The reason for such a small splitting and the discrepancy in the frequencies bases mainly on the nonmagnetic state revealing no band gap. An et al.An09 show by using density functional theory that the ground state of BaMn2As2 is antiferromagnetic (AFM) with a small bandgap of about 0.2 eV in the case of GGA calculations. Recent ab inito calculations of the phonon spectrum in the “122” -family including the magnetic interaction lead to a better agreement of the phonon spectrum. Akteurk09 ; Mit09 ; Zbiri09 The difference in the mode frequencies between the NM and the AFM state can exceed 40 cm-1.Kum11 It would be desirable to conduct further calculations including the AFM state which should lead to a small band gap and consequently a bigger LO-TO splitting.An09
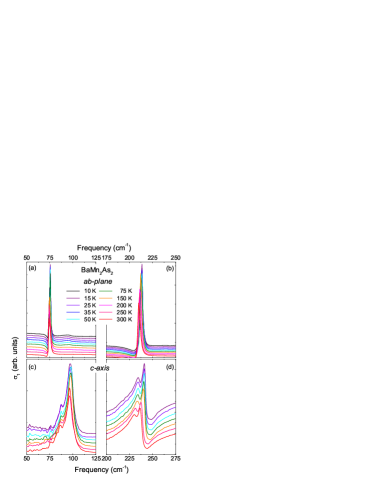
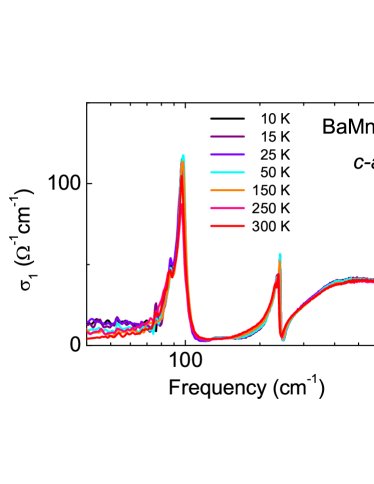
In Fig. 5, no change in the phonon shape is observed for these modes due to the absence of structural transition upon cooling. But the Eu mode with higher vibrational frequency is enhanced in intensity and continuously shift to higher frequencies. Recent neutron diffraction measurement on the thermal contraction revealed that by cooling from 300 K to 10 K, distance decrease from 2.566(2) to 2.558(2).Singh09-2 The lattice distortion with reducing bond lengths enhances the electronic interactions between atoms and therefore the phonon vibrating energy increases – consistent with the observed blue shift of this Eu mode in our spectra.
II.2 Energy gap
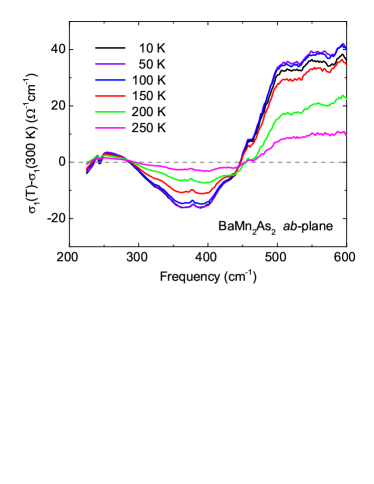
There is an extra broad hump at the frequency around 400 cm-1 in the in-plane reflectivity spectra, as shown in Fig.1(a). According to the phonon calculations, we can exclude it to be a phonon mode. As the optical conductivity spectra of BaMn2As2 are phonon-rich ones, we will here analyze the optical data by looking at the relative change of the conductivity , as plotted Fig. 6, to get rid of the strong phonon oscillations and see basically only the electronic background and consequently the spectral weight redistribution upon varying the temperature. As seen in Fig. 6, around 300 cm-1 drops to negative values with decreasing temperature, then it increases at higher frequency and crosses zero at 440 cm-1 indicating that the spectral weight redistributes from low to high energies. Such a spectral weight rearrangement is the typical signature for an energy gap formation. From the minimum of we estimate the gap value 2 cm-1 (48 meV).Wu09 ; Hu08 Interestingly, Singh et al. recently performed a gap analysis on the -conductivity curve of this material.Singh09-1 There two linear ranges were found in the , and according to the expression two activation energies meV and meV were derived respectively. The gap value we yield from our optical experiments is in accord with the bigger one.footnote2
II.3 Anisotropy
The -axis conductivity (Fig. 7) varies only slightly with temperatures. When 0 cm-1, no Drude like behavior is observed and is quite low, indicating that the material is insulating along the -axis. No transfer of spectral weight is induced by the gap opening. In contrast to iron-pnictides Fe2As2, the present compound BaMn2As2 reveals distinctively different electronic properties for the in-plane and out-of-plane directions, i.e. the material is more two-dimensional. In previous optical studies on BaFe2As2 by Wang and collaborators,Wang10-c the metallic responses were found for both and with an anisotropy-factor about three.remark1 While two spin-density-wave gaps were revealed in the -plane, one of them also opens along the -axis, giving evidence for a three-dimensional Fermi surface in the electronic structure.Wang10-c Furthermore, the low carrier mobility in BaMn2As2 infers more localized charge carriers, in the contrast to the itinerant nature of the electronic properties of Fe2As2. The reason is the antiferromagnetic arrangement of the Mn2+ spins both in the -plane and along the -axis (G-type antiferromagnetic order), where at low temperature the electron hopping between nearest neighbor sites with opposite spin is suppressed and a strong scattering is induced by the spin disorder at high temperature.An09
III Summary
In summary, the optical properties of iron-pnictide analog BaMn2As2 have been studied in detail using light polarized in the -plane and along the -axis. Within the -plane, the material behaves like a poor metal or semiconductor. An energy gap can be defined at =48 meV. The -axis spectra show a typical insulating behavior overall and no energy gap is found. This indicates that the BaMn2As2 is a two-dimensional electron system rather than a quasi three-dimensional, as the Fe-pnictides are considered to be. The and phonon modes have clear TO/LO splitting with frequencies differences of 10-40 cm-1. A systematic comparison between experimental results and theoretical calculations are present for all the infrared and Raman modes.
Acknowledgements.
We thank B. Gorshunov and V. I. Torgashev for very helpful discussions. We appreciate N. Drichko at Johns Hopkins University, Baltimore MD, for performing the Raman measurement. The contributions of J. Braun and D. Rausch to the experiments are appreciated. D.W acknowledges her fellowship by the Alexander von Humboldt Foundation. A.A. acknowledges the support of the German Academic Exchange Service (DAAD) and also Hungarian National Research Fund OTKA NN76727. T.K. acknowledges his scholarship by the Carl-Zeiss-Stiftung. Part of the work was funded by the Deutsche Forschungsgemeinschaft (DFG).References
- (1) Y. Kamihara, T. Watanabe, M. Hirano, and H. Hosono, J. Am. Chem. Soc. 130, 3296 (2008).
- (2) D. C. Johnston, Adv. Phys. 59, 803 (2010).
- (3) F. Ronning, N. Kurita, E. D. Bauer, B. L. Scott, T. Park, T. Klimczuk, R. Movshovich, and J. D. Thompson, J. Phys.:Condens. Matter 20, 3422033 (2008)
- (4) R. Nath, V. O. Garlea, A. I. Goldman, D. C. Johnston, Phys. Rev. B 81, 224513 (2010).
- (5) Y. Singh, A. Ellern, and D. C. Johnston, Phys. Rev. B 79, 094519 (2009).
- (6) Y. Singh, M. A. Green, Q. Huang, A. Kreyssig, R. J. McQueeney, D. C. Johnston, and A. I. Goldman, Phys. Rev. B 80, 100403 (2009)
- (7) J. An, A. S. Sefat, D. J. Singh, and M.-H. Du, Phys. Rev. B 79, 075120 (2009).
- (8) D. Wu, N. Barišić, N. Drichko, S. Kaiser, A. Faridian, M. Dressel, S. Jiang, Z. Ren, L. J. Li, G. H. Cao, Z. A. Xu, H. S. Jeevan and P. Gegenwart, Phys. Rev. B 79, 155103 (2009)
- (9) G. Li, W. Z. Hu, J. Dong, Z. Li, P. Zheng, G. F. Chen, J. L. Luo, and N. L. Wang, Phys. Rev. Lett. 101, 107004 (2008).
- (10) M. Dressel and G. Grüner, Electrodynamics of Solids (Cambridge University Press, Cambridge, 2002).
- (11) E. Kroumova, M. I. Aroyo, J. M. Perez-Mato, A. Kirov, C. Capillas, S. Ivantchev and H. Wondratschek, Phase Transition 76, 155-170 (2003).
- (12) K.-Y. Choi, D. Wulferding, P. Lemmens, N. Ni, S. L. Bud‘ko and P. C. Canfield, Phys. Rev. B 78, 212503 (2008).
- (13) A. P. Litvinchuk, V. G. Hadjiev, M. N. Iliev, Bing Lv, A. M. Guloy and C. W. Chu, Phys. Rev. B 78, 060503(R) (2008).
- (14) L. Chauvière, Y. Gallais, M. Cazayous, A. Sacuto, M. A. Méasson, D. Colson and A. Forget, Phys. Rev. B 80, 094504 (2009).
- (15) A. Akrap, J. J. Tu, L. J. Li, G. H. Cao, Z. A. Xu, and C. C. Homes, Phys. Rev. B 80, 180502 (2009).
- (16) A. A. Schafgans, B.C. Pursley, A. d. LaForge, A. S. Sefat, D. Mandrus and D. N. Basov, Phys. Rev. B 84, 052501 (2011).
- (17) P-Y. Yu and M. Cardona, Fundamentals of Semiconductors, Physics and Materials Properties (Springer, 1996).
- (18) In Fig. 2(a) and (b), there are ranges (for example, 170-210 cm-1) where shows negative values. This unphysical phenomenon is caused by the transparent property of sample as we discussed at the beginning of II-A section.
- (19) S. Baroni, S. de Gironcoli, A. Dal Corso and P. Giannozzi, Rev. Mod. Phys. 73, 515-560 (2001).
- (20) J. P. Perdew, K. Burke, and M. Enzerhof, Phys. Rev. Lett. 77, 3865 (1996).
- (21) P. Giannozzi et al., J. Phys.: Condens. Matter, 21, 395502, (2009).
- (22) Y. Singh, M. A. Green, Q. Huang, A. Kreyssig, R. J. McQueeney, D. C. Johnston and A. I. Goldman Phys. Rev. B 80, 100403 (2009).
- (23) H. J. Monkhorst and J. D. Pack, Phys. Rev. B 13, 5188 (1976).
- (24) R. Mittal, S. Rols, M. Zibri, Y. Su, H. Schober, L. Chaplot, M. Johnson, M. Tegel, T. Chatterji, S. Matsuishi, H. Hosono, D. Johrendt and Th. Brueckel, Phys. Rev. B 79, 144516 (2009).
- (25) M. Zbiri, H. Schober, M. R. Johnson, S. Rols, R. Mittal, Y. Su, M. Rotter and D. Johrendt, Phys. Rev. B 79, 064511 (2009)
- (26) E. Aktürk and S. Ciraci, Phy. Rev. B 79, 184523 (2009).
- (27) P. Kumar, A. Bera, D. V. S. Muthu, A. Kumar, U. V. Waghmare, L. Harnagea, C. Hess, S. Wurmehl, S. Singh, B. Bc̈hner and A. K. Sood, J. Phys.: Condens. Matter 23 (2011) 255403.
- (28) W. Z. Hu, J. Dong, G. Li, Z. Li, P. Zheng, G. F. Chen, J. L. Luo and N. L. Wang, Phys. Rev. Lett. 101, 257005 (2008).
- (29) At around 100 cm-1 we observed a similar but very small hump at 10 K and 50 K. It can be due to the formation of a smaller gap 2=12 meV. As this gap-like feature only appears below 75 K, it should be referred to the second gap =6.5 meV measured in -resistivity by Singh et. al in Ref.5.
- (30) Z. G. Chen, T. Dong, R. H. Ruan, B. F. Hu, B. Cheng, W. Z. Hu, P. Zheng, Z. Fang, X. Dai, and N. L. Wang, Phys. Rev. Lett. 105, 097003 (2010).
- (31) In the case of EuFe2As2 the anisotropy was about a factor of 8 (Ref. Wu09, ).