Luminosity Function of High-Mass X-ray Binaries and Anisotropy in the Distribution of Active Galactic Nuclei toward the Large Magellanic Cloud
Аннотация
In 2003–2012, the INTEGRAL observatory has performed long-term observations of the Large Magellanic Cloud (LMC). At present, this is one of the deepest hard X-ray (20–60 keV) surveys of extragalactic fields in which more than 20 sources of different natures have been detected. We present the results of a statistical analysis of the population of high-mass X-ray binaries in the LMC and active galactic nuclei (AGNs) observed in its direction. The hard X-ray luminosity function of high-mass X-ray binaries is shown to be described by a power law with a slope , that in agreement with the luminosity function measurements both in the LMC itself, but made in the soft X-ray energy band, and in other galaxies. At the same time, the number of detected AGNs toward the LMC turns out to be considerably smaller than the number of AGNs registered in other directions, in particular, toward the source 3C 273. The latter confirms the previously made assumption that the distribution of matter in the local Universe is nonuniform.
\englishkeywordshard X-ray sources, high-mass X-ray binaries, active galactic nuclei
2012388492[496]
27 March 2012
1 Introduction
The all-sky survey that has been performed by the INTEGRAL observatory since 2003 in the hard X-ray ( keV) energy band has allowed one not only to discover several hundred new X-ray sources (Krivonos et al. 2007, 2010a; Bird et al. 2010) but also for the first time to carry out a fairly comprehensive analysis of the statistical properties of objects of different classes: active galactic nuclei (Sazonov et al. 2007, 2008), high-mass and low-mass X-ray binaries in the inner region of our Galaxy (Lutovinov et al. 2005; Revnivtsev et al. 2008). Over the last several years, the INTEGRAL observatory has performed ultra deep observations of several regions, virtually reaching the limits of possibilities of coded-aperture telescopes. The next improvement in the sensitivity of hard X-ray sky surveys may be expected only with the advent of grazing-incidence orbital telescopes with new-generation multilayered mirrors (NuSTAR, Astro-H, ART-XC/SRG).
The field toward the Large Magellanic Cloud (LMC) observed with the INTEGRAL instruments in 2003–2004 and 2010–2012 for more than 7 Ms (the effective exposure time was Ms) is among the regions with deep coverage. The primary target in these observations was the remnant of Supernova 1987A in order to record the emission lines of the radioactive decay of synthesized at the time of its explosion (Grebenev et al. 2012a). However, such a long exposure time also made it possible to record more than twenty point hard X-ray sources of different natures (Grebenev et al. 2012b).
The goal of this work is a statistical analysis of high-mass X-ray binaries (HMXBs) in the LMC and active galactic nuclei (AGNs) registered in its direction as well as a comparison of our results with those from observations in other energy bands and in other sky regions.
A detailed description of the data from the IBIS and JEM-X telescopes of the INTEGRAL observatory (Winkler et al. 2003), a complete list of registered sources, their identification, etc. are presented in the paper of Grebenev et al. (2012b). This work is based on the data from the ISGRI detector of the IBIS telescope obtained in the 20–60 keV energy band; the image processing and reconstruction methods are described in Krivonos et al. (2010b).
2 Data analysis
Dec
RA
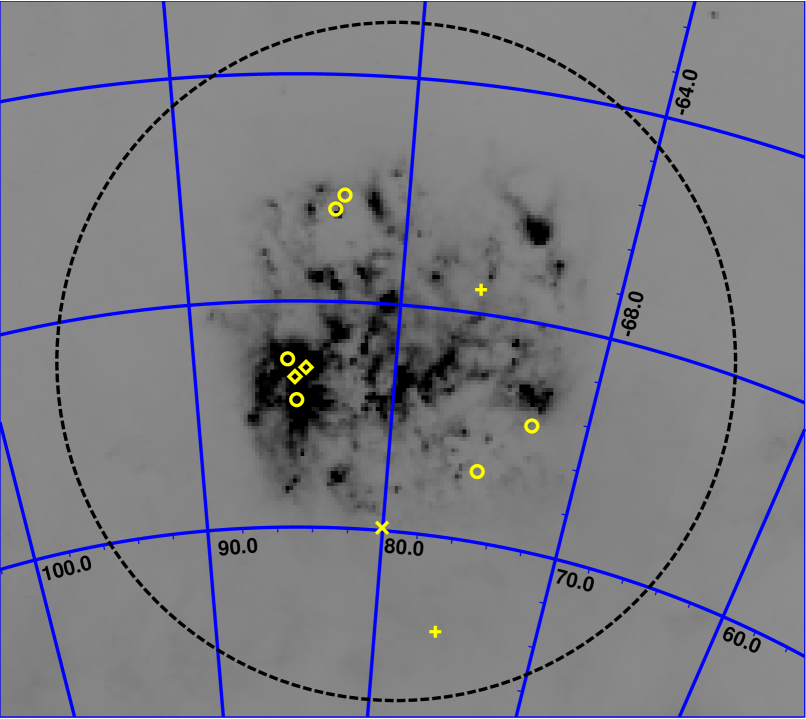
The field of view of the IBIS telescope is fairly wide (). In combination with a special observing technique, whereby each succeeding pointing is shifted by relative to the preceding one (for more details, see Winkler et al. 2003), it allows large sky regions to be covered. In particular, to investigate the population of AGNs, we chose a sky field centered on the LMC (05h 24m, -70) with a radius of 24.5. In this sky field, we registered five AGNs with fluxes erg s-1 cm-2 in the 20–60 keV energy band on the map averaged over the entire time of our observations (four of them had a confidence level , which was the threshold when selecting the sources for our subsequent analysis)111It is necessary to note that totally six extragalactic objects were detected in the direction to LMC (Grebenev et al. 2012b), but the flux of one of them is below erg s-1 cm-2 and the significance of the detection of another one is below .. Figure 1 shows an infrared (IRAS, m) map of the sky field around the LMC that reflects the dust distribution in the galaxy. The positions of the X-ray sources of different classes registered by the INTEGRAL observatory are marked in this figure. The LMC proper is located within the circle with a radius of 6(dashed line). As we see from the figure, the INTEGRAL observatory detected six HMXBs within this region (one more source is a candidate for objects of this class, but since there is no ultimate confirmation of its nature, it was excluded from consideration). All HMXBs were recorded on the averaged map at a confidence level .
Before constructing the log(N)-log(S) distribution, it is necessary to determine the completeness and sensitivity of the survey. In Fig. 2, the area of the survey is plotted against the flux from a source registered at a confidence level (a flux of 1 mCrab in the 20–60 keV energy band corresponds to erg s-1 cm-2 ) for the above two regions: the solid line is for the full field 24.5in radius; the dashed line is for the LMC itself (within the 6radius). We see that the central region has almost uniform coverage down to fluxes of mCrab. At the same time, in the wider region, it is important to take into account the coverage nonuniformity even at fluxes of mCrab. An appropriate correction was done using the method described by Shtykovskiy and Gilfanov (2005).

3 THE HMXB LUMINOSITY FUNCTION
As was shown in several papers (see, e.g., Grimm et al. 2002, 2003; Mineo et al. 2012), the differential luminosity function of HMXBs in galaxies of different types is proportional to the star formation rate (SFR) in the galaxy under consideration and has a universal power-law form,
with a slope in the wide luminosity range erg s-1. This is most likely explained by the fundamental mass-luminosity and mass-radius relations for high-mass stars (Postnov 2003). Thus, the luminosity function is an important tool in investigating both the formation and evolution of binary systems and the influence of different metallicities and chemical compositions in different galaxies on this process (Shtykovskiy and Gilfanov 2005). On the other hand, the luminosity function has usually been and is being constructed in the soft X-ray 1–10 keV energy band, where modern telescopes are sensitive enough to detect a considerable number of objects in neighboring galaxies. However, the luminosity in this energy band constitutes a small fraction of the total luminosity of usually hard and absorbed HMXBs, which can introduce distortions into the derived relations. Therefore, investigating the hard X-ray luminosity function of binaries and comparing it with the results obtained previously are of significant interest, despite the much smaller number of recorded sources and, as a result, the poorer statistics.
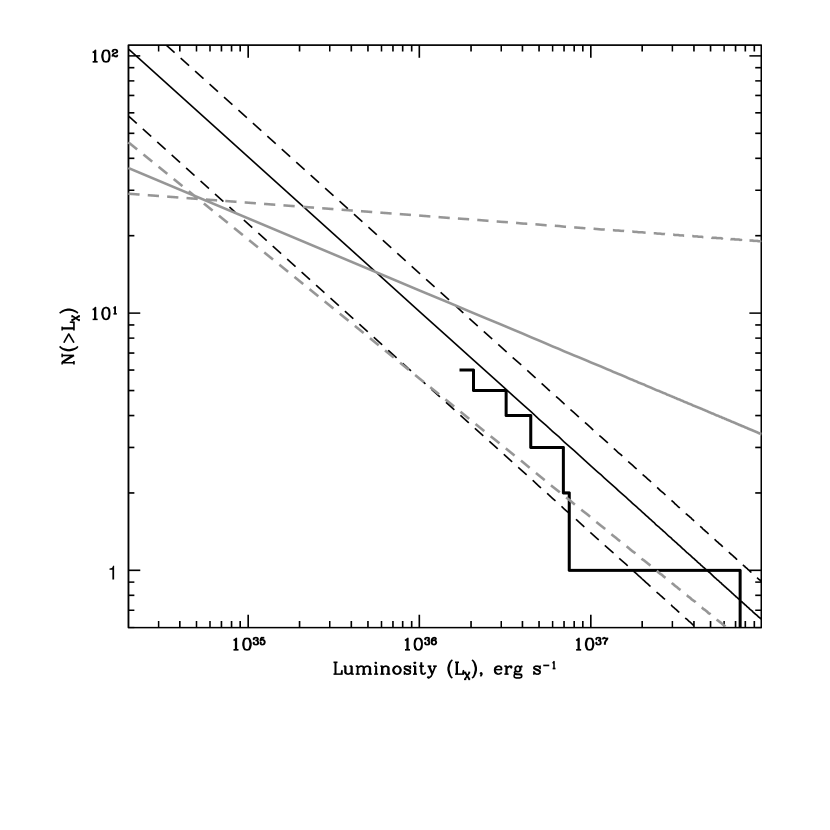
Using the maximum likelihood estimation, we can fit the differential luminosity function of HMXBs in the LMC by the power law (1) with a slope and an expected number of high-luminosity sources erg s-1) . The corresponding cumulative luminosity function is indicated by the histogram in Fig. 3. For comparison, the same figure shows the luminosity functions with and erg s-1) measured from XMM-Newton data (gray lines, Shtykovskiy and Gilfanov 2005) and predicted from the "universal"luminosity function with and erg s-1) (black lines, Grimm et al. 2003). It should be noted that both these functions and their normalizations were obtained in the soft X-ray 2–10 keV energy band for the LMC region observed by the XMM-Newton observatory. To compare them with the luminosity function obtained by the INTEGRAL observatory in the hard 20–60 keV energy band for the entire LMC, we made appropriate renormalizations by assuming the flux ratio for the spectra of typical HMXBs with neutron stars (which are the majority among the objects of this class; Lutovinov et al. 2007) to be (see, e.g., Filippova et al. 2005) and the corresponding star formation rates in the entire LMC and the region covered by the XMM-Newton observatory to be yr-1 and yr-1 , respectively (Shtykovskiy and Gilfanov, 2005). We see from the figure that the INTEGRAL measurements in the range of high luminosities agree satisfactorily both with the soft X-ray results for LMC and with the predictions following from the universality of the HMXB luminosity function. Nevertheless, it should be noted that objects with "atypical"spectra (including black holes and neutron stars as compact objects) are encountered among HMXBs, which can lead to some distortions of the luminosity function when passing from one energy band to the other.
4 Log(N)-Log(S) distribution of AGN
As has been noted above, ultradeep surveys of various sky fields, which allow the detection limit of point sources to be reached with coded-aperture telescopes, are also used to study the distributions of objects of different classes over the sky. In particular, Krivonos et al. (2007) showed that the distribution of AGNs over the sky is not isotropic – the number of AGNs toward the Virgo cluster of galaxies and the Great Attractor exceeds significantly their number in the opposite direction. However, the amount of data available at that time allowed this result to be obtained on a spatial scale of tens of thousands of square degrees. Several series of deep observations of the LMC and the sky field around the source 3C 273 performed in 2008–2012 allowed us to narrow the characteristic scale of the sought-for asymmetry to several hundred or thousand square degrees.

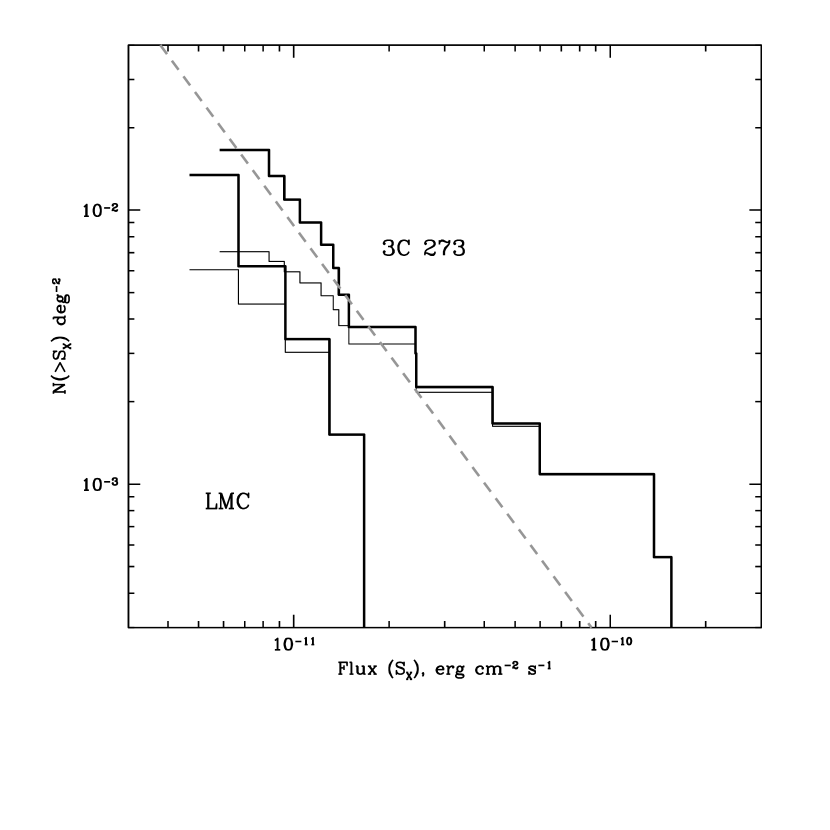
Figure 4 shows the areas of the surveys for the LMC and the sky field around 3C 273 as functions of the flux from a source detected at a confidence level (similar to Fig. 2). We see that the areas of the surveys coincide at high fluxes; however, differences associated with different strategies of the observations begin already at fluxes of mCrab.
The log(N)-log(S) distributions of AGN in both deep fields are shown in Fig. 5. It is seen that in the sky field toward 3C 273, the number of AGNs detected at a statistically significant level () (13 objects) with fluxes erg s-1 cm-2 is more than a factor of 3 larger than that toward the LMC (4 objects). The approximation of the log(N)-log(S) distribution of AGN toward 3C 273 by the function using the maximum likelihood method gives a slope and an expected number of sources with fluxes above 1 mCrab in the 20–60 keV energy band within the circle 24.5in radius. A similar analysis for the sky field toward the LMC gives an expected number of sources with a flux above 1 mCrab in the 20–60 keV energy band within the circle 24.5in radius. For comparison, it should be noted that under the assumption of a uniform distribution of AGNs over the sky, sources with fluxes above 1 mCrab are expected in the circle with a radius of 24.5in the 20–60 keV energy band (Krivonos et al. 2010a).
Note that at low fluxes ( erg s-1 cm-2), the log(N)-log(S) distribution in the region of 3C 273 is in good agreement with the same distribution averaged over the entire sky. At the same time, this field exhibits a clear excess of bright objects, with most of them having low redshifts and being closer than Mpc. The latter confirms the previously made assumption that the local Universe is inhomogeneous.
5 Conclusions
Here, we performed a statistical analysis of the population of HMXBs in the LMC and AGNs registered in its direction. We showed that the hard X-ray (20–60 keV) luminosity function of HMXBs could be fitted by a power law with a slope . This result is in agreement both with the measurements of the luminosity function for HMXBs in the LMC itself, but in the soft X-ray (1–10 keV) energy band, and with the predictions derived from a detailed analysis of a large number of different galaxies.
At the same time, the number of detected AGNs toward the LMC turns out to be considerably smaller than the number of such objects registered in other directions, in particular, toward the source 3C 273. This, along with the excess of bright objects at low redshifts in this direction, confirms the previously made assumption that the mass in the local Universe is distributed nonuniformly (see, e.g., Krivonos et al. 2007).
Acknowledgements.
We are grateful to M.G. Revnivtsev and R.A. Krivonos for helpful discussions. This work was financially supported by the Russian Foundation for Basic Research (project nos. 10-02-1466, 11-02-01328, 11-02-12285-ofi-m-2011, 12-02-01265), the "Nonstationary Phenomena in Objects of the Universe"Program, the Program for Support of Leading Scientific Schools of the President of the Russian Federation (NSh-5603.2012.2), and the State contract no. 14.740.11.0611.Список литературы
- (1)
1. A. Bird, A. Bazzano, L. Bazzani, et al., Astrophys. J. Suppl. Ser. 186, 1 (2010).
2. E. V. Filippova, S. S. Tsygankov, A. A. Lutovinov, and R. A. Syunyaev, Astron. Lett. 31, 729 (2005).
3. S. Grebenev, A. Lutovinov, S. Tsygankov, and C. Winkler, (2012a), in press.
4. S. Grebenev, A. Lutovinov, S. Tsygankov, and I. Mereminskiy, Mon. Not. R. Astron. Soc (2012b), submitted, [arXiv:1207.1750]
5. H.-J. Grimm, M. Gilfanov, and R. Sunyaev, Astron. Astrophys. 391, 923 (2002).
6. H.-J. Grimm, M. Gilfanov, and R. Sunyaev, Mon. Not. R. Astron. Soc. 339, 793 (2003).
7. R. Krivonos, M. Revnivtsev, A. Lutovinov, et al., Astron. Astrophys. 475, 775 (2007).
8. R. Krivonos, S. Tsygankov, M. Revnivtsev, et al., Astron. Astrophys. 523, A61 (2010a).
9. R. Krivonos, M. Revnivtsev, S. Tsygankov, et al., Astron. Astrophys. 519, A107 (2010b).
10. A. Lutovinov, M. Revnivtsev, M. Gilfanov, et al., Astron. Astrophys. 444, 821 (2005).
11. A. Lutovinov, M. Revnivtsev, M. Gilfanov, and R. Sunyaev, in The Obscured Universe, Proceeding the VI INTEGRAL Workshop, Ed. by S. Grebenev, R. Sunyaev, and C. Winkler, ESA SP-622 (2007), p. 241.
12. Mineo S., Gilfanov M., Sunyaev R. MNRAS, 419, 2095 (2012).
13. K. A. Postnov, Astron. Lett. 29, 372 (2003).
14. M. Revnivtsev, A. Lutovinov, E. Churazov, et al., Astron. Astrophys. 491, 209 (2008).
15. S. Sazonov, M. Revnivtsev, R. Krivonos, et al., Astron. Astrophys. 462, 57 (2007).
16. Sazonov S., Krivonos R., Revnivtsev M., et al., Astron. Astrophys. 482, 517 (2008)
17. P. Shtykovskiy and M. Gilfanov, Astron. Astrophys. 431, 597 (2005).
18. C. Winkler, T. Courvoisier, G. Di Cocco, et al., Astron. Astrophys. 411, L1 (2003).