Compact Groups of Galaxies selected by stellar mass:
The
2MASS Compact Group Catalogue
Abstract
We present a photometric catalogue of compact groups of galaxies (p2MCGs) automatically extracted from the 2MASS extended source catalogue. A total of p2MCGs are identified, following the criteria defined by Hickson (1982), of which 230 survive visual inspection (given occasional galaxy fragmentation and blends in the 2MASS parent catalogue). Only one quarter of these 230 groups were previously known compact groups (CGs). Among the 144 p2MCGs that have all their galaxies with known redshifts, 85 (59%) have 4 or more accordant galaxies. This v2MCG sample of velocity-filtered p2MCGs constitutes the largest sample of CGs (with ) catalogued to date, with both well-defined selection criteria and velocity filtering, and is the first CG sample selected by stellar mass. It is fairly complete up to and radial velocity of .
We compared the properties of the 78 v2MCGs with median velocities greater than with the properties of other CG samples, as well as those (mvCGs) extracted from the semi-analytical model (SAM) of Guo et al. (2011) run on the high-resolution Millennium-II simulation. This mvCG sample is similar (i.e. with 2/3 of physically dense CGs) to those we had previously extracted on three other SAMs run on the Millennium simulation with 125 times worse spatial and mass resolutions. The space density of v2MCGs within is , i.e. 4 times that of the Hickson sample (HCG) up to the same distance and with the same criteria used in this work, but still 40% less than that of mvCGs.
The v2MCG constitutes the first group catalogue to show a statistically large first-second ranked galaxy magnitude difference (in units of the dispersion of the first-ranked absolute magnitudes) according to Tremaine-Richstone statistics, as expected if the first ranked group members tend to be the products of galaxy mergers, and as confirmed in the mvCGs. The v2MCG is also the first observed sample to show that first-ranked galaxies tend to be centrally located, again consistent with the predictions obtained from mvCGs. We found no significant correlation of group apparent elongation and velocity dispersion in the quartets among the v2MCGs, and the velocity dispersions of apparently round quartets are not significantly larger than those of chain-like ones, in contrast to what has been previously reported in HCGs.
By virtue of its automatic selection with the popular Hickson criteria, its size, its selection on stellar mass, and its statistical signs of mergers and centrally located brightest galaxies, the v2MCG catalogue appears to be the laboratory of choice to study physically dense groups of 4 or more galaxies of comparable luminosity.
keywords:
catalogues — galaxies: clusters: general — galaxies: interactions1 Introduction
Compact Groups (hereafter, CGs) of at least 4 galaxies of comparable luminosity are the densest galaxy associations known at present. The compactness of these groups is so high that the typical projected separations between galaxies are of the order of their own diameters (Hickson et al., 1992; Focardi & Kelm, 2002), hence their space densities can exceed those of the cores of rich clusters. The combination of their very high number densities and low velocity dispersion makes CGs the ideal site of galaxy mergers (Mamon, 1992, see also Carnevali et al., 1981; Barnes, 1985; Mamon, 1987a; Bode et al., 1993).
Since the discovery of Stephan’s Quintet (Stephan, 1877) and Seyfert’s Sextet (Seyfert, 1948), several surveys of CGs have been undertaken: Rose (1977) and Hickson (1982) performed visual identifications of CGs on the POSS I photographic plates. Thereafter, the new catalogues of CGs used automatic searches: from the COSMOS/UKST Southern Galaxy Catalogue (Prandoni et al., 1994; Iovino, 2002), the DPOSS catalogue (Iovino et al., 2003; de Carvalho et al., 2005), and the Sloan Digital Sky Survey (SDSS) photometric catalogue DR1 (Lee et al., 2004) and DR6 (McConnachie et al., 2009). All of the above studies used only 2-dimensional information of the galaxies (i.e., angular positions). Other CG catalogues were obtained by searches in redshift space, e.g.: Barton et al. (1996) from the the CfA2 catalogue, Allam & Tucker (2000) from the Las Campanas Redshift Survey, Focardi & Kelm (2002) from the UZC Galaxy Catalogue, and Deng et al. (2008) from the SDSS-DR6 spectroscopic catalogue.
Since the nearly full spectroscopic followup by Hickson et al. (1992) of the original Hickson Compact Groups (Hickson, 1982, hereafter, HCGs), the velocity-filtered sample of 92 HCGs with at least 3 accordant-redshift members and 69 with at least 4 has been, by far, the most studied to date (e.g. Hickson et al., 1989 for optical photometry; Mendes de Oliveira & Hickson, 1991 for galaxy morphologies; Moles et al., 1994, de la Rosa et al., 2007 and Tzanavaris et al., 2010 for star formation rates; Coziol et al., 1998 for nuclear activity; de la Rosa et al., 2001 and Torres-Flores et al., 2010 for galaxy scaling relations; Verdes-Montenegro et al., 2001 and Borthakur et al., 2010 for neutral gas content; Ponman et al., 1996 for hot gas content, etc.).
However, the visual inspection performed by Hickson (1982) led to a sample of CGs that is not reproducible, incomplete and not homogeneous (Hickson et al., 1989; Walke & Mamon, 1989; Prandoni et al., 1994; Sulentic, 1997; Díaz-Giménez & Mamon, 2010). In particular, using the outputs of semi-analytical models of galaxy formation run on the Millennium cosmological dark matter simulation (Springel et al., 2005), Díaz-Giménez & Mamon (2010) have shown that the HCG sample is typically less than 10% complete at the median distance of the sample.
The properties of CGs and their member galaxies must be studied using complete and well-defined observed samples. To achieve this goal, we present a new sample of automatically selected CGs extracted from the largest solid angle catalogue at present, the 2 Micron All Sky Survey. Using 2MASS has two strong advantages: 1) it provides us with a full-sky survey and 2) the -band photometry is only weakly sensitive to both galactic extinction, internal extinction and recent star formation, and is thus a very good tracer of the stellar mass content of galaxies. For these reasons, it is ideal to build a CG sample from a wide -band galaxy survey such as 2MASS (which has the additional benefit of being all-sky) with (nearly) full redshift information available from other sources (Mamon, 1994).
The layout of this paper is as follows. In Sect. 2, we describe the parent catalogue. In Sect. 3, we present the CG catalogue. We perform a cross-identification between the 2MASS-CGs and other samples of groups in Sect. 4. In Sect. 5, we present a sample of CG after applying a velocity filtering, while we present some general properties of the samples in Sect. 6, and summarise and discuss our results in Sect. 7.
Throughout this paper we use a Hubble constant , and for all cosmology-dependent calculations, we assume a flat cosmological model with a non-vanishing cosmological constant: and .
2 The parent catalogue: 2MASS XSC
The 2 Micron All Sky Survey (2MASS) (Skrutskie et al., 2006) has uniformly scanned the entire sky in three near-infrared bands to detect and characterise point sources brighter than about 1 mJy in each band, with S/N greater than 10. 2MASS used two highly-automated 1.3-m telescopes, one at Mt. Hopkins, AZ, and one at CTIO, Chile. Each telescope was equipped with a three-channel camera, each channel consisting of a NICMOS3 256256 HgCdTe array, capable of imaging a 8′.5 8′.5 field at a pixel scale of 2′′ per pixel in the (1.25 microns), (1.65 microns), and (2.17 microns) bands.
Our data set was selected from the publicly available full-sky extended source catalogue (XSC; Jarrett et al., 2000)111http://irsa.ipac.caltech.edu/cgi-bin/Gator/nph-dd?catalog=fp_xsc, which contains over million extended objects brighter than . We adopted the “K20 isophotal fiducial elliptical aperture magnitudes” and selected galaxies not flagged as artifacts (cc_flg != ’a’) nor close to large galaxies — thus avoiding spurious fragments in the envelopes of large galaxies (cc_flg != ’z’). There is a strong correlation between dust extinction and stellar density, which increases exponentially towards the Galactic Plane. Stellar density is a contaminant factor of the XSC since the reliability of separating stars from extended sources is very sensitive to this quantity (Jarrett et al., 2000). In order to avoid contamination from stars, we have constructed a mask for the 2MASS survey using the HEALPix (Górski et al., 2005) map with and excluding those pixels where the -band extinction – and , which reduces galactic contaminant sources to 2% (Maller et al., 2005). This filtering on galactic extinction reduced the solid angle from to .
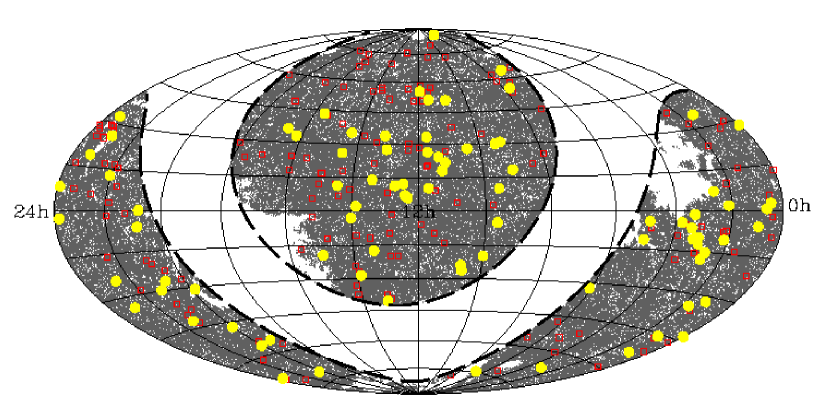
The raw magnitudes were corrected for galactic extinction using the reddening map of Schlegel et al. (1998). We also followed Maller et al. and imposed a cut at in the corrected magnitudes. The sky distribution of these galaxies is shown as the grey points in Fig. 1. These restrictions produced a sample of extended sources which constitute our parent catalogue.
3 The 2MASS CG catalogue
We identify CGs in projection (p2MCGs) by using an automated searching algorithm very similar to that defined by Hickson (1982) which is fully described in Díaz-Giménez & Mamon (2010). Briefly, this algorithm identifies as p2MCGs those systems that satisfy the following criteria:
-
•
(population)
-
•
(compactness)
-
•
(isolation)
-
•
(flux limit)
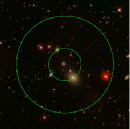
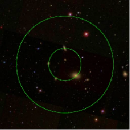
where is the total number of galaxies whose -band magnitude satisfies , and is the apparent magnitude of the brightest galaxy of the group; is the mean -band surface brightness, averaged over the smallest circle circumscribing the galaxy centres; is the angular diameter of the smallest circumscribed circle, and is the angular diameter of the largest concentric circle that contains no other galaxies within the considered magnitude range or brighter. Our compactness criterion is set to match that of the HCG, using a mean colour transformation of (see appendix A).
In order to speed up this computationally extensive algorithm, we used the subroutines of the HEALPix222http://healpix.jpl.nasa.gov package to find neighbours within 5 degrees around each galaxy, and the STRIPACK333http://people.sc.fsu.edu/burkardt/f_src/stripack/stripack.html subroutines to compute the centres and radii of the minimum enclosing circles (hereafter CG centres and CG radii, respectively).
Using this algorithm, we found p2MCGs in the 2MASS XSC, containing 1158 galaxies. We note, as a curiosity, that (binomial errors) of our compact groups with contain a compact quartet core that also meets all the CG criteria. These are, in fact, CGs within CGs. Note that this percentage is significantly lower than the predicted by Díaz-Giménez & Mamon (2010) from the semi-analytical models (with binomial uncertainty less than 0.5%). Following Díaz-Giménez & Mamon, we always choose the larger CG.
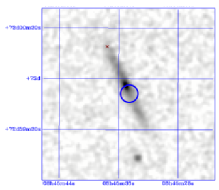
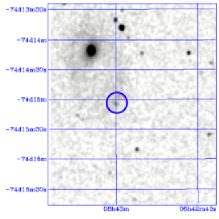
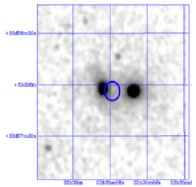
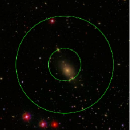
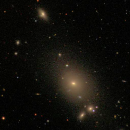
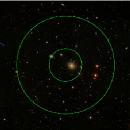
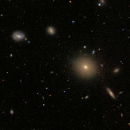
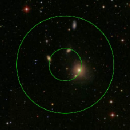
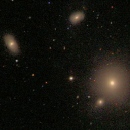
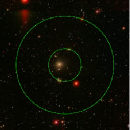
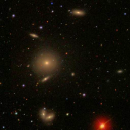
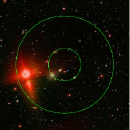
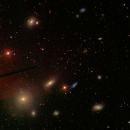
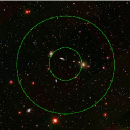
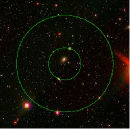
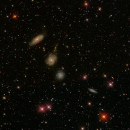
Using the Aladin interactive sky atlas444http://aladin.u-strasbg.fr/java/nph-aladin.pl (Bonnarel et al., 2000) and the Interactive 2MASS image server555http://irsa.ipac.caltech.edu/applications/2MASS/IM/interactive.html, we performed a visual inspection of all of these p2MCGs. We found that there were 26 galaxy misidentifications in the 2MASS XSC: fragments of larger galaxies (often HII regions) or blends of two galaxies. In other words, since 26 galaxies are misidentifications over a total of 1158, then, for our purposes, the 2MASS XSC turned out to be 97.80.4% reliable. Figure 2 shows a few examples of these misidentifications. In Table 1, we list the 26 objects that belonging to CGs were incorrectly classified as galaxies by 2MASS, and also are quoted the names of their host galaxies. We discarded those CGs of 4 members that hosted one of these galaxies. If a misidentified galaxy belonged to a CG with more than 4 members, then only this galaxy is discarded, and all properties of the CG are recomputed and all the criteria are checked again. In total, 20 groups were discarded because of incorrect 2MASS galaxy identifications.
Moreover, 2MASS fails to identify some large galaxies that are close to another large galaxy belonging to a CG. For instance, galaxy NGC 7578A does not appear in the 2MASS XSC, while its pair-neighbour, NGC 7578B, does. The same happened with the following 12 galaxies: NGC0414-NED02, IC0590-NED02, NGC 3750, NGC 4783, NGC 5354, NGC 4796, IC 1165 NED02, ESO 284-IG 041 NED02, ESO596-49, LCRSB210329.4-450104, NGC 7318A, NGC 7318B. These 13 missing galaxies among 1158 detected ones make the 2MASS XSC 99% complete for our purposes. Given the lack of -band magnitudes for these galaxies, we omitted from our sample the 12 CGs containing these 13 galaxies.
| # | Galaxy Name in 2MASS | Main galaxy |
|---|---|---|
| 1 | 2MASXJ185336285643133 | 2MASXJ185336945643078 |
| 2 | 2MASXJ140804393318147 | 2MASXJ140803143318542 |
| 3 | 2MASXJ22355791+3357562 | galaxy pair |
| 4 | 2MASXJ035543804222233 | 2MASXJ035544744222024 |
| 5 | 2MASXJ07271181+8544540 | 2MASXJ07271448+8545162 |
| 6 | 2MASXJ08453453+7259512 | 2MASXJ08453501+7259560 |
| 7 | 2MASXJ035823364428024 | 2MASXJ035821804427585 |
| 8 | 2MASXJ104217410022318 | 2MASXJ104217970022365 |
| 9 | 2MASXJ124225070702456 | 2MASXJ124225540702364 |
| 10 | 2MASXJ16013973+2121296 | 2MASXJ16014023+2121106 |
| 11 | 2MASXJ12040147+2013489 | 2MASXJ12040140+2013559 |
| 12 | 2MASXJ07222530+4916277 | 2MASXJ07222519+4916427 |
| 13 | 2MASXJ064300037415042 | 2MASXJ064305967414103 |
| 14 | 2MASXJ00364578+2134078 | 2MASXJ00364500+2133594 |
| 15 | 2MASXJ17465074+2045440 | 2MASXJ17465132+2045400 |
| 16 | 2MASXJ09054355+1820276 | 2MASXJ09054305+1820226 |
| 17 | 2MASXJ11282505+0924272 | 2MASXJ11282405+0924279 |
| 18 | 2MASXJ23223215+1153235 | 2MASXJ23223093+1153332 |
| 19 | 2MASXJ021424110722178 | 2MASXJ021425860722064 |
| 20 | 2MASXJ12214093+1129448 | 2MASXJ12214230+1130118 |
| 21 | 2MASXJ131938341242052 | 2MASXJ131938051241562 |
| 22 | 2MASXJ12494210+2653266 | 2MASXJ12494226+2653312 |
| 23 | 2MASXJ13561035+0514388 | 2MASXJ13560724+0515169 |
| 24 | 2MASXJ23535429+0757368 | 2MASXJ23535389+0758138 |
| 25 | 2MASXJ11561045+6031300 | 2MASXJ11561032+6031211 |
| 26 | 2MASXJ15375266+5923382 | 2MASXJ15375345+5923304 |
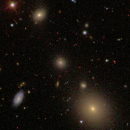
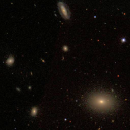
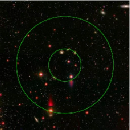
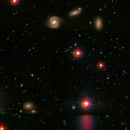
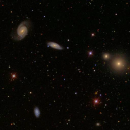
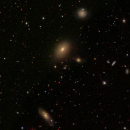
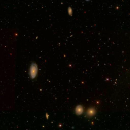
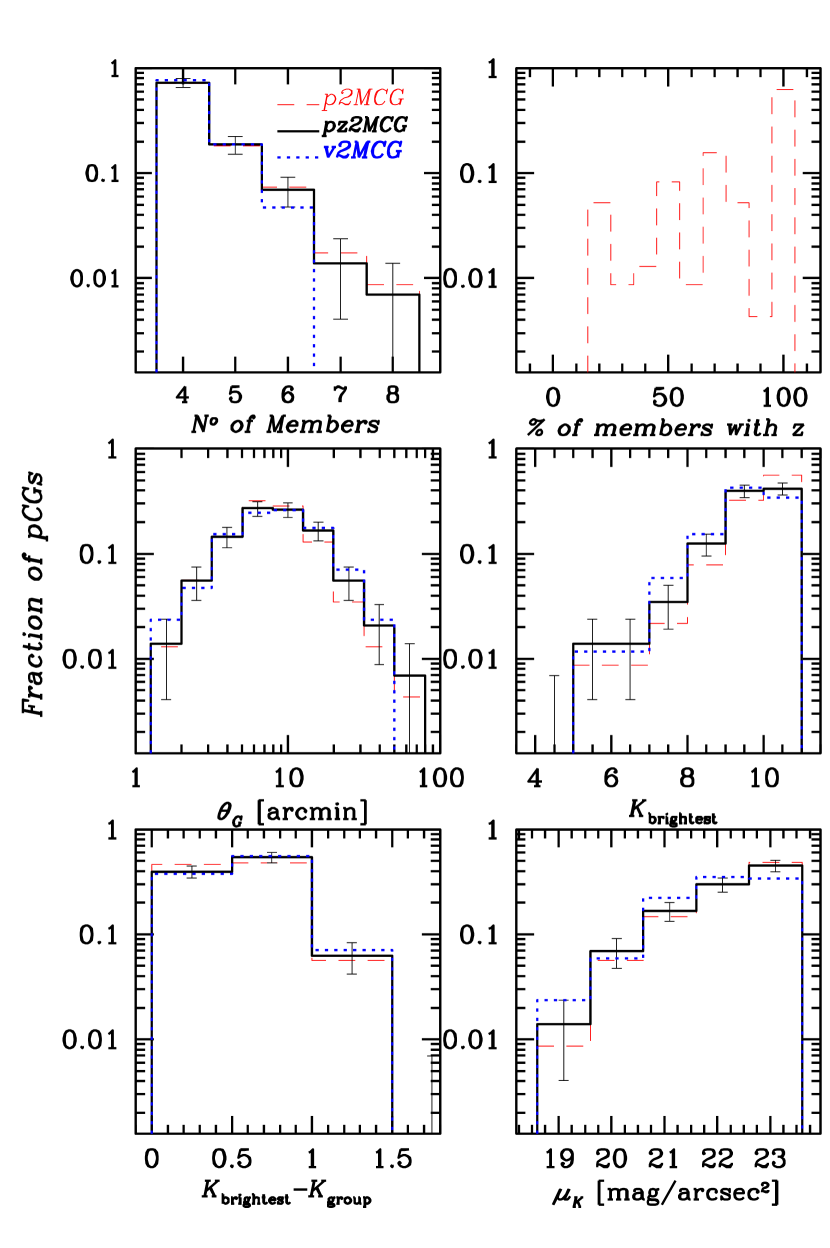
As a result, we identify p2MCGs in the 2MASS catalogue. In Fig. 1 we show the sky coverage of these groups (empty squares). Figure 3 shows images of a few examples of p2MCGs that lie in the SDSS area. Some of the observable properties of the p2MCGs are shown in Fig. 4 and their median values are shown in the second column of Table 4.
A list of acronyms used to refer different samples to be defined throughout this work is provided in Table 2.
| CG | general compact groups |
|---|---|
| p2MCG | CGs identified in projection from the 2MASS catalogue |
| pz2MCG | p2MCGs whose galaxies have their radial velocities known |
| v2MCG | CGs with 4 or more accordant galaxies (velocity filtered) |
| mvCG | mock velocity-filtered CGs |
| HCG | Hickson Compact Groups |
4 Cross-identification
We compared our sample of CGs to the original HCG sample. We looked for the -band magnitudes of all the original members of the HCG sample in the 2MASS catalogue. There are HCGs that lie within the studied area (HCG 33 and 34 lie within of the Galactic Plane) and whose brightest galaxy -band magnitude is brighter than 10.57 (fourth criterion). However, only HCGs have been identified with the p2MCGs in the 2MASS sample, and they are: HCG 4, 7, 10, 15, 16, 21, 22, 23, 25, 40, 42, 51, 58, 86, 87, 88, 93, 97, 99, 100. While 10 of these 20 CGs have the exact same member galaxies, the remaining have galaxies in common but are not exactly the same: some groups have more galaxies unidentified by Hickson while others have fewer.
We therefore analysed the reasons why we failed to identify the 22 remaining HCGs among the 42. First, in HCG 68, HCG 92 (Stephan‘s quintet) and HCG 94, the 2MASS XSC photometric pipeline blends a pair of galaxies into a single galaxy or only identifies one galaxy of a pair. This then falls into the category of groups discarded due to problematic galaxy identification described in the previous section (in this case, galaxy NGC 5354 for HCG 68, galaxies NGC 7318A and NGC 7318B for Stephan’s quintet, and NGC 7578A for HCG 94). Second, among the 19 remaining unidentified HCGs in our sample, 10 (HCG 5, 56, 57, 61, 65, 74, 90, 91, 96, 98) have less than 4 members within our adopted 2MASS limit of , i.e, some of their members do not belong to our parent sample. Moreover, HCG 57 also fails the HCG isolation criterion in the band (Sulentic, 1997), while HCG 74 and 96 fail the membership criterion in the band. Finally, of the HCGs (HCG 11, 19, 30, 41, 44, 48, 53, 62, 67) fail to meet the -band membership criterion, i.e., have fewer than 4 galaxies with , one of which (HCG 30) also fails to meet this criterion in the band.
The visual inspection performed using Aladin images has also provided information about other cross-identifications. Only of our p2MCGs have already been completely or partially identified by other authors.
5 Velocity-filtered compact groups
5.1 Velocity filtering
We searched in the literature for available redshifts for all galaxies in the p2MCG sample, in order to have a sample of concordant groups. First, we correlated the galaxies in the 2MASS extended source catalogue with galaxies in the 2MASS Redshift catalogue (2MRS, Huchra et al., 2012). We have found of our galaxies in p2MCGs in the main catalogue of those authors. Also, another were present in the “extra” catalogue presented by the authors. Then, we looked for the remaining galaxies in the 2M++ redshift compilation (Lavaux & Hudson, 2011). We found of the remaining p2MCG galaxies in this catalogue. We also looked for available redshifts in the NED for those galaxies in the p2MCGs that do not belong to the 2MRS nor to 2M++. We have found another redshifts of galaxies in p2MCGs. All in all, we find that out of galaxies (85%) already have measurements of their redshifts available.
A total of 144 (62%) of the p2MCGs have all their members with available redshifts, and we hereafter refer to these as pz2MCGs. In 20% of the p2MCGs there is one galaxy without available redshift, while in 10% (8%) of the p2MCGs there are two (three or more) galaxies without redshifts.
Fig. 4 shows that the distributions of observable properties of the 144 pz2MCGs are very similar to those for the full sample of p2MCGs. Therefore, our subsample of pz2MCGs does not appear biased relative to the full sample of p2MCGs.
Using these 144 pz2MCGs, we built a sample of velocity-filtered CGs (v2MCGs) by following an iterative procedure (see Hickson et al., 1992 and Díaz-Giménez & Mamon, 2010). Briefly, after computing the median velocity of the group, we discard the galaxy whose velocity is furthest and at least from the median. We recompute the velocity median of the remaining galaxies and iterate until all, and at least 4, galaxies lie within from the new median. We then check that the brightest remaining galaxy is brighter than 10.57, and that . If not, we discard the group.
Our procedure led us to 85 v2MCGs that survive the velocity filtering, and are thus less likely to be contaminated by galaxies in chance projections. The angular distribution of these groups is shown in Fig. 1 (filled circles).
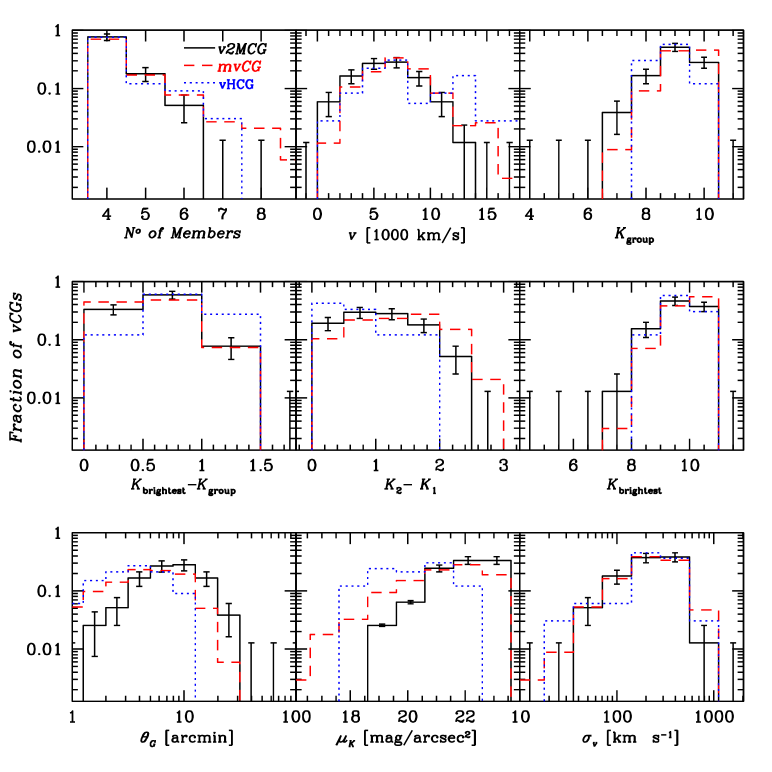
Figure 5 shows the properties (see Sect. 5.3 below) of the v2MCGs (solid black histograms). One sees that the sample of v2MCGs appears to be complete up to , close to the theoretical limits for quartets () and the rarer quintets (). The v2MCG sample also appears to be fairly complete666Of course, a flux-limited catalogue is never complete in terms of volume, since galaxies are sampled with increasing minimum luminosity as one goes out to increasing distances, hence the space density of galaxies always decreases (if it were not for fluctuations from the large-scale structure). to radial velocity of .
Fig. 4 displays a comparison between the sample of projected and filtered CGs. One sees that groups with higher multiplicity, or very large angular size are more prone to be chance alignments along the line of sight.
5.2 Cross-identification
We found that of the v2MCGs were previously (completely or partially) identified by other authors (see last column of Table 8). In particular, the v2MCGs include 16 Hickson compact groups: HCG 7, 10, 15, 16, 21, 23, 25, 40, 42, 51, 58, 86, 88, 93, 97, and 99. Moreover, of the v2MCGs lie in the SDSS area. The median of the properties are quoted in the second column of Table 5.
5.3 Measurement of group properties
The main properties of the v2MCGs are quoted in Table 8.
They are:
Column 1: Group ID
Column 2: Right Ascension of the CG centre
Column 3: Declination of the CG centre
Column 4: Median radial velocity
Column 5: Number of galaxy members in the CG in the range of 3 magnitudes from the brightest member
Column 6: Extinction-corrected -band apparent magnitude of the brightest galaxy
Column 7: Extinction-corrected -band group surface brightness
Column 8: Angular diameter of the smallest circumscribed circle
Column 9: Median projected separation among galaxies
Column 10: Apparent group elongation
Column 11: Radial velocity dispersion of the galaxies in the CG
Column 12: Dimensionless crossing time
Column 13: Mass-to-light ratio in the -band
Column 14: Cross-identification with other group catalogues
The group velocity dispersions, , are computed using the gapper algorithm following Beers et al. (1990), who found it to be more efficient than standard estimators of dispersion for small samples.777One of us (G.A.M., unpublished) also found the gapper estimate of dispersion to be much less biased for small samples than are other measures. Our values of are corrected (in quadrature) for the velocity errors.
The extinction corrections in Table 8 refer to the galactic extinction, deduced from Schlegel et al. (1998). We did not correct for internal extinction, because the corrections are usually negligible, except for edge-on spirals where it is probably of order of 0.2 mag. Moreover, we expect that internal extinction increases not only with the inclination of the disk, but also with disk luminosity (with increasing column density of dust at increasing luminosity for given dust/stars ratio) and metallicity (which controls the dust/stars ratio), as well as on the bulge/disk ratio. Since we lack bulge/disk decomposition for our galaxies, we could have used the internal extinction formulae for 2MASS wavebands of Masters et al. (2003), given as a function of inclination and luminosity. However, their modulation of internal extinction by the luminosity saturates at luminosities of about , whereas it should keep rising because, at increasing luminosity, the column density should increase and the metallicity, hence dust/stars ratio, should also increase. We thus prefer to leave the internal extinction to further analysis.
The physical radii and luminosities assume distances obtained from the redshifts, i.e. we neglect the peculiar velocities of the galaxies relative to the Sun. We could have included a Virgocentric infall model to correct for the peculiar velocity of the Local Group (as given in HyperLEDA888http://leda.univ-lyon1.fr/, see Terry et al., 2002), but this would not have included the peculiar motions of v2MCG galaxies. The attractor model of Mould et al. (2000) does include the peculiar motions of both the Local Group and the other galaxies, but it misses all the repelling voids. The peculiar velocity flow model of Lavaux et al. (2010) does include the full matter distribution and not just the attractors. But it was built from redshift data and lacks accuracy at distances less than because it is not calibrated with available quality distance estimators (Cepheids or surface brightness fluctuations). Since none of the models available satisfied our expectations taking into account all the main velocity components, we decided not to correct for peculiar motions, and we leave this open to further analysis. For peculiar velocities of , the effects of peculiar motions on distances are less than 10% for galaxies with (leading to physical size and luminosity errors less than 10% and 20% respectively). For the presentation and analysis of statistical v2MCG properties, we thus restrict our sample to the 78 v2MCGs for which the median group velocity is greater than .
We compute the absolute magnitudes of the individual galaxies, assuming that their luminosity distances are all based upon the median group redshift. The cosmology adopted for computing the luminosity distances is the standard cosmology also used in the MS (, ). Note that the luminosities are not only corrected for galactic extinction, but are also -corrected. For computing the -corrections, we have used the polynomial expressions in terms of redshift and colour – given by Chilingarian et al. (2010). The results of the present work depend very little on the details of the -corrections, since the galaxy samples studied here are from shallow flux-limited surveys, hence limited to low redshifts.
Our dimensionless crossing times are obtained with
| (1) |
where is the median of the inter-galaxy projected separations in . Our mass-to-light ratios are obtained from an application of the virial theorem:
| (2) |
where is the harmonic mean projected separation, given the projected separations (see eq. [10–23] of Binney & Tremaine, 1987).
The distributions of the main properties of the v2MCGs are shown as solid black histograms in Fig. 5.
5.4 Mock velocity-filtered compact groups
It is instructive to compare the distribution of the properties of v2MCGs with the mock, velocity-filtered compact groups (mvCGs) selected on mock galaxy catalogues with the exact same criteria as those described at the top of Sect. 3. We have done this following the prescriptions of Díaz-Giménez & Mamon (2010), who had analysed the outputs of three different semi-analytical models (SAMs) of galaxy formation (B06, Bower et al., 2006; C06, Croton et al., 2006; and DLB07, De Lucia & Blaizot, 2007).
However, since this work, a new SAM has been developed by Guo et al. (2011) (hereafter G11) that reproduces much better, among other things, the stellar mass function of galaxies. Moreover, Guo et al. have run their SAM not only on the Millennium dark matter simulation, but also on the Millennium-II simulation (MS-II, see Boylan-Kolchin et al., 2009), which has 5 times better space resolution and 125 times better mass resolution. Since CGs are small, space and mass resolution are crucial in producing realistic mock CG catalogues. We have therefore primarily used the outputs of the Guo et al. SAM run on top of the MS-II to build realistic mock light cones to a magnitude limit of (the limit of the 2MASS converted to the SDSS band) and identify CGs. We have also reanalysed the output of the SAM by Croton et al. (2006), this time using their -band magnitudes instead of the -band ones to a magnitude limit of (the 2MASS completeness limit used throughout this work). We refer to these mvCGs as C06K. Note that, as in Díaz-Giménez & Mamon (2010), we assumed for all SAMs that mock galaxies that are close in projection on the plane of the mock sky would be blended by observers if their angular separation is less than the sum of their angular half-light radii.
| Parent CDM simulation | MS | MS | MS | MS | MS-II |
| SAM | B06 | C06 | DLB07 | C06K | G11 |
| Selection band | |||||
| & | |||||
| Number of mvCGs | 1952 | 2011 | 1251 | 1782 | |
| Fraction of physically dense | 0.77 | 0.73 | 0.58 | 0.69 | |
| & | |||||
| Number of mvCGs | 379 | 360 | 288 | 486 | 340 |
| Fraction of physically dense | 0.73 | 0.65 | 0.53 | 0.66 | 0.66 |
Table 3 shows the fraction of mvCGs, selected in redshift space as the observed catalogues, that are physically dense in real space with the criteria adopted by Díaz-Giménez & Mamon (2010), who call the maximum pair separation in real space among the closest subsample of 4 galaxies of the CG or the CG itself for quartets, while and denote the maximum line-of-sight and projected separations of the subsample, respectively. With these notations, the criterion for physically dense groups is that they be physically very small or that they be physically small and not elongated along the line-of-sight: () OR ( AND ). Assuming that the predictions from the SAM can be directly applied to the v2MCGs, we predict that between and of the sample can be considered as physically dense systems, which means that between and v2MCGs may be truly dense systems. The remaining of the mvCGs are caused by chance alignments of galaxies along the line-of-sight, usually originating from larger virialised groups (see also Díaz-Giménez & Mamon, 2010).
In particular, for the more realistic G11 SAM run on the much better resolved MS-II cosmological dark matter simulation, two-thirds of the mock velocity-filtered compact groups are physically dense, while one-third is caused by chance alignments of galaxies along the line-of-sight, mostly within larger virialised groups. So, this better SAM produces a fraction of mock velocity-filtered compact groups that are physically dense that is similar to what Díaz-Giménez & Mamon (2010) had found for the three other SAMs. Comparing the upper and lower rows of Table 3, it is encouraging that the fraction of physically dense mvCGs depends little on the waveband (red or ) used.
6 General Properties
It is interesting to compare the properties of the CGs presented in this work to those found in the literature for other CG samples. We downloaded several CG catalogues available at the VizieR service999http://vizier.u-strasbg.fr service of the Centre de Données astronomiques of Strasbourg (CDS), and computed the properties of these groups in the same way we did for our sample of CGs.
6.1 Comparison with photometric catalogues
| p2MCG | HCG | DPOSSCG/03 | DPOSSCG/05 | SDSSCG/04 | SDSSCG-A/09 | SDSSCG-B/09 | HCG | |
|---|---|---|---|---|---|---|---|---|
| ref. | Hick82 | Iov03 | deCarv05 | Lee04 | McCon09 | McCon9 | Hick82/2 | |
| colour eq. | – | + | + | + | + | |||
| 230 | 100 | 84 | 459 | 177 | 2297 | 74791 | 40 | |
| [arcmin] | ||||||||
| [] | ||||||||
| – | ||||||||
| – |
Notes. : group angular diameter, : apparent magnitude of the brightest galaxy member in the -band, : total apparent magnitude of the group (i.e., sum of all members), : group mean surface brightness, : difference of apparent magnitudes between the faintest and the brightest galaxy members, : difference between the brightest galaxy and the total apparent magnitudes of the groups. Errors are the semi-interquartile ranges. References: Hick82: Hickson (1982); Iov03: Iovino et al. (2003); deCarv05: de Carvalho et al. (2005); Lee04: Lee et al. (2004); McCon09: McConnachie et al. (2009); Hick82/2: Hickson (1982), restricted to and and with non-isolated groups (Sulentic, 1997) removed.
We retrieved data from VizieR for the following six catalogues: HCG (Hickson, 1982), DPOSSCG/03 (Iovino et al., 2003), DPOSSCG/05 (de Carvalho et al., 2005), SDSSCG/04 (Lee et al., 2004), SDSSCG-A/09 (McConnachie et al., 2009), SDSSCG-B/09 (McConnachie et al., 2009). It is important to note that, although we used the membership information from the authors (angular positions and magnitudes), we recomputed all the properties using our own algorithms, to ensure that they were all estimated in the same manner. In this way, we can compare our projected p2MCG catalogue with others in the literature to highlight differences in the searching algorithms and selection criteria.
Table 4 shows the median observable properties and their inter-quartile ranges for the photometric samples of CGs. For a fair comparison among these samples, it is necessary to take into account the different bands in which CGs have been identified in each different catalogue. While our p2MCGs are based upon -band magnitudes, HCGs have been first identified on POSS-I plates, whose spectral response is close to the band, for which the galaxy magnitudes are available. DPOSSCG/03 have SDSS- band magnitudes, DPOSSCG/05 have -Gunn magnitudes, and SDSSCG/04/09 have SDSS- band magnitudes. We assumed that (appendix A) and (Díaz-Giménez & Mamon, 2010) to compare magnitudes in the and -band to those in the -band. Therefore, in Table 4, all magnitudes are converted to the -band. Table 4 also includes a cleaner subsample of the HCG (Hick82/2) that meets equivalent criteria as the used in this work ( and ) and for which we omitted 6 HCGs that fail to meet the isolation criterion (Sulentic, 1997) (see also thin dotted blue lines in Fig. 5).
Table 4 indicates that the p2MCGs have brighter group and first-ranked galaxy apparent magnitudes than those of the other photometric catalogues. This is a consequence of the shallower magnitude limit of the 2MRS spectroscopic survey used here. Restricting the HCG sample to the magnitude limits used here (‘Hick82/2’), the median first-ranked galaxy magnitude is slightly brighter than that of the p2MCGs. The differences remaining between the p2MCG and Hick82/2 samples arise from the differences between automatic and visual identifications, since the latter by Hickson (1982) were biased (e.g., Díaz-Giménez & Mamon, 2010) towards identifying groups with similar galaxies (lower values of , and higher values of –), and missing groups close to the compactness limit (lower values of ). On the other hand, the median angular diameter of the p2MCGs is larger than for the other samples, making the surface brightness of our sample the faintest. Moreover, not all the CG catalogues were constructed taking into account our fourth criterion that ensures that group members can be found in a 3 magnitude range from the first-ranked galaxy. In several of the catalogues, the magnitude limit of the sample is sometimes just one or two magnitudes fainter than that of the first-ranked galaxy. It is clear that this leads to a bias towards identification of smaller differences between the first-ranked and faintest member of the group, as can be seen, e.g., in the average values of of 1.6 for the DPOSS/03/05 and SDSSCG-A/B catalogues.
It is interesting to compare the number of p2MCGs with and with the number of HCGs in the same range of magnitudes. We find p2MCGs vs. pHCGs that meet the criteria used in this work translated to the -band ( and ), which means that the completeness of the visually identified HCGs is (binomial errors) This result is higher than the predicted by Díaz-Giménez & Mamon (2010) from the semi-analytic models of galaxy formation. Moreover, in our analysis of the SAM of Croton et al. (2006), identifying in the deeper -band mock catalogue and then translating to the band produces a sample of mvCGs that is only 74% of the size of the mvCG sample directly selected in . Thus, the incompleteness of the HCG catalogue relative to the 2MCG one is , even higher than the prediction from the SAMs in the band.
Given that the properties shown in Table 4 are dependent on the distances to the CGs, which are not included in the analysis above, it is also interesting to compare catalogues for which velocity information is available. This is done in the following subsection.
6.2 Comparison with observed and mock spectroscopic catalogues
| v2MCG | HCG | UZC-CG | LCCG | DPOSSII-CG | HCG | mvCG | |
| ref. | Hick92 | Foc02 | Allam00 | Pom12 | Hick92/2 | G11 | |
| colour eq. | –2.4 | +1.7 | +1.7 | ||||
| 78 | 67 | 49 | 17 | 33 | 33 | 326 | |
| [arcmin] | — | ||||||
| — | |||||||
| — | |||||||
| [] | — | ||||||
| – | — | ||||||
| – | — | ||||||
| – | — | ||||||
| [] | |||||||
| [] | |||||||
| [] | |||||||
| [] | — | ||||||
| — | |||||||
| [] | |||||||
| — | |||||||
| — | |||||||
| 3 | 0.19 | 0.53 | 0.86 | — | 0.31 | 0 | |
| 9 | (0.40) | 0.09 | (0.93) | — | (0.08) | 5 | |
| (0.90) | (0.69) | (0.23) | (0.93) | — | 0.25 | (0.38) |
Notes. All the photometric properties have been translated to the -band to allow comparison among catalogues. : number of CGs with 4 of more concordant members; : group angular diameter; : apparent magnitude of the brightest galaxy member in the -band; : total apparent magnitude; : group mean surface brightness; : difference of apparent magnitudes between the faintest and the brightest galaxy members; : difference between the brightest galaxy and the total apparent magnitudes; : difference of absolute magnitudes between the brightest and the second brightest galaxy of the group (same statistics for difference in absolute -band magnitudes, after including -corrections from Chilingarian et al., 2010 and Poggianti, 1997); : total luminosity of the CG; : group median radial velocity; : group gapper (Wainer & Thissen, 1976) velocity dispersion, corrected for galaxy velocity errors (assumed to be when unavailable); : median inter-galaxy separation; : group radius (of smallest circumscribed circle); : apparent elongation of the group (1=round); : dimensionless crossing time (eq. [1]); : mass-to--light ratio from the virial theorem (eq. [2]); and : Tremaine-Richstone statistics (Tremaine & Richstone, 1977, eq. [3]); : probability of greater anti-correlation of luminosity with position occurring by chance (Spearman rank correlation test); : probability of greater difference in distributions of positions between 1st and 2nd ranked galaxies, occurring by chance (Kolmogorov-Smirnov test); : same for difference in distribution of positions between 2nd and 3rd ranked galaxies. Numbers in parentheses for these three quantities indicates reverse luminosity segregation (brighter galaxies further out). Errors are the semi-interquartile ranges, except for and , where they are standard deviations computed with 10 000 bootstraps. References: Hick92: Hickson et al. (1992); Foc02: Focardi & Kelm (2002); Allam00: Allam & Tucker (2000); Pom12: Pompei & Iovino (2012), restricted to isolated (classes A, CH and CP) with at least 4 accordant redshifts; Hick92/2: Hickson et al. (1992), restricted to isolated groups (following Sulentic, 1997) and restricted to and ; G11: mock compact groups extracted (following the method of Díaz-Giménez & Mamon, 2010) from the mock galaxy catalogue of Guo et al. (2011) applied to the MS-II (Boylan-Kolchin et al., 2009) cosmological body simulation.
We retrieved galaxy data from VizieR for the following compact group catalogues with velocity information: HCG (Hickson et al., 1992), UZC-CG (Focardi & Kelm, 2002), and LCCG (Allam & Tucker, 2000). We also extracted the group information from the new DPOSSII-CG catalogue (Pompei & Iovino, 2012). We, then, proceeded to compare those samples to our v2MCG sample, after transforming again all samples to the band with colours – (Appendix A), (Prandoni et al., 1994) and (Díaz-Giménez & Mamon, 2010). We have applied -corrections to the different catalogues using the morphology-based corrections of Poggianti (1997) (UZC-CG and LCCG) or colour-based corrections of Chilingarian et al. (2010) (2MCG, HCG).101010We did not apply -corrections to DPOSSII-CG because of lack of galaxy information, and we corrected their crossing time definition to ours ( times greater). We have included the cleaner Hick92/2 sub-sample (see Sect. 6.1) now velocity-filtered, and also the sample of mvCGs that we extracted from G11’s SAM. The median values of the properties of the velocity-filtered CGs are quoted in Table 5 as well as their semi-interquartile ranges.
6.2.1 Space density
We computed the space density within the median distance of the sample () as . For the v2MCGs the space density is . In comparison, the space density for the Hick92/2 sample is , i.e. that the space density of the v2MCGs is times larger. From the G11 SAM, the space density of the mvCGs is , which means that it almost doubles () that of the v2MCGs.
6.2.2 Distribution of group properties
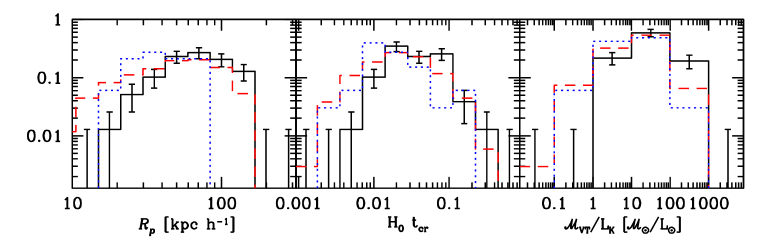
In Fig. 5, we show the distribution of group properties for our v2MCGs (solid histograms), vHCGs (blue dotted histograms), and the mvCGs from G11 (thin dashed red histograms). The comparison with other SAMs can be found in the Appendix B111111Given that the numbers of mvCGs from the different SAMs are typically 4 times the number of v2MCGs, the relative uncertainties on their differential distribution is half of those of the v2MCGs, and are not shown in the Figure, for clarity.. Table 5 shows that the nearest samples are the UZC-CG and v2MCG samples, although the HCG sample restricted to the criteria used in this work also includes only the nearest groups. The two nearby CG samples present the largest projected radii, median inter-particle distances, dimensionless crossing times and mass-to-light ratios. The five CG samples have similar median properties (to within the semi-interquartile ranges), except for and (see below). In particular, the median velocity dispersions for the different catalogues are fairly similar, ranging from to .
Our sample has the highest median crossing time of all samples, while the HCG has the lowest crossing time. The latter result is probably caused by the lack of HCGs near the surface brightness limit (Walke & Mamon, 1989; Prandoni et al., 1994; Díaz-Giménez & Mamon, 2010).
There is a good general agreement between the predictions from the SAM and the observations from 2MASS. But some differences stand out: in comparison with the mvCGs, the v2MCG sample lacks groups of high-multiplicity (as checked with a KS test on the full distributions), very low velocity dispersion, small angular and physical sizes, high surface brightness, and low , but has too many groups that lie at low redshifts, or that are globally bright () or with bright 1st-ranked galaxy ().
Our identification of more v2MCGs at low redshifts than predicted by the SAM might be a sign that our local neighbourhood () is denser than on average, perhaps thanks to the presence of the Virgo and Fornax clusters, or conversely that the observer we placed in a random position in the cosmological box turned out to be in an underdense region (for small volumes one might expect that cosmic variance is than Poisson variance). This excess of nearby CGs would explain our excess of v2MCGs with large angular size and of low surface brightness. However, we also find an excess in physical radii, which suggests that we suffer more from galaxy blending than we accounted for in our mvCGs.
6.2.3 Apparent group elongations
Using projected Cartesian coordinates on the plane of the sky, we calculated the 2-dimensional shape tensor, whose eigenvalues are related to the major () and minor () semi-axes. We measure the elongations of the groups in the plane of the sky as the ratio between the major and minor semi-axes (). Lower values of imply more elongated systems on the plane of the sky. Table 5 indicates that the apparent group elongations are similar between all catalogues.
Using a different technique to measure group apparent elongations, Tovmassian et al. (1999) found that group velocity dispersions were significantly smaller (by 28%, with large uncertainty) in chain-like groups than in rounder ones, which we hereafter denote the Tovmassian effect. Now, geometrical considerations imply that the distribution of group shapes depends on the number of its members (e.g. Hickson et al., 1984), with low multiplicity groups being on average more elongated. Since velocity dispersion scales as mass, which scales as number, one would then expect from the geometrical considerations that high velocity dispersion groups will be rounder, as found by Tovmassian et al.. However, these authors also noticed trends for triplets, quartets and quintets separately, and while none were statistically significant, they argued that the probability that all three trends were present (albeit weak) was significant.121212Tovmassian et al. (1999) did not present any statistical tests for the separate multiplicities, nor for the combination of the larger mean velocity dispersions for the triplets, quartets and quintets.
| Catalogue | |||||
|---|---|---|---|---|---|
| () | |||||
| v2MCG | 0.01 | 0.95 | 204 | 188 | 0.50 |
| HCG (Hick92/2) | 0.20 | 0.33 | 149 | 284 | 0.19 |
| mvCG-G11 | 0.11 | 0.11 | 208 | 272 | 0.09 |
| mvCG-C06 | 0.01 | 0.85 | 240 | 209 | 0.94 |
| mvCG-B06 | 0.04 | 0.54 | 227 | 240 | 0.75 |
| mvCG-DLB07 | 0.02 | 0.81 | 290 | 274 | 0.99 |
| mvCG-C06K | 0.10 | 0.10 | 240 | 280 | 0.10 |
Notes. The samples are those listed in Table 5, hence limited to , but also restricted to quartets (). The columns are : Spearman rank correlation coefficient; : probability of stronger correlation than occurring by chance; and : median group velocity dispersions for chain-like () and round () groups, respectively; : probability of greater difference between of velocity dispersion distributions for groups with and occurring by chance (Kolmogorov-Smirnov statistic).
Table 6 shows our analysis of the velocity dispersion and apparent elongations of the quartets (thus avoiding any geometrical source for the Tovmassian effect). In the v2MCG sample, there is no correlation between group apparent elongation and velocity dispersion, while in the cleaned HCG sample (Hick92/2) and the mock (from G11’s SAM) CGs, there are weak correlations between and , but they are not statistically significant. However, for the Hick92/2 and G11 samples, the median velocity dispersion of the chain-like () groups is much smaller than that of the round () groups, while the opposite behaviour is observed for the v2MCGs. Yet, the effect is not significant in the v2MCG, only marginally significant in the mock sample, while the Hick92/2 sample, with only 13 quartets, is too small to provide a statistically significant difference in the distributions of velocity dispersions between chain-like and round groups. We note that if we increase the Hick92/2 sample to groups with galaxy magnitudes (instead of ), we end up with 41 HCG quartets, for which the rank correlation coefficient between apparent elongation and velocity dispersion is now , yielding a correlation with 97% significance. However, for this deeper Hick92/2 sample, the difference in the distributions of velocity dispersions for chain-like and round quartets is still not statistically significant.
6.2.4 Bright end of the luminosity function
Tremaine & Richstone (1977) devised two simple, yet powerful statistics, based on Cauchy-Schwarz inequalities, to test whether the first-ranked galaxies in groups and clusters were consistent with one or several arbitrary luminosity functions. They defined and as follows:
| (3) |
where the averages are means and where and are the standard deviations of the absolute magnitude of the brightest galaxy () and difference in absolute magnitude () between the second- and first-ranked galaxies. Values of and lower than unity imply that the first-ranked group galaxies are abnormally bright at the expense of the second-ranked galaxy. -body simulations indicate that galaxy mergers within physically dense groups rapidly reduce the values of and below 0.7 (Mamon, 1987a). and are biased low for samples with small number of groups, (Mamon, 1987b).
In Table 5, we find that the v2MCG sample displays and significantly lower than unity: and ( errors from bootstraps). We also find such low values in our mock mvCG sample from G11 as well as in our four other mvCG samples.
However, none of the other observed CG samples display low values of and . In particular, the HCG samples show and . It appears that Hickson (1982) missed CGs with very dominant galaxies (Prandoni et al., 1994; Díaz-Giménez & Mamon, 2010), thus creating a spuriously high . Indeed, Table 5 shows that (hence, the difference in absolute magnitudes) has a median value of 1.0 for the v2MCG sample (1.3 for the mvCGs), but only 0.6 for the HCG samples (the means are similar). Still, part of the difference in values is caused by the larger standard deviations of 1st-ranked absolute magnitudes in the HCG samples (0.8) in comparison with the v2MCG (0.53) and G11-mvCG (0.58) samples.
In comparison, Loh & Strauss (2006) found and in nearby rich SDSS clusters dominated by Luminous Red Galaxies (LRGs), while Lin et al. (2010) recently found and in luminous SDSS clusters, but and for low luminosity ones.
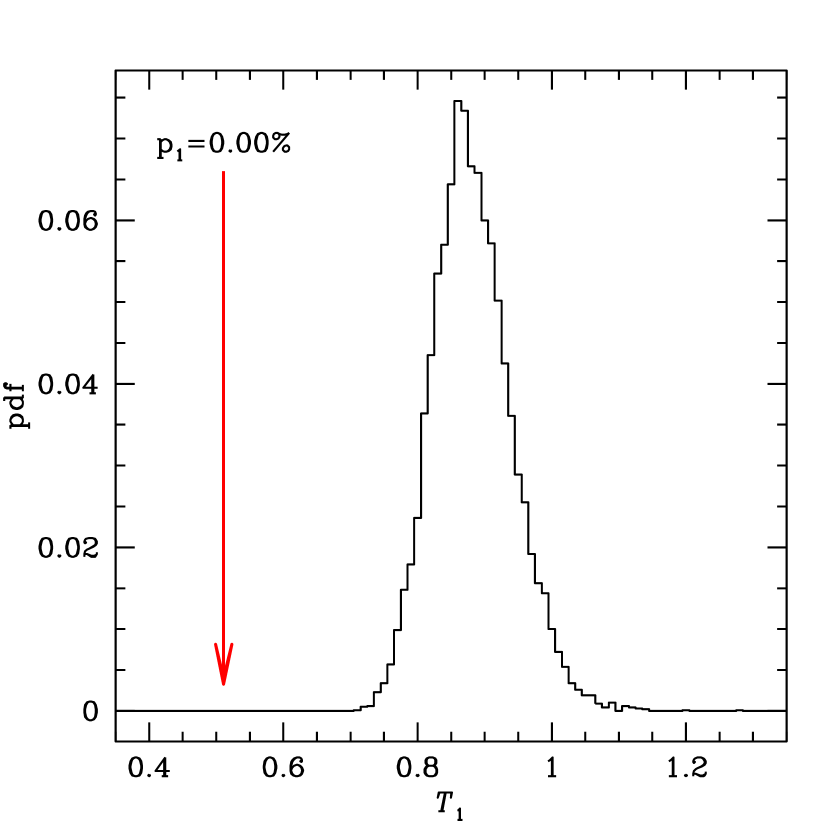
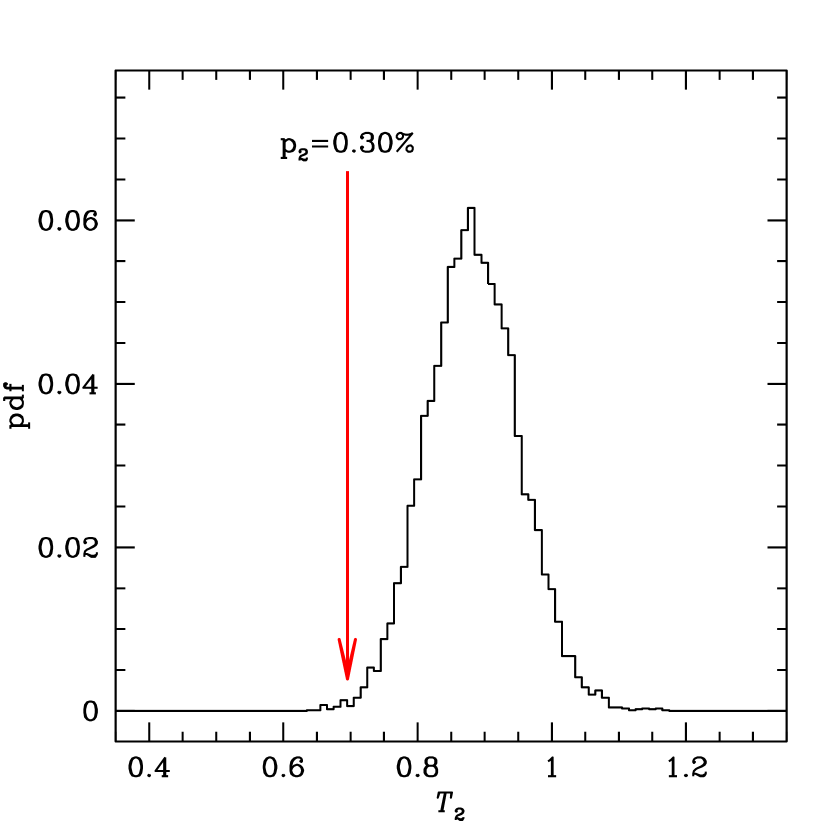
We can also quantify how significant are the deviations of and from unity using a Monte-Carlo technique (see also Lin et al., 2010). We built mock CGs by adopting the absolute magnitudes of the first-ranked v2MCGs and adding to them the absolute magnitudes of galaxies chosen at random from the 2MRS catalogue, but with 3 limitations: 1) in the same range of redshifts (velocities from that of the first-ranked); 2) absolute magnitudes, , in the range of the group: , where is the absolute magnitude of the first-ranked group member; 3) positions more than 5 degrees from the group (in Declination only for a faster run). The velocity criterion ensures that the flux limit of 2MRS is properly handled, while the position criterion ensures that a first-ranked galaxy is not duplicated in its mock group. In the end we thus generate mock CGs with the same multiplicity function and distribution of most luminous absolute magnitudes. We did not consider a surface brightness threshold on our Monte-Carlo groups (assuming that the galaxies are located in the same positions as in the observed sample), because this would increase the discrepancy between the observed values of and with those from our Monte-Carlo samples. Indeed, since we start with the brightest group galaxy, if we enforced a minimum group surface brightness, we would tend to reject groups with only one luminous member, hence leading us to lower differences between second and first-ranked absolute magnitudes, and therefore larger values of and . We compute and for this mock sample of CGs and iterate to build a total of samples.
The distribution of and for the mock catalogues can be seen in Fig. 6. Let be the fraction of Monte-Carlo realisations that have as low as the observed value. We found (i.e. ) and , i.e. none of our mocks reached values of and both as low as observed in v2MCGs131313Note that Lin et al. (2010) also considered the compatibility of the distribution of observed values of and of clusters using bootstrap resampling with the predicted distribution obtained with mocks. This incorrectly accounts twice for the finite sample. One should either use bootstraps to provide error bars on the observed and and compare to the mean prediction of the mocks or conversely compare the observed and without error bars to the distribution of the mocks, but not do both..
All this confirms that the v2MCG is the only observed compact group sample that has differences between first- and second-ranked absolute magnitudes that are inconsistent with random sampling of luminosity functions, in agreement with the expectations from cosmological simulations.
6.2.5 Luminosity segregation
In the standard galaxy formation model used for SAMs, the brightest group galaxies are centrally located (see Skibba et al., 2011 for the quantification and limits of this idea). Indeed, N-body simulations of virialised dense groups show that such luminosity segregation rapidly sets in (Mamon, 1987a). Moreover, the two-body relaxation times in dense groups of galaxies, of order of the number of galaxies times the orbital time, both of which are small, are expected to be much smaller than the age of the Universe, hence galaxies should exchange their orbital energies and reach equipartition on short timescales. If CGs are caused by chance alignments, then one does not expect to witness such luminosity segregation. Mamon (1986) measured luminosity segregation in HCGs, using the exact same technique as he used in the simulations: stacking the groups and searching for a correlation (with the Spearman rank test) between the fraction of group luminosity in the galaxy (hereafter, fractional luminosity) versus the projected distance relative to the group centroid (unweighted barycentre) in units of the median of these distances per group (hereafter, normalised radial coordinate). The absence of luminosity segregation in HCGs, measured in this fashion, produced for him another argument that HCGs were heavily contaminated by chance alignments.
Here, we performed the same analysis on the different observed and mock samples of CGs. We first found that v2MCGs show significant anti-correlation between fractional luminosity and normalised distance: Spearman rank correlation . According to the Spearman rank correlation test, an anti-correlation at least as strong as this observed one has less than 0.1% probability of arising by chance (see Table 5). This is also the case in the mock mvCG sample. One may argue that SAMs have luminosity segregation within them by construction, since in SAMs, galaxies form at the centre of a halo. But none of the other observed CG samples show any significant sign of luminosity segregation, and this is not just a case of poorer statistics, as the correlation coefficient between fractional luminosities and normalised distances in the v2MCG is much more negative than in all other observed samples.
We also compared the stacked distributions of normalised distances between first- and second-ranked galaxies, as well as between second- and third-ranked galaxies, using the Kolmogorov-Smirnov (KS) test. As seen in the last two rows in Table 5, in v2MCGs, the first-ranked galaxy is significantly more centrally located than the second-ranked galaxies: according to the KS test, the probability that this would occur by chance is again less than 0.1%. This is also seen in the mvCGs, while no such significant trends are seen in the other group catalogues (including the HCG). Hence, The v2MCG is the only CG sample to show that the most luminous galaxies are significantly more centrally located, in accordance with the mock CGs from SAMs, and contrary to what has been observed in all other CG sample.
Interestingly, there are no statistically significant signs for different distributions of normalised distances between second- and third-ranked galaxies. In other words, while the first-ranked galaxies are in general more centrally located than the second-ranked, the latter are not more centrally located than the third-ranked. This lack of luminosity segregation among the non-brightest galaxies may occur because tides from the parent group potential, may limit the sizes hence luminosities of the galaxies as they approach the central one (whose central location renders it immune to such tides). Then, the second most luminous galaxy will preferentially lie at the outskirts, while the third ranked one, will tend to lie closer because of this tidal limitation. Therefore, for the non-brightest galaxies, group tides may cancel the effect of luminosity segregation.
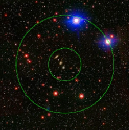
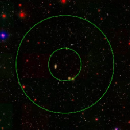
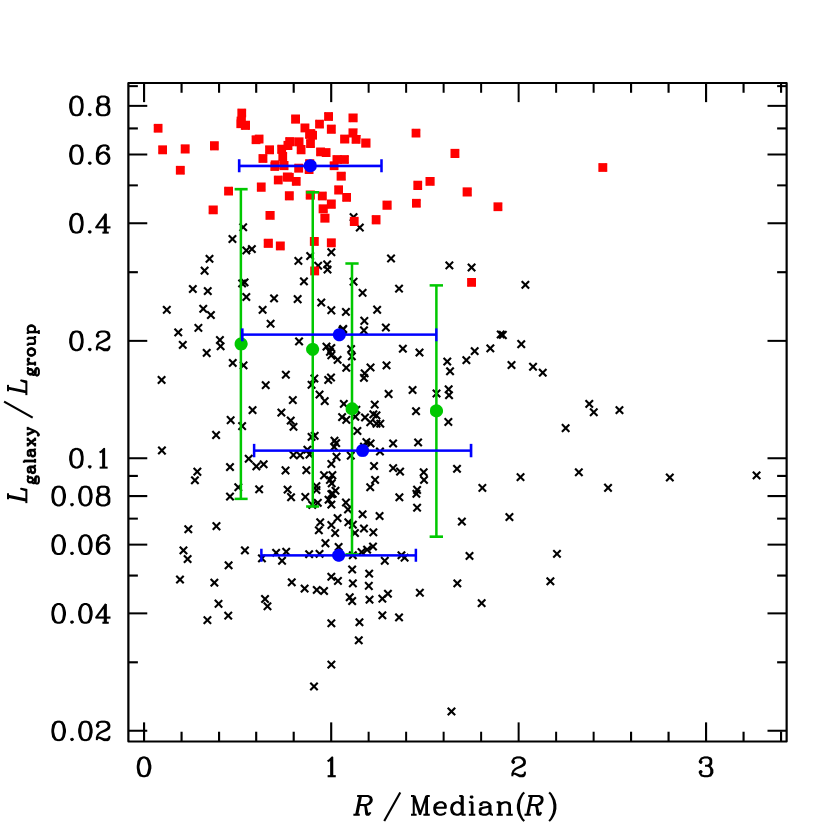
Figure 7 illustrates the luminosity segregation in the v2MCG sample. The fractional group luminosities appear to be enhanced within the median projected distance from the group centroid (i.e. abscissae smaller than unity). However, the normalised distances are only smaller in the galaxies in the 25% highest quartile of fractional luminosity, which roughly corresponds to the first-ranked galaxies.
7 Conclusions and Discussion
In this work we have catalogued a new sample of CGs from the 2MASS survey and we have compared them with existing CG samples.
Following the criteria defined by Hickson (1982), we have identified 230 CGs in projection in the -band covering . This catalogue has well defined criteria which produced an homogeneous sample useful to perform statistical analyses on it. 25% of them (57 CGs) were previously identified in other catalogues as compact groups, triplets of galaxies or interacting galaxies. A total of p2MCGs have all their members with redshifts available in the literature, and among them groups have 4 or more accordant galaxies, which makes this catalogue the largest sample of CGs with 4 or more spectroscopically confirmed members. The percentage of groups with accordant galaxies (59%) is slightly lower than that obtained from the HCG sample (67%), and very similar to the predicted by Díaz-Giménez & Mamon (2010) from the semi-analytical models of Bower et al. (2006) and De Lucia & Blaizot (2007).141414For the SAM of Guo et al. (2011), we find that 70% of mock CGs found in projected space survive the velocity filtering.
As a side note, we have now built additional mock CG catalogues using the Croton et al. (2006) SAM in the -band and the Guo et al. (2011) SAM in the band, where the latter was run on the Millennium-II Simulation, which has 512 times the mass resolution of the Millennium Simulation. For both samples, we found that two-thirds of the mock CGs were physically dense systems of at least 4 galaxies of accordant magnitudes, while the remaining third was caused by chance alignments of galaxies along the line-of-sight, mostly within larger virialised groups, confirming similar conclusions of Díaz-Giménez & Mamon (2010).
In comparison with other CG catalogues, the v2MCG catalogue presented in this work is one of the nearest and brightest samples of CGs, although these CGs have larger projected radii and interparticle separations.
The v2MCG does not show any significant correlation for quartets between apparent elongation and velocity dispersion nor significantly larger velocity dispersion in round groups relative to chain-like groups, contrary to what Tovmassian et al. (1999) claimed in HCGs.
The v2MCG is the only CG sample to display significantly large differences between second- and first-ranked absolute magnitudes (from Tremaine-Richstone statistics) as well as centrally located first-ranked galaxies, both in agreement with mock mvCGs, but in sharp contrast with all other observed velocity-filtered CG samples.
Galaxy mergers are an obvious way to decrease and (Mamon, 1987a), and we cannot think of any other physical mechanism that may cause both and to be significantly smaller than unity in a group catalogue.
One major difference of our sample with others is that ours has many more groups with dominant galaxies accounting for over half the total luminosity. While this increases the gap between first and 2nd-ranked magnitudes, we found that our sample also has a small standard deviation of first-ranked absolute magnitudes, which enhances the significance of the Tremaine-Richstone statistic.
Why don’t we find significant magnitude gaps and luminosity segregation in the other CG samples? It is clear that in his visually search for CGs, Hickson (1982) missed groups with dominant galaxies (Prandoni et al., 1994; Díaz-Giménez & Mamon, 2010 and Table 5). Could those v2MCGs in common with vHCGs have weaker signs of magnitude gaps and luminosity segregation? One expects that if mergers cause the magnitude gap, the masses, i.e. stellar masses, of the galaxies are the crucial variable. Similarly, if luminosity segregation is produced by dynamical friction or by energy equipartition from two-body relaxation, the galaxy (stellar) masses should be the important variable. Therefore, the magnitude gaps and luminosity segregation should be weaker in the band, where the luminosity is less a measure of stellar mass than in the -band.
Unfortunately, we have only 14 groups in common, among which 10 (HCG 7, 10, 23, 25, 40, 58, 86, 88, 93, 99)151515and with slightly variations: HCG 15, 16, 51, 97. have exactly the same galaxies. For these 10 groups, we find and in the band, while in the band we find values greater than unity: and . So, indeed, the -band luminosities are more sensitive than their -band counterparts to the magnitude gap, but given the bootstrap errors, the large differences in and between and -based absolute magnitudes are not statistically significant (for the difference is roughly , while it is much less for ). On the other hand, luminosity segregation is not seen in either waveband: worse it is inverted, with the brightest galaxy on average further away from the group centroid than the 2nd-brightest galaxy.
The other two CG samples, UZC-CG and LCCG, are based upon Friends-of-Friends (LCCG) or similar (UZC-CG) algorithms, both with velocity linking length of . Such a velocity link is much more liberal than imposing that the velocities all lie within from the median as done in Hickson et al. (1992) and here. Indeed, according to Table 5, the median velocity dispersion of UZC-CG groups of 4 or more galaxies is , i.e. 25% greater than in our sample. This suggests that the UZC-CG sample is more contaminated by chance alignments of galaxies along the line-of-sight (as Mamon, 1986 had suggested for the HCG sample) than is our sample. Moreover, the UZC-CG has a liberal linking length on projected distances of , making these groups not so compact (as can be checked by their low mean group surface brightness as seen in Table 5). Finally, the UZC-CG is based upon Zwicky’s visually estimated magnitudes, which may carry rms errors as large as 0.5 mag, thus washing out in part the effects of the magnitude gap and luminosity segregation.
On the other hand, the LCCG sample (again, restricted to groups with at least 4 members) has a very similar median velocity dispersion to our sample (and a similar median mass-to-light ratio). Note that the linking length for projected distances of the LCCG is only , i.e. 4 times less than in UZC-CG. The problem with the LCCG is that its parent catalogue (the LCRS, Shectman et al., 1996) is a collection of two samples with and . Thus the magnitude range is very restricted. Hence, it is not a surprise that is half our value (Table 5), leading to and .
What does this tell us on the nature of the groups in the different CG samples? Over 25 years ago, Mamon (1986) found and no signs of luminosity segregation in the largest sample then available of 41 velocity-filtered HCGs with at least 4 members. This was in sharp contrast with the low values of and significant luminosity segregation he was finding in coalescing dense groups (Mamon, 1987a). This provided him with two arguments (among several) to conclude that most HCGs were caused by chance alignments of galaxies within larger groups (Mamon, 1986). As confirmed here with the SAM by Guo et al. (2011), roughly two-thirds of mock CGs are physically dense (Díaz-Giménez & Mamon, 2010 and Table 3 above). The statistically large magnitude gaps and luminosity segregation in both the observed v2MCGs and the mock mvCGs suggest that Mamon (1986) was misled by the bias of the HCG sample against large gaps into concluding that most of them were not physically dense.
So the v2MCG appear to be mostly bona fide physically dense groups. But can we conclude that the other CG samples are dominated by chance alignments? Díaz-Giménez & Mamon (2010) attempted to build sample of mock HCGs that include the same biases as they had measured by comparing with the three SAMs that they had built mock CGs from. They found that the same fraction (if not slightly higher) of the mock (biased) HCGs were physically dense. The nature of the groups in other CG samples could be studied in similar ways, using mock CG samples from cosmological galaxy formation simulations, mimicking their selection criteria and observational select effects.
Could the lack of HCGs with strongly dominant brightest galaxies prevent the visibility of luminosity segregation? We performed KS tests to compare the distribution of relative positions of 1st and 2nd-ranked group members for subsamples split between those dominated by 1st-ranked members (‘Dom’) and those with galaxies of more comparable luminosities (‘Non-Dom’), making our splits at the median magnitude difference . We performed this analysis for the HCG and v2MCG samples as well as for the C06K and G11 mvCG samples.
| Catalogue | subsample | ||
| v2MCG | Dom | 39 | |
| v2MCG | Non-Dom | 39 | (3.9%) |
| vHCG | Dom | 17 | 67% |
| vHCG | Non-Dom | 16 | (6.6%) |
| mvCG-G11 | Dom | 163 | |
| mvCG-G11 | Non-Dom | 163 | 1.0% |
| mvCG-C06K | Dom | 223 | |
| mvCG-C06K | Non-Dom | 225 | 0.4% |
Notes. Dom and Non-Dom subsamples are those with above and below the median value of the full sample, respectively. is the number of groups in the subsample. is the KS probability that a difference in the distributions of normalised distances to the non-weighted group centre is greater than ‘observed’ by chance. Values of given in parentheses denote reverse luminosity segregation: the 2nd-ranked galaxy is more centrally located than the first-ranked.
Table 7 shows that indeed luminosity segregation is much stronger for all catalogues in the Dom subsamples, and statistically significant in all of them except the vHCG. Surprisingly, while the Non-Dom subsamples of the two mock CG samples display much weaker, but still statistically significant luminosity segregation, the Non-Dom subsamples of both the v2MCG and vHCG catalogues display reversed luminosity segregation: the 2nd-ranked galaxy is more centrally located than the (slightly more luminous) first-ranked galaxy. We can only see one explanation for this reverse luminosity segregation, if it occurs in wavebands bluer than : late-type galaxies that are second-ranked in stellar mass, hence not centrally located, can end up more luminous (thanks to their efficient star formation) than early-type galaxies of slightly higher stellar mass. However the effect is also present in the -selected v2MCG, and with even greater statistical significance (96.1% vs. 93.7% confidence for the Non-Dom CGs of the v2MCG and vHCG catalogues, respectively). So, we can only explain this marginal effect as a statistical fluke.
Nevertheless, the absence of luminosity segregation in the HCG catalogue could be consistent with their physical reality because the sample is too small to detect the weak luminosity segregation expected from the mocks. Moreover, if the reverse luminosity segregation for Non-Dom groups is real, then the lack of groups with very dominant galaxies in the HCG (caused by the visual selection bias) would cause the Non-Dom groups to cancel the luminosity segregation of the Dom groups.
In conclusion, the v2MCG sample has numerous advantages over other CG samples:
-
1.
It is the largest available sample of velocity-filtered groups of at least 4 members of comparable luminosity (3 mags, i.e. factor 16).
-
2.
It has an isolation criterion (in contrast with other CG samples except for the HCG).
-
3.
It is automatically extracted (contrary to the HCG).
-
4.
It has a well-defined magnitude limit (which the HCG sample does not).
-
5.
It is deep enough (which some may find surprising given the shallowness of its parent 2MASS catalogue) to have a selection on brightest galaxy magnitude, so as to ensure that all groups can span the maximum allowed magnitude gap of 3.
-
6.
It is selected by stellar mass ( band), which is expected to be a better tracer for magnitude gaps and luminosity segregation (among other things).
-
7.
It is the only sample to show statistical signs of mergers (magnitude gaps) and luminosity segregation, expected in physically dense groups (in contrast with all other CG samples).
The last point implies that the v2MCG is the only CG sample for which one is reasonably sure that it is dominated by physically dense groups. For all these reasons, the v2MCG appears to be the sample one ought to study in depth to probe the effects on galaxies of this unique environment of 4 galaxies of comparable luminosity lying close together in real space.
As a next step in this project, we are in the process of measuring redshifts for the members for which no spectra are available, and we are continuing our statistical studies of the v2MCGs and their galaxies.
8 Acknowledgments
We thank the anonymous referee for helpful comments that improved this work.
We dedicate this article to John P. Huchra (1948–2010), who among his numerous contributions to astronomy, played a crucial role in obtaining redshifts for the galaxies in groups in general and HCGs in particular. We thank Roya Mohayaee and Guilhem Lavaux for useful discussions on peculiar velocities and Igor Chilingarian on -corrections and internal extinctions.
This publication makes use of data products from the Two Micron All Sky Survey, which is a joint project of the University of Massachusetts and the Infrared Processing and Analysis Centre/California Institute of Technology, funded by the National Aeronautics and Space Administration and the National Science Foundation. This research has made use of VizieR and Aladin at the Centre de Données astronomiques de Strasbourg (CDS). This research made use of the “K-corrections calculator” service available at http://kcor.sai.msu.ru/. An SM version (kcorr_Chilingarian) is available at ftp://ftp.iap.fr/from_users/gam/SOFT/gam_macros. The Millennium and Millennium II Simulation databases used in this paper and the web application providing online access to them were constructed as part of the activities of the German Astrophysical Virtual Observatory This work was partially supported by Consejo de Investigaciones Científicas y Técnicas de la República Argentina (CONICET) and Fundação de Amparo à Pesquisa do Estado do São Paulo (FAPESP). CMdO acknowledges financial support from FAPESP and CNPq.
References
- Allam & Tucker (2000) Allam S. S., Tucker D. L., 2000, Astronomische Nachrichten, 321, 101
- Arp (1966) Arp H., 1966, ApJS, 14, 1
- Arp & Madore (1987) Arp H. C., Madore B. F., 1987, A Catalogue of Southern Peculiar Galaxies and Associations 2 volume set, Arp, H. C. & Madore, B. F., ed.
- Barnes (1985) Barnes J., 1985, MNRAS, 215, 517
- Barton et al. (1996) Barton E., Geller M., Ramella M., Marzke R. O., da Costa L. N., 1996, AJ, 112, 871
- Beers et al. (1990) Beers T. C., Flynn K., Gebhardt K., 1990, AJ, 100, 32
- Binney & Tremaine (1987) Binney J., Tremaine S., 1987, Galactic Dynamics. Princeton, NJ, Princeton University Press, 1987
- Bode et al. (1993) Bode P. W., Cohn H. N., Lugger P. M., 1993, ApJ, 416, 17
- Bonnarel et al. (2000) Bonnarel F., Fernique P., Bienaymé O., Egret D., Genova F., Louys M., Ochsenbein F., Wenger M., Bartlett J. G., 2000, A&AS, 143, 33
- Borthakur et al. (2010) Borthakur S., Yun M. S., Verdes-Montenegro L., 2010, ApJ, 710, 385
- Bower et al. (2006) Bower R. G., Benson A. J., Malbon R., Helly J. C., Frenk C. S., Baugh C. M., Cole S., Lacey C. G., 2006, MNRAS, 370, 645
- Boylan-Kolchin et al. (2009) Boylan-Kolchin M., Springel V., White S. D. M., Jenkins A., Lemson G., 2009, MNRAS, 398, 1150
- Cardelli et al. (1989) Cardelli J. A., Clayton G. C., Mathis J. S., 1989, ApJ, 345, 245
- Carnevali et al. (1981) Carnevali P., Cavaliere A., Santangelo P., 1981, ApJ, 249, 449
- Chilingarian et al. (2010) Chilingarian I. V., Melchior A.-L., Zolotukhin I. Y., 2010, MNRAS, 405, 1409
- Coziol et al. (1998) Coziol R., Ribeiro A. L. B., de Carvalho R. R., Capelato H. V., 1998, ApJ, 493, 563
- Crook et al. (2008) Crook A. C., Huchra J. P., Martimbeau N., Masters K. L., Jarrett T., Macri L. M., 2008, ApJ, 685, 1320
- Croton et al. (2006) Croton D. J., Springel V., White S. D. M., De Lucia G., Frenk C. S., Gao L., Jenkins A., Kauffmann G., Navarro J. F., Yoshida N., 2006, MNRAS, 365, 11
- de Carvalho et al. (2005) de Carvalho R. R., Gonçalves T. S., Iovino A., Kohl-Moreira J. L., Gal R. R., Djorgovski S. G., 2005, AJ, 130, 425
- de la Rosa et al. (2007) de la Rosa I. G., de Carvalho R. R., Vazdekis A., Barbuy B., 2007, AJ, 133, 330
- de la Rosa et al. (2001) de la Rosa I. G., de Carvalho R. R., Zepf S. E., 2001, AJ, 122, 93
- De Lucia & Blaizot (2007) De Lucia G., Blaizot J., 2007, MNRAS, 375, 2
- Deng et al. (2008) Deng X.-F., He J.-Z., Ma X.-S., Jiang P., Tang X.-X., 2008, Central European Journal of Physics, 6, 185
- Díaz-Giménez & Mamon (2010) Díaz-Giménez E., Mamon G., 2010, MNRAS, 409, 1227
- Focardi & Kelm (2002) Focardi P., Kelm B., 2002, A&A, 391, 35
- Górski et al. (2005) Górski K. M., Hivon E., Banday A. J., Wandelt B. D., Hansen F. K., Reinecke M., Bartelmann M., 2005, ApJ, 622, 759
- Guo et al. (2011) Guo Q., White S., Boylan-Kolchin M., De Lucia G., Kauffmann G., Lemson G., Li C., Springel V., Weinmann S., 2011, MNRAS, 413, 101
- Hickson (1982) Hickson P., 1982, ApJ, 255, 382
- Hickson et al. (1989) Hickson P., Kindl E., Auman J. R., 1989, ApJS, 7, 687
- Hickson et al. (1992) Hickson P., Mendes de Oliveira C., Huchra J. P., Palumbo G. G., 1992, ApJ, 399, 353
- Hickson et al. (1984) Hickson P., Ninkov Z., Huchra J., Mamon G., 1984, in Clusters and Groups of Galaxies, Mardirossian F., Giuricin G., Mezzetti M., eds., Reidel, Dordrecht, pp. 367–373
- Huchra et al. (2012) Huchra J. P., Macri L. M., Masters K. L., Jarrett T. H., Berlind P., Calkins M., Crook A. C., Cutri R., Erdoğdu P., Falco E., George T., Hutcheson C. M., Lahav O., Mader J., Mink J. D., Martimbeau N., Schneider S., Skrutskie M., Tokarz S., Westover M., 2012, ApJS, 199,
- Iovino (2002) Iovino A., 2002, AJ, 124, 2471
- Iovino et al. (2003) Iovino A., de Carvalho R., Gal R., Odewahn S., Lopes P., Mahabal A., Djorgovski S., 2003, AJ, 125, 1660
- Jarrett et al. (2000) Jarrett T. H., Chester T., Cutri R., Schneider S., Skrutskie M., Huchra J. P., 2000, AJ, 119, 2498
- Karachentsev (1972) Karachentsev I. D., 1972, Astrofizicheskie Issledovaniia Izvestiya Spetsial’noj Astrofizicheskoj Observatorii, 7, 3
- Karachentsev et al. (1988) Karachentsev V. E., Karachentsev I. D., Lebedev V. S., 1988, Astrofizicheskie Issledovaniia Izvestiya Spetsial’noj Astrofizicheskoj Observatorii, 26, 42
- Karachentseva & Karachentsev (2000) Karachentseva V. E., Karachentsev I. D., 2000, Astronomy Reports, 44, 501
- Lavaux & Hudson (2011) Lavaux G., Hudson M. J., 2011, MNRAS, 416, 2840
- Lavaux et al. (2010) Lavaux G., Tully R. B., Mohayaee R., Colombi S., 2010, ApJ, 709, 483
- Lee et al. (2004) Lee B. C., Allam S. S., Tucker D. L., Annis J., Johnston D. E., Scranton R., Acebo Y., Bahcall N. A., Bartelmann M., Böhringer H., Ellman N., Grebel E. K., Infante L., Loveday J., McKay T. A., Prada F., Schneider D. P., Stoughton C., Szalay A. S., Vogeley M. S., Voges W., Yanny B., 2004, AJ, 127, 1811
- Lin et al. (2010) Lin Y.-T., Ostriker J. P., Miller C. J., 2010, ApJ, 715, 1486
- Loh & Strauss (2006) Loh Y.-S., Strauss M. A., 2006, MNRAS, 366, 373
- Maller et al. (2005) Maller A. H., McIntosh D. H., Katz N., Weinberg M. D., 2005, ApJ, 619, 147
- Mamon (1986) Mamon G. A., 1986, ApJ, 307, 426
- Mamon (1987a) —, 1987a, ApJ, 321, 622
- Mamon (1987b) —, 1987b, in Bulletin of the American Astronomical Society, Vol. 19, Bulletin of the American Astronomical Society, pp. 651–651
- Mamon (1989) —, 1989, A&A, 219, 98
- Mamon (1992) —, 1992, ApJ, 401, L3
- Mamon (1994) —, 1994, Ap&SS, 217, 237
- Mamon (2008) —, 2008, A&A, 486, 113
- Masters et al. (2003) Masters K. L., Giovanelli R., Haynes M. P., 2003, AJ, 126, 158
- McConnachie et al. (2009) McConnachie A. W., Patton D. R., Ellison S. L., Simard L., 2009, MNRAS, 395, 255
- Mendes de Oliveira & Hickson (1991) Mendes de Oliveira C., Hickson P., 1991, ApJ, 380, 30
- Moles et al. (1994) Moles M., del Olmo A., Perea J., Masegosa J., Marquez I., Costa V., 1994, A&A, 285, 404
- Mould et al. (2000) Mould J. R., Huchra J. P., Freedman W. L., Kennicutt Jr. R. C., Ferrarese L., Ford H. C., Gibson B. K., Graham J. A., Hughes S. M. G., Illingworth G. D., Kelson D. D., Macri L. M., Madore B. F., Sakai S., Sebo K. M., Silbermann N. A., Stetson P. B., 2000, ApJ, 529, 786
- Poggianti (1997) Poggianti B. M., 1997, A&A, 122, 399
- Pompei & Iovino (2012) Pompei E., Iovino A., 2012, A&A, 539, A106
- Ponman et al. (1996) Ponman T. J., Bourner P. D. J., Ebeling H., Böhringer H., 1996, MNRAS, 283, 690
- Prandoni et al. (1994) Prandoni I., Iovino A., MacGillivray H. T., 1994, AJ, 107, 1235
- Ramella et al. (2002) Ramella M., Geller M. J., Pisani A., da Costa L. N., 2002, AJ, 123, 2976
- Rose (1977) Rose J. A., 1977, ApJ, 211, 311
- Schlegel et al. (1998) Schlegel D. J., Finkbeiner D. P., Davis M., 1998, ApJ, 500, 525
- Seyfert (1948) Seyfert C. K., 1948, AJ, 53, 203
- Shectman et al. (1996) Shectman S. A., Landy S. D., Oemler A., Tucker D. L., Lin H., Kirshner R. P., Schechter P. L., 1996, ApJ, 470, 172
- Skibba et al. (2011) Skibba R. A., van den Bosch F. C., Yang X., More S., Mo H., Fontanot F., 2011, MNRAS, 410, 417
- Skrutskie et al. (2006) Skrutskie M. F., Cutri R. M., Stiening R., Weinberg M. D., Schneider S., Carpenter J. M., Beichman C., Capps R., Chester T., Elias J., Huchra J., Liebert J., Lonsdale C., Monet D. G., Price S., Seitzer P., Jarrett T., Kirkpatrick J. D., Gizis J. E., Howard E., Evans T., Fowler J., Fullmer L., Hurt R., Light R., Kopan E. L., Marsh K. A., McCallon H. L., Tam R., Van Dyk S., Wheelock S., 2006, AJ, 131, 1163
- Springel et al. (2005) Springel V., White S. D. M., Jenkins A., Frenk C. S., Yoshida N., Gao L., Navarro J., Thacker R., Croton D., Helly J., Peacock J. A., Cole S., Thomas P., Couchman H., Evrard A., Colberg J., Pearce F., 2005, Nature, 435, 629
- Stephan (1877) Stephan M., 1877, MNRAS, 37, 334
- Sulentic (1997) Sulentic J. W., 1997, ApJ, 482, 640
- Terry et al. (2002) Terry J. N., Paturel G., Ekholm T., 2002, A&A, 393, 57
- Torres-Flores et al. (2010) Torres-Flores S., Mendes de Oliveira C., Amram P., Plana H., Epinat B., Carignan C., Balkowski C., 2010, ArXiv e-prints: 1003.0345
- Tovmassian et al. (1999) Tovmassian H. M., Martinez O., Tiersch H., 1999, A&A, 348, 693
- Tremaine & Richstone (1977) Tremaine S. D., Richstone D. O., 1977, ApJ, 212, 311
- Tzanavaris et al. (2010) Tzanavaris P., Hornschemeier A. E., Gallagher S. C., Johnson K. E., Gronwall C., Immler S., Reines A. E., Hoversten E., Charlton J. C., 2010, ApJ, 716, 556
- Verdes-Montenegro et al. (2001) Verdes-Montenegro L., Yun M. S., Williams B. A., Huchtmeier W. K., Del Olmo A., Perea J., 2001, A&A, 377, 812
- Vorontsov-Velyaminov et al. (2001) Vorontsov-Velyaminov B. A., Noskova R. I., Arkhipova V. P., 2001, Astronomical and Astrophysical Transactions, 20, 717
- Wainer & Thissen (1976) Wainer H., Thissen D., 1976, Psychometrica, 41, 9
- Walke & Mamon (1989) Walke D. G., Mamon G. A., 1989, A&A, 225, 291
- White et al. (1999) White R. A., Bliton M., Bhavsar S. P., Bornmann P., Burns J. O., Ledlow M. J., Loken C., 1999, AJ, 118, 2014
Appendix A Transformation from to
In the visual search performed by Hickson (1982) on the photographic plates of POSS-I, he established a cutoff in surface brightness of . The POSS-I band roughly corresponds to the more familiar Cousins band. As the galaxy database used for our search is selected in the band, we converted the original limit of Hickson (1982) to a corresponding one for magnitudes. The – colours161616we drop the ‘s’ subscript on the band for clarity. of galaxies depend on their luminosity (colour-luminosity relation) and morphology (e.g. Red Sequence vs. Blue Cloud).
We cross-identified the SDSS DR7 model and magnitudes, and extinctions, and redshifts with the 2MASS XSC 20 isophotal and magnitudes, with a maximum separation of between the positions of the galaxies in the two catalogues. We corrected the 2MASS magnitudes for galactic extinction using the values of SDSS, assuming , , and from spline fits of vs. tabulated by Cardelli et al. (1989) and directly from their table. We then -corrected the SDSS and 2MASS extinction-corrected magnitudes using the redshifts and extinction-corrected – (SDSS) and the – (2MASS) colours using the transformations of Chilingarian et al. (2010). This enabled us to derive extinction- and -corrected – colours.
In a first pass, we adopt the conservative –=2.33, which, with –=0.33 (Díaz-Giménez & Mamon, 2010) yields . Once we extract the p2MCGs and then the velocity-filtered v2MCGs with this compactness limit, we find that the mean galaxy luminosity in our v2MCGs is and our median v2MCG mean velocity is , corresponding to .
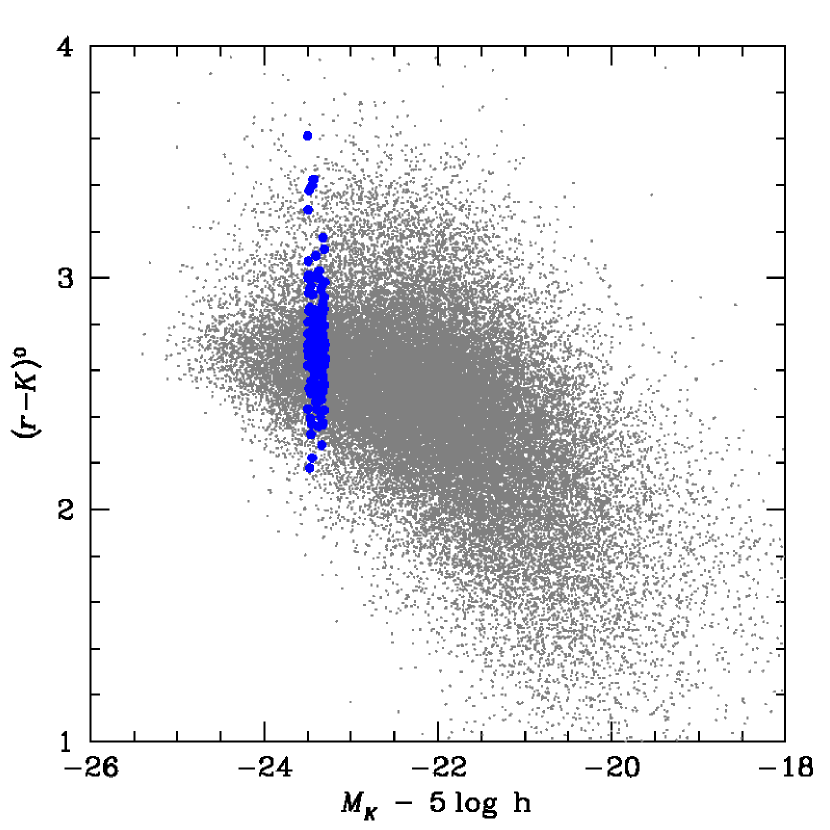
In a second pass, we consider the – colours for the 45974 galaxies among the 326320 SDSS-2MASS matches, with SDSS zWarn=0, , and 2MASS artifact flag cc_flg=0 and both and confusion flags, respectively j_flg_k20fe and k_flg_k20fe, equal to 0 (grey points of Fig. 8). Restricting these matched galaxies to those with and (large blue points in Fig. 8) yields a median of (assuming that the error on the median is , valid for large Gaussian distributions) for 164 galaxies.
With –=0.33, this yields –=2.39. For clarity, we therefore assume and adopt a compactness limit of . The v2MCGs obtained with this new compactness limit have very similar median redshifts (now 1.5% larger), although the median -band group luminosities are now one-third lower (mainly because of the additional 0.4 magnitude correction from to ).
Appendix B Comparison with different SAMs
In Fig. 5, we showed the comparison of the distributions of velocity-filtered CG properties between the v2MCG and the mvCG (from Guo et al., 2011 run on the MS-II) samples. In Fig. 9, we show this comparison for several SAMs: Left upper panels: mvCGs identified from Croton et al. (2006)’s SAM in the -band, Right upper panels: mvCGs identified from Croton et al. (2006)’s SAM in the -band, Left lower panels: mvCGs identified from Bower et al. (2006)’s SAM in the -band, Right lower panels: mvCGs identified from De Lucia & Blaizot (2007)’s SAM in the -band.
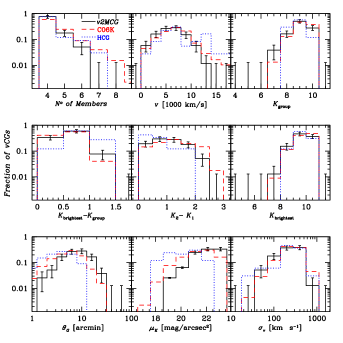
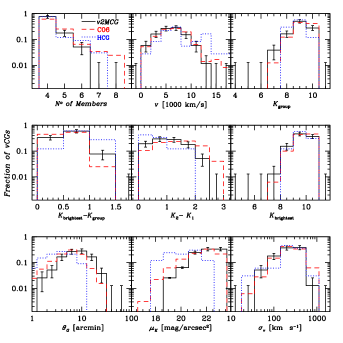
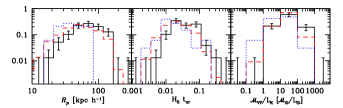
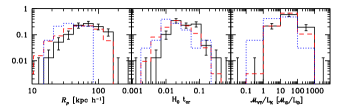
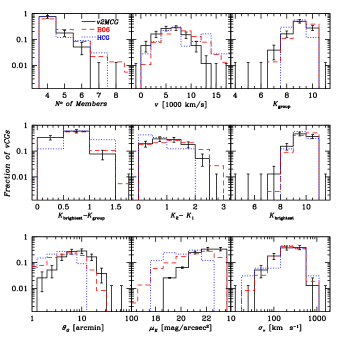
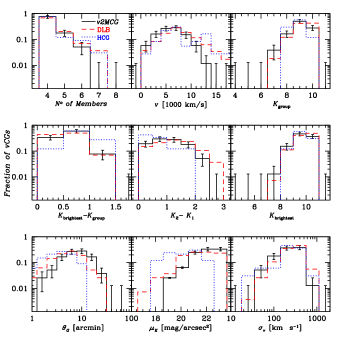
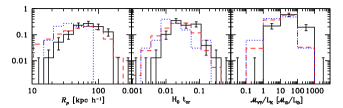
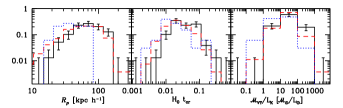
Appendix C Properties of CGs after velocity-filtering in the 2MASS XSC
| ID | RA | Dec | cross-ID | ||||||||||
|---|---|---|---|---|---|---|---|---|---|---|---|---|---|
| (J2000) | [] | [] | [arcmin] | [kpc/] | [] | [] | |||||||
| 1 | 00:00:43 | 28:23:18 | 8705 | 5 | 10.41 | 19.92 | 2.34 | 43.44 | 0.67 | 322 | 0.012 | 28 | HCG 99, KTG 83,VV 854 |
| 2 | 00:00:59 | -43:22:47 | 11525 | 4 | 10.14 | 22.23 | 6.07 | 121.73 | 0.30 | 479 | 0.023 | 148 | |
| 3 | 00:28:54 | 02:45:34 | 4241 | 5 | 8.58 | 23.18 | 18.04 | 50.06 | 0.08 | 175 | 0.026 | 11 | UZC-CG 7, VV 894 |
| 4 | 00:39:24 | 00:52:28 | 4209 | 4 | 9.33 | 21.00 | 5.58 | 45.56 | 0.53 | 130 | 0.032 | 10 | HCG 7, UZC-CG 9, USGC U024 |
| 5 | 00:56:42 | -52:56:40 | 7561 | 4 | 9.50 | 21.29 | 5.71 | 92.15 | 0.37 | 534 | 0.016 | 108 | |
| 6 | 00:57:48 | -05:02:22 | 5345 | 6 | 10.20 | 22.81 | 11.38 | 85.80 | 0.46 | 294 | 0.026 | 90 | |
| 7 | 01:08:58 | -45:48:11 | 7598 | 4 | 9.87 | 21.05 | 4.18 | 44.85 | 0.11 | 291 | 0.014 | 29 | |
| 8 | 01:13:55 | -31:48:02 | 5687 | 4 | 8.79 | 21.15 | 7.30 | 85.77 | 0.78 | 293 | 0.027 | 39 | SCG 1 |
| 9 | 01:26:05 | 34:41:39 | 4742 | 4 | 9.21 | 22.08 | 10.63 | 92.15 | 0.41 | 257 | 0.032 | 44 | HCG 10, RSCG 12 |
| 10 | 01:43:24 | -34:14:40 | 3786 | 4 | 10.11 | 23.20 | 11.09 | 62.52 | 0.24 | 149 | 0.038 | 46 | SCG 0141-3429 |
| 11 | 02:07:39 | 02:08:30 | 7042 | 4 | 10.40 | 22.57 | 7.60 | 89.13 | 0.40 | 443 | 0.018 | 226 | HCG 15 |
| 12 | 02:09:49 | -10:13:37 | 3874 | 5 | 9.04 | 22.82 | 17.94 | 63.75 | 0.12 | 147 | 0.039 | 10 | HCG 16, USGC S077, RSCG 19, VV 1007 |
| 13 | 02:36:55 | 07:22:28 | 6310 | 4 | 9.48 | 23.38 | 14.37 | 168.32 | 0.50 | 325 | 0.047 | 110 | USGC U136 |
| 14 | 02:42:05 | -15:04:36 | 7437 | 4 | 10.57 | 21.03 | 3.59 | 53.33 | 0.29 | 73 | 0.066 | 3 | SCG 19, USGC S093 |
| 15 | 02:45:07 | -17:42:28 | 7412 | 4 | 9.75 | 22.91 | 13.61 | 164.29 | 0.28 | 218 | 0.068 | 38 | HCG 21 |
| 16 | 03:03:50 | -12:02:25 | 3648 | 4 | 8.73 | 21.52 | 8.45 | 67.71 | 0.32 | 396 | 0.016 | 122 | SCG 3 |
| 17 | 03:07:05 | -09:35:15 | 4851 | 4 | 9.87 | 21.75 | 7.04 | 65.73 | 0.69 | 330 | 0.018 | 106 | HCG 23, SCG 11 |
| 18 | 03:07:29 | -66:48:22 | 5580 | 4 | 9.55 | 23.48 | 16.76 | 194.28 | 0.74 | 174 | 0.101 | 61 | SCG 0306-6659 |
| 19 | 03:17:44 | -10:19:56 | 8882 | 4 | 10.06 | 22.58 | 6.97 | 103.54 | 0.35 | 440 | 0.021 | 135 | |
| 20 | 03:20:40 | -01:04:18 | 6288 | 4 | 10.52 | 21.87 | 4.55 | 47.93 | 0.40 | 87 | 0.050 | 6 | HCG 25 |
| 21 | 03:25:22 | -06:09:30 | 10335 | 4 | 10.44 | 22.12 | 5.85 | 116.75 | 0.36 | 157 | 0.067 | 17 | |
| 22 | 03:46:31 | -04:12:39 | 3917 | 5 | 8.18 | 23.38 | 29.15 | 140.46 | 0.40 | 145 | 0.088 | 15 | |
| 23 | 04:51:45 | -03:52:38 | 4633 | 4 | 10.14 | 22.83 | 8.34 | 74.54 | 0.57 | 83 | 0.082 | 13 | |
| 24 | 04:59:25 | -11:08:00 | 3823 | 6 | 9.03 | 22.60 | 18.32 | 99.91 | 0.56 | 357 | 0.025 | 59 | KTS 28, VV 699 |
| 25 | 06:03:55 | -32:06:38 | 9565 | 4 | 10.09 | 23.16 | 9.23 | 129.26 | 0.10 | 460 | 0.026 | 73 | |
| 26 | 06:43:41 | -74:14:45 | 6458 | 4 | 9.54 | 21.37 | 6.09 | 59.98 | 0.23 | 377 | 0.014 | 58 | VV 785 |
| 27 | 07:04:34 | 64:03:45 | 4468 | 4 | 9.55 | 22.99 | 11.27 | 94.36 | 0.25 | 66 | 0.129 | 8 | |
| 28 | 07:26:32 | 85:37:41 | 2177 | 4 | 7.74 | 22.71 | 22.30 | 83.25 | 0.46 | 262 | 0.029 | 98 | VV 1189 |
| 29 | 07:40:56 | 55:25:55 | 10752 | 4 | 9.90 | 19.38 | 1.73 | 32.21 | 0.42 | 436 | 0.007 | 32 | |
| 30 | 09:05:05 | 18:21:41 | 4188 | 5 | 9.01 | 23.51 | 17.54 | 142.04 | 0.79 | 391 | 0.033 | 317 | VV 612 |
| 31 | 09:16:30 | 30:52:02 | 6954 | 4 | 9.82 | 22.64 | 8.38 | 85.16 | 0.11 | 73 | 0.106 | 3 | |
| 32 | 09:27:57 | 30:00:35 | 7994 | 4 | 10.24 | 21.21 | 3.56 | 48.52 | 0.64 | 387 | 0.011 | 106 | |
| 33 | 09:34:23 | 10:09:24 | 3141 | 4 | 8.86 | 23.29 | 19.19 | 105.31 | 0.37 | 355 | 0.027 | 207 | RSCG 33, VV 1290/1292 |
| 34 | 09:38:55 | -04:51:05 | 6633 | 5 | 9.73 | 18.60 | 1.74 | 15.19 | 0.36 | 189 | 0.007 | 4 | HCG 40, VV 116 |
| 35 | 10:00:01 | -19:34:37 | 4020 | 4 | 8.18 | 22.74 | 18.18 | 105.27 | 0.08 | 119 | 0.081 | 6 | HCG 42 |
| 36 | 10:25:07 | 28:03:09 | 6361 | 4 | 10.14 | 21.84 | 5.07 | 72.55 | 0.84 | 188 | 0.035 | 47 | |
| 37 | 10:37:15 | -26:14:56 | 3433 | 4 | 9.29 | 22.59 | 10.66 | 79.84 | 0.59 | 268 | 0.027 | 142 | |
| 38 | 10:39:43 | -23:49:47 | 3758 | 4 | 9.97 | 23.32 | 11.88 | 100.45 | 0.95 | 159 | 0.057 | 71 | |
| 39 | 10:51:52 | 50:56:02 | 7491 | 5 | 10.08 | 23.14 | 11.22 | 139.23 | 0.46 | 497 | 0.025 | 78 | VV 1393 |
| 40 | 11:09:46 | 21:46:22 | 9552 | 4 | 10.01 | 21.52 | 4.81 | 64.52 | 0.08 | 103 | 0.057 | 3 | |
| 41 | 11:16:12 | 18:07:46 | 896 | 4 | 7.11 | 21.95 | 21.98 | 36.44 | 0.33 | 289 | 0.011 | 98 | |
| 42 | 11:22:21 | 24:18:31 | 7619 | 4 | 10.07 | 21.12 | 4.07 | 63.83 | 0.20 | 322 | 0.018 | 46 | HCG 51, UZC-CG 138, VV 1435 |
| 43 | 11:35:11 | 51:12:03 | 8010 | 4 | 10.41 | 21.94 | 4.76 | 57.86 | 0.44 | 325 | 0.016 | 102 | |
| 44 | 11:42:10 | 10:18:52 | 6218 | 5 | 9.63 | 21.86 | 8.82 | 91.33 | 0.60 | 173 | 0.048 | 17 | HCG 58, UZC-CG 144 |
| 45 | 11:42:51 | 26:31:54 | 9054 | 4 | 10.06 | 22.87 | 9.91 | 126.33 | 0.11 | 355 | 0.032 | 68 | |
| 46 | 11:44:06 | 33:30:45 | 9381 | 4 | 10.16 | 21.25 | 3.78 | 67.96 | 0.43 | 144 | 0.043 | 8 | |
| 47 | 11:57:06 | 55:17:50 | 948 | 4 | 7.42 | 22.44 | 23.41 | 51.99 | 0.45 | 211 | 0.022 | 88 | |
| 48 | 12:19:22 | 05:57:42 | 2156 | 4 | 7.40 | 21.67 | 16.44 | 73.71 | 0.39 | 348 | 0.019 | 89 | |
| 49 | 12:24:31 | 07:09:38 | 994 | 5 | 6.79 | 22.83 | 36.02 | 64.63 | 0.46 | 215 | 0.027 | 91 | |
| 50 | 12:27:47 | 12:11:30 | 1024 | 4 | 8.99 | 23.12 | 15.53 | 28.03 | 0.32 | 557 | 0.005 | 1560 | |
| 51 | 12:43:17 | 11:25:08 | 1117 | 5 | 5.81 | 22.16 | 45.77 | 75.83 | 0.38 | 363 | 0.019 | 56 | M60 CG, VV 206/1558 |
| 52 | 13:01:58 | 27:37:34 | 7473 | 4 | 10.03 | 21.90 | 5.07 | 61.27 | 0.21 | 704 | 0.008 | 401 | |
| 53 | 13:06:50 | -40:22:49 | 4768 | 4 | 8.83 | 22.20 | 10.29 | 118.12 | 0.55 | 116 | 0.092 | 14 | HDCE 0761 |
| 54 | 13:08:15 | 34:01:53 | 10120 | 4 | 10.50 | 23.41 | 10.77 | 180.87 | 0.54 | 185 | 0.089 | 47 | |
| 55 | 13:22:02 | -17:21:16 | 6909 | 5 | 9.95 | 22.11 | 6.15 | 71.02 | 0.44 | 241 | 0.027 | 50 | |
| 56 | 13:24:31 | 14:01:36 | 7087 | 4 | 9.37 | 22.75 | 11.94 | 177.44 | 0.47 | 278 | 0.058 | 76 | |
| 57 | 13:52:16 | 02:20:05 | 7095 | 4 | 9.80 | 20.74 | 3.42 | 51.30 | 0.52 | 50 | 0.094 | 1 | |
| 58 | 13:53:01 | -28:27:48 | 4713 | 5 | 8.54 | 21.08 | 7.27 | 43.75 | 0.13 | 261 | 0.015 | 20 | |
| 59 | 14:00:33 | -02:51:35 | 7325 | 6 | 9.82 | 21.73 | 6.12 | 60.26 | 0.31 | 322 | 0.017 | 37 | |
| 60 | 14:19:14 | 35:08:15 | 8534 | 4 | 10.34 | 22.52 | 6.12 | 74.71 | 0.28 | 52 | 0.131 | 3 | |
| 61 | 14:27:27 | 11:19:18 | 8078 | 4 | 10.45 | 22.51 | 6.47 | 108.69 | 0.70 | 424 | 0.023 | 245 | |
| 62 | 14:28:02 | 25:53:33 | 4388 | 4 | 9.33 | 21.86 | 8.31 | 67.15 | 0.58 | 216 | 0.028 | 42 | |
| 63 | 14:58:09 | -19:10:04 | 3387 | 4 | 8.48 | 23.41 | 23.18 | 158.56 | 0.52 | 107 | 0.134 | 14 | |
— CGs after velocity filtering in the 2MASS XSC
ID
RA
Dec
cross-ID
(J2000)
[]
[]
[arcmin]
[kpc/]
[]
[]
64
15:36:22
43:29:29
5660
5
9.62
22.19
9.19
102.35
0.71
197
0.047
28
65
16:12:50
33:02:06
9429
4
10.51
21.73
4.32
91.69
0.20
108
0.077
4
VV 1801
66
16:37:53
36:03:18
9614
4
9.91
22.45
7.62
105.18
0.17
204
0.047
23
67
19:14:47
-54:36:26
5400
4
9.48
23.15
13.64
110.24
0.13
224
0.045
33
68
19:51:59
-30:49:31
5891
4
9.47
20.22
3.90
46.60
0.80
368
0.011
50
HCG 86
69
20:00:59
-47:04:38
6804
4
10.02
20.19
2.92
29.28
0.16
317
0.008
30
KTS 61, Rose 38, NGC6845, VV 1880
70
20:03:14
-56:00:10
4413
4
8.01
21.62
12.97
93.18
0.30
84
0.100
3
71
20:17:25
-70:41:58
3969
4
7.77
22.94
28.03
167.79
0.20
488
0.031
148
VV 297
72
20:43:41
-26:34:43
12406
4
10.45
21.45
3.81
95.20
0.68
268
0.032
38
73
20:47:22
00:23:32
3779
6
8.89
21.83
11.03
71.64
0.58
254
0.026
43
74
20:52:24
-05:45:16
6028
4
9.85
22.19
7.70
68.51
0.16
80
0.077
5
HCG 88
75
21:08:25
-29:45:32
5935
4
9.57
23.48
14.46
166.54
0.82
53
0.285
6
SCG 2105-2957
76
21:17:01
-42:19:38
5337
4
9.46
22.32
9.77
123.47
0.81
112
0.100
11
SCG 2113-4235
77
22:03:28
12:38:56
8113
4
9.83
20.15
2.66
39.48
0.51
465
0.008
69
WBL 677
78
22:36:24
-24:18:35
10314
4
10.30
21.57
4.21
95.89
0.12
103
0.084
4
79
22:55:22
-33:54:22
8761
4
10.21
20.21
2.39
41.13
0.65
175
0.021
10
VV 1957
80
22:58:09
26:07:30
7588
5
9.25
22.17
8.95
137.84
0.72
201
0.062
22
UZC-CG 282, VV 84
81
23:15:18
19:00:38
4922
4
9.00
21.58
8.31
70.59
0.41
237
0.027
37
HCG 93, USGC U837, Arp 99
82
23:28:03
-67:47:18
3904
4
9.82
21.54
6.04
42.88
0.46
176
0.022
25
83
23:28:18
32:25:09
5066
4
9.18
21.58
7.15
68.01
0.59
344
0.018
58
84
23:47:27
-02:18:37
6665
5
10.07
21.38
5.23
64.89
0.73
415
0.014
94
HCG 97, RSCG 87
85
23:53:35
07:59:10
5218
5
9.15
22.68
15.93
142.35
0.52
233
0.055
33
Notes. ID: Group ID, RA: Right Ascension of the CG centre, Dec: Declination of the CG centre,
: Median velocity,
: Number of galaxy members in the CG in the range of 3 magnitudes from the brightest member,
: Galactic Extinction-corrected -band apparent magnitude of the brightest galaxy,
: Galactic Extinction-corrected -band group surface brightness,
: Angular diameter of the smallest circumscribed circle,
: Median projected separation among galaxies,
: Apparent group elongation,
: Radial velocity dispersion of the galaxies in the CG computed using individual galaxy errors,
: Dimensionless crossing time,
: Mass to Light ratio in the -band,
cross-ID: Cross-identification with other group catalogues
References for cross-ID:
AM: Arp+Madore Southern Peculiar Galaxies and Associations (Arp & Madore, 1987);
Arp: Arp Peculiar Galaxies (Arp, 1966);
HCG: Hickson Compact Group (Hickson, 1982);
HDCE: High-density-contrast groups - Erratum version (Crook et al., 2008);
KPG: Karachentsev Isolated Pairs of Galaxies Catalogue (Karachentsev, 1972);
KTG: Karachentsev Isolated Triplets of Galaxies Catalogue (Karachentsev et al., 1988);
KTS: Karachentseva Triple System (Karachentseva & Karachentsev, 2000);
M60: (Mamon, 1989, 2008);
Rose: Rose Compact Groups of Galaxies (Rose, 1977);
RSCG: Redshift Survey Compact Group (Barton et al., 1996);
SCG: Southern Compact Group (Prandoni et al., 1994; Iovino, 2002);
UZC-CG:Updated Zwicky Catalogue-Compact Group (Focardi & Kelm, 2002);
USGC: UZC/SSRS2 Group Catalogue (Ramella et al., 2002);
VV: Interacting galaxies catalogue (Vorontsov-Velyaminov et al., 2001)
WBL: White+Bliton+Bhavsar groups (White et al., 1999);
| GroupID | GalID | RA | Dec | err() | SDSS_ID | 2MASS_ID | ||||
|---|---|---|---|---|---|---|---|---|---|---|
| (J2000) | [] | source | ||||||||
| 1 | 1 | 00:00:46.97 | 28:24:07.28 | 10.41 | –0.06 | 8764 | 19 | 1 | 758874298530726152 | 00004696+2824071 |
| 1 | 2 | 00:00:37.94 | 28:23:04.34 | 10.46 | –0.05 | 8705 | 9 | 1 | 758874298530726255 | 00003794+2823041 |
| 1 | 3 | 00:00:44.00 | 28:24:05.22 | 11.53 | –0.04 | 8156 | 0 | 1 | 758874298530726153 | 00004401+2824051 |
| 1 | 4 | 00:00:42.41 | 28:22:08.43 | 13.26 | –0.03 | 9006 | 0 | 2 | 758874298530791466 | 00004242+2822081 |
| 1 | 5 | 00:00:45.09 | 28:22:18.18 | 13.40 | –0.08 | 8642 | 0 | 2 | 758874298530791773 | 00004507+2822181 |
| 2 | 1 | 00:01:02.89 | –43:19:49.57 | 10.14 | –0.07 | 11627 | 45 | 1 | 000000000000000000 | 00010289–4319496 |
| 2 | 2 | 00:00:53.00 | –43:23:31.43 | 11.59 | –0.05 | 11980 | 40 | 1 | 000000000000000000 | 00005298–4323316 |
| 2 | 3 | 00:00:57.05 | –43:25:47.60 | 12.27 | –0.06 | 10964 | 45 | 2 | 000000000000000000 | 00005702–4325476 |
| 2 | 4 | 00:00:52.18 | –43:20:02.38 | 12.47 | –0.06 | 11422 | 0 | 2 | 000000000000000000 | 00005216–4320026 |
| 3 | 1 | 00:29:15.06 | 02:51:50.58 | 8.58 | –0.02 | 4241 | 16 | 1 | 000000000000000000 | 00291506+0251505 |
| 3 | 2 | 00:28:29.78 | 02:38:54.98 | 10.88 | –0.03 | 4317 | 29 | 1 | 000000000000000000 | 00282976+0238549 |
| 3 | 3 | 00:29:08.10 | 02:48:39.97 | 11.36 | –0.03 | 4046 | 25 | 1 | 000000000000000000 | 00290809+0248400 |
| 3 | 4 | 00:29:18.55 | 02:52:13.56 | 11.51 | –0.03 | 4433 | 0 | 1 | 000000000000000000 | 00291854+0252135 |
| 3 | 5 | 00:29:12.40 | 02:52:21.42 | 11.53 | –0.02 | 4093 | 0 | 1 | 000000000000000000 | 00291239+0252215 |
| 4 | 1 | 00:39:13.39 | 00:51:50.87 | 9.33 | –0.03 | 4177 | 3 | 1 | 588015510347382842 | 00391339+0051508 |
| 4 | 2 | 00:39:17.84 | 00:54:45.88 | 10.14 | –0.03 | 4239 | 1 | 1 | 588015510347382865 | 00391786+0054458 |
| 4 | 3 | 00:39:34.85 | 00:51:35.68 | 10.51 | –0.03 | 4379 | 3 | 1 | 588015510347448339 | 00393485+0051355 |
| 4 | 4 | 00:39:18.79 | 00:53:31.01 | 12.07 | –0.02 | 4107 | 0 | 2 | 588015510347382868 | 00391879+0053308 |
| 5 | 1 | 00:56:41.65 | –52:58:33.32 | 9.50 | –0.05 | 7779 | 31 | 1 | 000000000000000000 | 00564165–5258332 |
| 5 | 2 | 00:56:57.57 | –52:55:26.10 | 10.08 | –0.04 | 7342 | 29 | 1 | 000000000000000000 | 00565758–5255262 |
| 5 | 3 | 00:56:43.64 | –52:53:49.16 | 11.85 | –0.04 | 7331 | 28 | 2 | 000000000000000000 | 00564365–5253492 |
| 5 | 4 | 00:56:42.17 | –52:59:31.44 | 12.29 | –0.06 | 8392 | 45 | 2 | 000000000000000000 | 00564220–5259312 |
| 6 | 1 | 00:58:01.60 | –05:04:16.44 | 10.20 | –0.03 | 5184 | 45 | 1 | 000000000000000000 | 00580158–0504165 |
| 6 | 2 | 00:57:55.36 | –05:07:49.53 | 10.34 | –0.03 | 5314 | 45 | 1 | 000000000000000000 | 00575536–0507495 |
| 6 | 3 | 00:57:42.39 | –04:56:55.11 | 10.96 | –0.03 | 5375 | 45 | 1 | 000000000000000000 | 00574239–0456548 |
| 6 | 4 | 00:57:47.87 | –05:06:43.52 | 11.16 | –0.03 | 5454 | 36 | 1 | 000000000000000000 | 00574786–0506435 |
| 6 | 5 | 00:57:39.24 | –05:05:09.92 | 11.60 | –0.03 | 4845 | 45 | 1 | 000000000000000000 | 00573925–0505098 |
| 6 | 6 | 00:57:35.09 | –05:00:09.00 | 11.73 | –0.04 | 5675 | 45 | 1 | 000000000000000000 | 00573510–0500088 |
| 7 | 1 | 01:09:04.55 | –45:46:24.73 | 9.87 | –0.05 | 7746 | 27 | 1 | 000000000000000000 | 01090456–4546246 |
| 7 | 2 | 01:08:51.85 | –45:49:57.50 | 10.60 | –0.05 | 7207 | 37 | 1 | 000000000000000000 | 01085185–4549577 |
| 7 | 3 | 01:08:57.40 | –45:48:15.63 | 12.60 | –0.05 | 7768 | 0 | 2 | 000000000000000000 | 01085740–4548157 |
| 7 | 4 | 01:09:01.03 | –45:48:04.83 | 12.86 | –0.07 | 7449 | 0 | 2 | 000000000000000000 | 01090103–4548047 |
| 8 | 1 | 01:13:47.26 | –31:44:50.00 | 8.79 | –0.04 | 5738 | 45 | 1 | 000000000000000000 | 01134725–3144500 |
| 8 | 2 | 01:13:51.26 | –31:47:18.04 | 9.62 | –0.04 | 5636 | 19 | 1 | 000000000000000000 | 01135125–3147180 |
| 8 | 3 | 01:14:10.95 | –31:49:38.06 | 10.89 | –0.04 | 5594 | 45 | 1 | 000000000000000000 | 01141094–3149382 |
| 8 | 4 | 01:13:43.18 | –31:50:35.21 | 11.25 | –0.05 | 6228 | 45 | 1 | 000000000000000000 | 01134317–3150350 |
| 9 | 1 | 01:25:40.29 | 34:42:46.68 | 9.21 | –0.04 | 4822 | 18 | 1 | 758877278694080872 | 01254030+3442465 |
| 9 | 2 | 01:26:21.78 | 34:42:10.89 | 9.34 | –0.03 | 5188 | 5 | 1 | 758877153601913092 | 01262177+3442107 |
| 9 | 3 | 01:26:18.83 | 34:45:14.93 | 10.62 | –0.03 | 4660 | 32 | 1 | 758877153601978381 | 01261884+3445147 |
| 9 | 4 | 01:26:30.85 | 34:40:31.76 | 11.64 | –0.02 | 4662 | 0 | 1 | 758877153601913329 | 01263085+3440318 |
| 10 | 1 | 01:43:09.68 | –34:14:30.85 | 10.11 | –0.03 | 3801 | 45 | 1 | 000000000000000000 | 01430966–3414305 |
| 10 | 2 | 01:43:18.35 | –34:12:21.62 | 10.72 | –0.01 | 3770 | 45 | 1 | 000000000000000000 | 01431837–3412216 |
| 10 | 3 | 01:43:45.06 | –34:18:07.33 | 11.30 | –0.03 | 3756 | 31 | 1 | 000000000000000000 | 01434505–3418070 |
| 10 | 4 | 01:43:02.96 | –34:11:14.44 | 12.47 | –0.02 | 4093 | 32 | 2 | 000000000000000000 | 01430297–3411143 |
| 11 | 1 | 02:07:53.08 | 02:10:03.37 | 10.40 | –0.05 | 6966 | 30 | 1 | 000000000000000000 | 02075306+0210034 |
| 11 | 2 | 02:07:34.13 | 02:06:55.17 | 11.01 | –0.05 | 7117 | 36 | 1 | 000000000000000000 | 02073411+0206554 |
| 11 | 3 | 02:07:37.52 | 02:10:50.62 | 11.50 | –0.04 | 6243 | 36 | 1 | 000000000000000000 | 02073751+0210504 |
| 11 | 4 | 02:07:25.29 | 02:06:58.08 | 11.76 | –0.05 | 7196 | 0 | 2 | 000000000000000000 | 02072527+0206579 |
| 12 | 1 | 02:09:24.60 | –10:08:09.15 | 9.04 | –0.02 | 4174 | 45 | 1 | 587727177926508587 | 02092458–1008091 |
| 12 | 2 | 02:09:20.86 | –10:07:59.15 | 9.54 | –0.02 | 3854 | 2 | 1 | 587727177926508588 | 02092086–1007591 |
| 12 | 3 | 02:09:38.53 | –10:08:46.57 | 9.81 | –0.01 | 3849 | 1 | 1 | 587727177926574089 | 02093853–1008466 |
| 12 | 4 | 02:09:42.74 | –10:11:01.80 | 9.92 | –0.01 | 3874 | 5 | 1 | 000000000000000000 | 02094273–1011016 |
| 12 | 5 | 02:10:17.55 | –10:19:15.72 | 10.61 | –0.02 | 4045 | 45 | 1 | 000000000000000000 | 02101756–1019157 |
| 13 | 1 | 02:37:14.48 | 07:18:20.27 | 9.48 | –0.04 | 6498 | 61 | 1 | 587744296044986466 | 02371447+0718201 |
| 13 | 2 | 02:36:31.62 | 07:18:34.23 | 10.77 | –0.02 | 6122 | 3 | 1 | 587744296044920962 | 02363162+0718342 |
| 13 | 3 | 02:37:16.50 | 07:20:08.95 | 11.46 | –0.05 | 6546 | 49 | 1 | 587744296044986609 | 02371649+0720091 |
| 13 | 4 | 02:37:20.26 | 07:26:23.32 | 11.52 | –0.03 | 5931 | 0 | 1 | 587744296044986628 | 02372026+0726231 |
| 14 | 1 | 02:42:06.28 | –15:05:29.24 | 10.57 | –0.05 | 7396 | 31 | 1 | 000000000000000000 | 02420629–1505289 |
| 14 | 2 | 02:42:05.74 | –15:02:48.78 | 10.58 | –0.04 | 7328 | 23 | 1 | 000000000000000000 | 02420573–1502489 |
| 14 | 3 | 02:42:04.98 | –15:06:23.88 | 12.03 | –0.05 | 7477 | 270 | 3 | 000000000000000000 | 02420497–1506239 |
| 14 | 4 | 02:42:01.38 | –15:03:23.91 | 12.74 | –0.06 | 7476 | 0 | 2 | 000000000000000000 | 02420138–1503239 |
— Table of galaxy positions GroupID GalID RA Dec err() SDSS_ID 2MASS_ID (J2000) [] source 15 1 02:44:53.65 –17:39:32.92 9.75 –0.05 7272 45 1 000000000000000000 02445363–1739330 15 2 02:45:36.08 –17:41:20.16 9.83 –0.04 7550 45 1 000000000000000000 02453607–1741201 15 3 02:45:18.02 –17:42:30.09 9.99 –0.04 7682 45 1 000000000000000000 02451802–1742301 15 4 02:44:39.73 –17:43:35.99 12.01 –0.05 7272 45 2 000000000000000000 02443974–1743359 16 1 03:03:54.48 –11:59:30.48 8.73 –0.03 3986 45 1 000000000000000000 03035448–1159306 16 2 03:03:35.20 –12:04:34.72 9.94 –0.03 3384 22 1 000000000000000000 03033518–1204349 16 3 03:04:06.22 –12:00:55.65 11.13 –0.02 3265 35 1 000000000000000000 03040620–1200556 16 4 03:03:32.80 –12:02:23.16 11.17 –0.03 3911 36 1 000000000000000000 03033280–1202229 17 1 03:06:55.94 –09:32:38.66 9.87 –0.03 4825 45 1 000000000000000000 03065595–0932389 17 2 03:07:09.47 –09:35:33.55 10.11 –0.02 4876 11 1 000000000000000000 03070944–0935334 17 3 03:07:18.38 –09:36:45.48 10.56 –0.03 5199 45 1 000000000000000000 03071837–0936454 17 4 03:06:55.22 –09:37:42.86 12.00 –0.04 4466 21 2 000000000000000000 03065521–0937429 18 1 03:06:31.08 –66:46:32.20 9.55 –0.03 5521 10 1 000000000000000000 03063104–6646320 18 2 03:07:02.09 –66:56:19.20 9.99 –0.04 5639 45 1 000000000000000000 03070209–6656192 18 3 03:07:40.74 –66:40:04.47 10.92 –0.04 5762 45 1 000000000000000000 03074073–6640045 18 4 03:08:39.99 –66:53:03.40 11.44 –0.04 5398 45 1 000000000000000000 03083999–6653035 19 1 03:17:45.52 –10:17:20.72 10.06 –0.06 8984 39 1 000000000000000000 03174554–1017207 19 2 03:17:35.93 –10:18:50.78 11.94 –0.05 8778 45 2 000000000000000000 03173593–1018511 19 3 03:17:42.95 –10:23:24.41 12.61 –0.05 9562 0 2 000000000000000000 03174295–1023247 19 4 03:17:46.00 –10:16:28.59 12.82 –0.06 8633 0 2 000000000000000000 03174601–1016287 20 1 03:20:45.41 –01:02:40.87 10.52 –0.04 6413 3 1 587731511545757880 03204541–0102407 20 2 03:20:42.94 –01:06:30.89 11.66 –0.03 6268 2 1 588015507680723132 03204294–0106307 20 3 03:20:38.55 –01:02:06.05 12.41 –0.05 6307 2 2 587731511545757775 03203854–0102057 20 4 03:20:45.34 –01:03:14.06 12.51 –0.03 6229 0 2 588015507680723008 03204534–0103137 21 1 03:25:11.58 –06:10:51.17 10.44 –0.05 10092 2 1 587724242304565362 03251157–0610510 21 2 03:25:25.37 –06:08:38.02 10.82 –0.05 10316 3 1 587724242304630856 03252538–0608380 21 3 03:25:31.39 –06:07:43.98 11.93 –0.05 10435 2 2 587724242304630877 03253137–0607438 21 4 03:25:19.37 –06:12:21.02 13.01 –0.04 10353 0 2 587724242304630917 03251935–0612210 22 1 03:46:27.25 –03:58:07.63 8.18 –0.02 3908 45 1 000000000000000000 03462726–0358075 22 2 03:45:43.12 –04:05:29.68 9.27 –0.02 3972 45 1 000000000000000000 03454312–0405295 22 3 03:46:35.94 –04:27:11.52 9.62 –0.02 3740 45 1 000000000000000000 03463595–0427115 22 4 03:46:07.16 –04:04:09.13 9.98 –0.03 3916 45 1 000000000000000000 03460717–0404093 22 5 03:46:03.07 –04:08:17.17 10.07 –0.03 4136 45 1 000000000000000000 03460309–0408173 23 1 04:51:41.51 –03:48:33.68 10.14 –0.02 4764 30 1 758885351078232088 04514150–0348335 23 2 04:51:55.95 –03:55:47.66 11.48 –0.03 4607 23 1 758887369173827734 04515593–0355475 23 3 04:51:41.75 –03:50:29.54 11.95 –0.03 4578 45 2 758885351078232404 04514177–0350295 23 4 04:51:28.41 –03:52:12.53 12.09 –0.02 4659 45 2 758885351078166820 04512841–0352124 24 1 04:59:25.89 –10:58:50.54 9.03 –0.03 3740 7 1 000000000000000000 04592589–1058504 24 2 04:59:27.73 –11:07:22.62 9.24 –0.02 3762 11 1 000000000000000000 04592771–1107224 24 3 04:59:17.38 –11:07:07.20 9.35 –0.03 4500 9 1 000000000000000000 04591738–1107071 24 4 04:59:22.89 –11:07:56.34 9.43 –0.02 3883 42 1 000000000000000000 04592288–1107561 24 5 04:59:41.37 –11:16:17.44 10.77 –0.02 3700 45 1 000000000000000000 04594137–1116175 24 6 04:58:50.32 –11:04:53.04 11.78 –0.02 4390 45 2 000000000000000000 04585029–1104531 25 1 06:03:39.89 –32:08:52.03 10.09 –0.05 9233 38 1 000000000000000000 06033989–3208521 25 2 06:03:38.22 –32:09:19.99 11.96 –0.06 9912 45 2 000000000000000000 06033824–3209201 25 3 06:04:13.62 –32:03:57.30 12.33 –0.03 9090 45 2 000000000000000000 06041362–3203574 25 4 06:03:42.26 –32:09:42.48 12.41 –0.04 9896 45 2 000000000000000000 06034225–3209422 26 1 06:43:06.02 –74:14:10.45 9.54 –0.04 6504 120 1 000000000000000000 06430596–7414103 26 2 06:44:17.48 –74:16:36.32 10.61 –0.04 6153 28 1 000000000000000000 06441744–7416364 26 3 06:43:25.51 –74:15:25.74 10.64 –0.04 6411 33 1 000000000000000000 06432557–7415255 26 4 06:43:06.00 –74:12:55.17 11.21 –0.05 7000 150 1 000000000000000000 06430602–7412553 27 1 07:04:20.30 64:01:12.98 9.55 –0.03 4497 6 1 000000000000000000 07042030+6401132 27 2 07:05:23.68 64:05:32.50 11.33 –0.02 4530 48 1 000000000000000000 07052368+6405326 27 3 07:03:45.99 64:01:57.06 11.50 –0.03 4380 0 1 000000000000000000 07034600+6401570 27 4 07:05:19.69 64:02:26.83 11.54 –0.04 4438 0 1 000000000000000000 07051971+6402266 28 1 07:32:20.49 85:42:31.90 7.74 –0.01 1905 7 1 000000000000000000 07322048+8542319 28 2 07:27:14.36 85:45:16.37 9.25 –0.01 2415 2 1 000000000000000000 07271448+8545162 28 3 07:34:57.53 85:32:13.90 10.03 –0.02 2050 51 1 000000000000000000 07345760+8532138 28 4 07:17:47.09 85:42:47.75 10.61 –0.02 2303 22 1 000000000000000000 07174680+8542479 29 1 07:40:58.22 55:25:37.92 9.90 –0.06 10229 27 1 000000000000000000 07405822+5525379 29 2 07:41:00.08 55:25:13.89 11.84 –0.03 11037 0 2 000000000000000000 07410010+5525139 29 3 07:40:52.73 55:26:36.89 12.20 –0.06 11018 0 2 000000000000000000 07405269+5526369 29 4 07:40:59.74 55:26:21.01 12.66 –0.07 10485 0 2 000000000000000000 07405974+5526209
— Table of galaxy positions GroupID GalID RA Dec err() SDSS_ID 2MASS_ID (J2000) [] source 30 1 09:05:21.32 18:18:47.18 9.01 –0.03 4189 21 1 587741708330074118 09052131+1818472 30 2 09:04:39.02 18:27:51.92 11.08 –0.02 3423 5 1 587741708330008623 09043901+1827521 30 3 09:05:32.39 18:15:44.45 11.45 –0.04 4250 2 1 588023045866193011 09053239+1815445 30 4 09:04:39.32 18:15:26.33 11.94 –0.03 3635 2 2 587741708329943218 09043929+1815261 30 5 09:05:18.35 18:26:32.15 11.95 –0.03 4188 2 2 587741708330074178 09051836+1826322 31 1 09:16:41.85 30:54:55.33 9.82 –0.04 6949 2 1 588017979413299278 09164185+3054551 31 2 09:16:15.64 30:49:26.32 11.60 –0.05 6812 2 1 588017979413233753 09161561+3049261 31 3 09:16:37.66 30:54:19.33 11.65 –0.05 6958 2 1 588017979413299279 09163765+3054191 31 4 09:16:46.19 30:54:39.25 12.32 –0.02 6974 2 2 588017979413299280 09164620+3054391 32 1 09:27:52.82 29:59:08.64 10.24 –0.04 7993 2 1 587739158725001301 09275281+2959085 32 2 09:28:00.92 30:02:13.33 11.81 –0.06 7993 2 2 587739158725001338 09280090+3002135 32 3 09:28:04.06 29:59:29.31 12.30 –0.05 8296 1 2 587739115781947490 09280405+2959294 32 4 09:27:57.72 30:00:39.63 12.97 –0.01 7424 0 2 587739158725001442 09275774+3000395 33 1 09:33:46.09 10:09:09.09 8.86 –0.02 3231 2 3 587735344799350868 09334609+1009093 33 2 09:34:02.78 10:06:31.49 9.99 –0.02 3144 1 1 587735344799350940 09340276+1006315 33 3 09:34:47.54 10:17:01.42 10.15 –0.01 2432 8 1 587735344799481904 09344754+1017014 33 4 09:34:00.18 10:01:46.51 11.37 –0.02 3136 5 1 587734949661769909 09340019+1001465 34 1 09:38:53.47 –04:50:55.32 9.73 –0.05 6627 27 1 000000000000000000 09385347–0450553 34 2 09:38:53.62 –04:51:36.58 10.32 –0.03 6405 6 1 000000000000000000 09385360–0451365 34 3 09:38:54.96 –04:51:57.31 10.71 –0.05 6842 27 1 000000000000000000 09385496–0451573 34 4 09:38:55.76 –04:50:13.45 10.92 –0.04 6837 45 1 000000000000000000 09385576–0450134 34 5 09:38:55.29 –04:51:28.47 12.17 –0.04 6632 23 2 000000000000000000 09385529–0451284 35 1 10:00:14.14 –19:38:11.21 8.18 –0.03 3964 10 1 000000000000000000 10001412–1938113 35 2 09:59:29.19 –19:29:32.18 10.12 –0.03 4004 17 1 000000000000000000 09592917–1929323 35 3 10:00:10.29 –19:37:18.53 10.40 –0.03 4034 45 1 000000000000000000 10001030–1937183 35 4 10:00:33.11 –19:39:43.13 10.63 –0.03 4228 18 1 000000000000000000 10003309–1939433 36 1 10:24:59.32 28:01:26.00 10.14 –0.05 6417 27 1 587741566050304065 10245932+2801259 36 2 10:25:07.28 28:05:41.04 11.60 –0.04 6130 2 1 587741566050369539 10250725+2805409 36 3 10:25:13.58 28:00:58.31 12.26 –0.04 6520 2 2 587741534390517974 10251359+2800584 36 4 10:25:18.72 28:03:20.38 12.43 –0.04 6304 0 2 587741566050369557 10251872+2803204 37 1 10:37:29.09 –26:19:01.22 9.29 –0.02 3358 45 1 000000000000000000 10372908–2619014 37 2 10:36:56.64 –26:11:39.32 10.88 –0.02 3251 45 1 000000000000000000 10365664–2611391 37 3 10:37:37.87 –26:16:38.32 10.97 –0.02 3815 45 1 000000000000000000 10373785–2616384 37 4 10:37:00.43 –26:19:05.25 11.78 –0.02 3507 45 2 000000000000000000 10370041–2619051 38 1 10:39:34.06 –23:55:21.69 9.97 –0.03 3813 45 1 000000000000000000 10393405–2355217 38 2 10:40:08.94 –23:49:13.31 10.69 –0.03 3619 45 1 000000000000000000 10400892–2349132 38 3 10:39:26.11 –23:45:17.50 11.56 –0.01 3955 45 1 000000000000000000 10392612–2345176 38 4 10:39:40.26 –23:53:15.73 12.83 –0.02 3703 0 2 000000000000000000 10394025–2353157 39 1 10:51:43.67 51:01:19.76 10.08 –0.05 7491 3 1 588013383811923987 10514368+5101195 39 2 10:51:44.49 51:01:30.32 10.44 –0.04 7137 0 1 588013383811923988 10514450+5101303 39 3 10:51:53.71 51:00:23.47 12.01 –0.05 8277 3 2 588013383811924105 10515373+5100234 39 4 10:51:23.23 50:55:51.54 12.24 –0.03 7281 2 2 588013383811858538 10512323+5055516 39 5 10:52:00.77 50:50:34.70 12.55 –0.05 7805 0 2 588013383811924012 10520073+5050344 40 1 11:09:44.43 21:45:31.88 10.01 –0.06 9542 2 1 587742061602734111 11094441+2145316 40 2 11:09:50.31 21:48:36.88 11.40 –0.06 9432 2 1 587742014350557248 11095029+2148366 40 3 11:09:41.19 21:44:25.54 11.62 –0.05 9659 2 1 587742061602734109 11094118+2144256 40 4 11:09:42.82 21:44:07.82 12.37 –0.07 9562 0 0 587742061602734112 11094283+2144076 41 1 11:16:54.66 18:03:06.51 7.11 –0.01 959 20 1 587742865818779699 11165465+1803065 41 2 11:16:58.95 18:08:54.95 8.17 –0.01 1253 5 1 587742571074355242 11165896+1808547 41 3 11:15:26.95 18:06:37.29 9.48 –0.01 832 9 1 587742571074158634 11152695+1806373 41 4 11:16:46.61 18:01:01.74 9.78 –0.01 642 1 1 587742865818779669 11164662+1801017 42 1 11:22:26.35 24:17:56.93 10.07 –0.05 7539 2 1 587741829122555933 11222635+2417567 42 2 11:22:13.28 24:19:02.12 11.24 –0.05 7699 23 1 587742190436352010 11221325+2419017 42 3 11:22:14.22 24:18:00.88 11.47 –0.06 8200 3 1 587741829122556024 11221420+2418007 42 4 11:22:30.55 24:17:59.96 11.99 –0.06 7527 2 2 587741829122555934 11223052+2417597 43 1 11:35:00.00 51:13:04.81 10.41 –0.05 8085 2 1 588013382204194882 11345999+5113048 43 2 11:35:13.62 51:09:42.87 11.75 –0.05 7949 2 1 588013382204194936 11351359+5109426 43 3 11:35:15.64 51:12:13.68 12.22 –0.05 7393 2 2 588013382204194957 11351563+5112136 43 4 11:35:08.66 51:14:24.72 13.14 –0.04 8071 0 2 588013382204194911 11350862+5114247 44 1 11:42:11.09 10:16:39.88 9.63 –0.02 6267 6 1 587734893288095762 11421107+1016398 44 2 11:42:23.72 10:15:50.88 9.92 –0.04 6475 2 1 587734893288095841 11422374+1015508 44 3 11:41:52.95 10:18:15.83 10.30 –0.04 6074 2 1 587732772126261318 11415296+1018160 44 4 11:42:05.86 10:21:04.51 10.70 –0.04 6217 2 1 587732772126261358 11420585+1021047 44 5 11:42:04.90 10:23:02.98 11.81 –0.02 6093 4 2 587732772126261508 11420490+1023027
— Table of galaxy positions GroupID GalID RA Dec err() SDSS_ID 2MASS_ID (J2000) [] source 45 1 11:42:32.86 26:29:19.89 10.06 –0.05 9090 3 1 587741600954712088 11423285+2629198 45 2 11:42:52.24 26:32:26.21 10.93 –0.05 8543 2 1 587741600954712170 11425225+2632260 45 3 11:43:11.85 26:33:32.17 11.05 –0.06 9017 3 1 587741600954777644 11431185+2633320 45 4 11:43:10.74 26:34:28.25 11.67 –0.06 9320 3 1 587741708346327131 11431073+2634280 46 1 11:44:13.99 33:30:52.21 10.16 –0.06 9517 3 1 587739405705150546 11441398+3330521 46 2 11:44:03.35 33:32:06.14 11.73 –0.05 9325 3 1 587739405705150521 11440335+3332060 46 3 11:44:09.32 33:28:56.16 12.33 –0.05 9435 3 2 587739405705150653 11440934+3328561 46 4 11:44:04.32 33:32:33.97 12.65 –0.04 9230 0 2 587739405705150522 11440431+3332340 47 1 11:57:56.15 55:27:12.79 7.42 –0.01 1040 13 1 587733081348571206 11575616+5527128 47 2 11:56:28.15 55:07:31.15 8.92 –0.01 1113 3 1 587731869633871916 11562816+5507313 47 3 11:55:45.11 55:19:14.29 9.63 –0.01 855 4 1 587733081348440213 11554511+5519144 47 4 11:57:35.58 55:27:31.64 9.63 –0.01 695 40 1 587733081348571153 11573559+5527318 48 1 12:19:23.26 05:49:28.96 7.40 –0.02 2238 7 1 588010360162091053 12192326+0549289 48 2 12:19:22.24 06:05:55.53 8.64 –0.01 1776 2 1 588010360698961934 12192224+0605556 48 3 12:19:35.78 05:50:48.35 9.98 –0.02 2507 1 1 588010880371851309 12193577+0550484 48 4 12:19:49.19 06:00:53.93 10.02 –0.02 2073 19 1 588010880371851341 12194918+0600541 49 1 12:24:28.23 07:19:03.07 6.79 –0.01 1242 6 1 588017729225752606 12242822+0719030 49 2 12:23:39.00 07:03:14.33 9.04 –0.01 751 24 1 588017728688750698 12233902+0703141 49 3 12:23:38.69 06:57:14.32 9.05 –0.01 993 1 1 588017728688750678 12233869+0657141 49 4 12:24:54.92 07:26:40.24 9.41 0.00 771 3 1 588017729225818214 12245493+0726404 49 5 12:25:42.66 07:13:00.33 9.78 –0.01 999 5 1 588017724937994262 12254263+0713001 50 1 12:27:53.57 12:17:35.62 8.99 –0.01 723 18 1 588017703470366754 12275357+1217354 50 2 12:27:27.36 12:17:25.20 10.56 –0.01 934 10 1 588017703470301335 12272735+1217252 50 3 12:27:41.22 12:18:57.41 10.95 –0.01 1113 2 1 588017703470301247 12274122+1218574 50 4 12:28:08.59 12:05:35.74 11.25 –0.02 1921 3 1 588017566027546723 12280859+1205356 51 1 12:43:40.00 11:33:09.40 5.81 –0.01 1116 6 1 588017702398328841 12434000+1133093 51 2 12:42:02.32 11:38:48.95 6.86 0.00 409 6 1 588017569774370819 12420232+1138489 51 3 12:43:32.55 11:34:56.88 8.19 –0.01 1394 5 1 588017702398263345 12433254+1134568 51 4 12:44:31.98 11:11:25.89 8.23 –0.01 1083 4 1 588017569237762053 12443197+1111259 51 5 12:42:47.43 11:26:32.89 8.24 –0.01 1164 10 1 588017702398197833 12424743+1126328 52 1 13:01:53.75 27:37:27.87 10.03 –0.06 7856 2 1 587741602573058054 13015375+2737277 52 2 13:02:07.91 27:38:54.03 12.02 –0.05 6898 2 2 587741602573058113 13020791+2738539 52 3 13:01:48.39 27:36:14.48 12.88 –0.06 8229 0 2 587741602572992587 13014841+2736147 52 4 13:02:01.05 27:39:10.80 12.90 –0.05 7089 0 2 587741602573058178 13020106+2739109 53 1 13:06:26.13 –40:24:52.56 8.83 0.00 4500 14 1 000000000000000000 13062614–4024521 53 2 13:06:32.24 –40:19:07.21 11.12 –0.03 4772 45 1 000000000000000000 13063226–4019071 53 3 13:07:16.26 –40:21:02.55 11.15 –0.04 4778 45 1 000000000000000000 13071625–4021026 53 4 13:07:12.09 –40:24:27.36 11.31 –0.03 4764 59 1 000000000000000000 13071206–4024276 54 1 13:08:35.62 33:58:33.03 10.50 –0.06 10151 3 1 587739406786560053 13083562+3358330 54 2 13:07:54.82 34:05:13.34 11.17 –0.06 10087 3 1 587739406786494548 13075483+3405131 54 3 13:08:04.17 34:00:27.19 11.26 –0.06 9943 3 1 587739406786494592 13080418+3400272 54 4 13:08:27.01 34:04:13.37 12.20 –0.03 10339 0 2 587739406786560033 13082700+3404129 55 1 13:21:50.81 –17:20:11.35 9.95 –0.05 7064 39 1 000000000000000000 13215080–1720114 55 2 13:21:54.15 –17:21:36.41 11.89 –0.05 6908 45 2 000000000000000000 13215415–1721364 55 3 13:22:07.60 –17:24:07.86 12.07 –0.02 7370 45 2 000000000000000000 13220758–1724080 55 4 13:22:15.68 –17:21:38.06 12.69 –0.03 6888 0 2 000000000000000000 13221568–1721380 55 5 13:22:06.79 –17:22:37.51 12.72 –0.05 6767 0 2 000000000000000000 13220680–1722374 56 1 13:24:10.02 13:58:35.32 9.37 –0.05 6885 2 1 587738568710357008 13241000+1358351 56 2 13:24:28.90 14:05:33.28 9.98 –0.05 7320 27 1 587736808298774638 13242889+1405332 56 3 13:24:24.17 13:56:15.19 11.51 –0.04 6826 2 1 587738568710357048 13242415+1356152 56 4 13:24:52.47 14:04:38.15 12.25 –0.03 7288 5 2 587736808298840234 13245247+1404382 57 1 13:52:10.08 02:19:30.39 9.80 –0.05 7109 31 1 587726032797696030 13521008+0219305 57 2 13:52:22.83 02:20:44.83 11.64 –0.05 6997 2 1 587726032797696100 13522284+0220448 57 3 13:52:14.56 02:21:34.31 12.05 –0.04 7107 3 2 587726032797696243 13521455+0221345 57 4 13:52:11.55 02:18:54.71 12.51 –0.04 7082 0 2 587726032797696031 13521155+0218545 58 1 13:52:53.32 –28:29:21.54 8.54 –0.03 4713 45 1 000000000000000000 13525331–2829213 58 2 13:52:59.18 –28:28:14.39 10.60 –0.03 4783 45 1 000000000000000000 13525917–2828141 58 3 13:53:15.02 –28:25:39.40 10.74 –0.03 4427 35 1 000000000000000000 13531502–2825391 58 4 13:53:00.18 –28:27:06.35 11.24 –0.03 5047 25 1 000000000000000000 13530016–2827061 58 5 13:52:48.39 –28:29:58.18 11.45 –0.03 4531 45 1 000000000000000000 13524838–2829584 59 1 14:00:37.20 –02:51:28.05 9.82 –0.04 7446 2 1 587729776905486440 14003719–0251281 59 2 14:00:30.06 –02:48:38.40 11.25 –0.05 7856 3 1 587729776905486416 14003005–0248387 59 3 14:00:36.60 –02:54:32.37 11.49 –0.04 7204 16 1 587729772610125865 14003658–0254321 59 4 14:00:37.98 –02:54:22.37 11.95 –0.05 7581 2 2 587729772610125863 14003799–0254221 59 5 14:00:37.52 –02:52:23.13 12.12 –0.04 7064 2 2 587729776905486441 14003752–0252231 59 6 14:00:40.01 –02:49:55.26 12.51 –0.05 7165 0 2 587729776905486570 14003999–0249551
— Table of galaxy positions GroupID GalID RA Dec err() SDSS_ID 2MASS_ID (J2000) [] source 60 1 14:19:17.62 35:08:16.58 10.34 –0.05 8529 26 1 587736940371247137 14191759+3508168 60 2 14:19:21.31 35:05:31.69 11.86 –0.05 8459 2 2 587736940371247186 14192133+3505318 60 3 14:19:07.73 35:10:58.80 12.86 –0.03 8580 0 2 588017977829818403 14190772+3510588 60 4 14:19:24.77 35:07:42.73 13.06 –0.01 8538 0 2 587736940371247301 14192476+3507427 61 1 14:27:34.68 11:19:50.06 10.45 –0.06 7993 2 1 588017704556888172 14273466+1119498 61 2 14:27:14.54 11:20:21.00 11.12 –0.05 8324 2 1 588017704556888080 14271453+1120212 61 3 14:27:22.36 11:16:17.32 12.78 –0.06 8162 0 2 587736478664556756 14272235+1116172 61 4 14:27:33.02 11:22:12.03 12.81 –0.06 7424 0 2 588017704556888164 14273302+1122118 62 1 14:28:16.36 25:50:55.61 9.33 –0.03 4497 24 1 587739720299577472 14281635+2550557 62 2 14:28:07.23 25:52:07.60 10.18 –0.03 4371 2 1 587739707410415672 14280724+2552077 62 3 14:28:13.47 25:56:50.76 10.72 –0.02 4021 2 1 587739707410415654 14281346+2556507 62 4 14:27:50.79 25:50:17.11 11.27 –0.03 4405 3 1 587739720299577369 14275077+2550172 63 1 14:58:46.22 –19:16:00.69 8.48 –0.02 3350 11 1 000000000000000000 14584622–1916006 63 2 14:57:21.72 –19:12:49.32 9.67 –0.02 3423 45 1 000000000000000000 14572172–1912491 63 3 14:58:55.06 –19:14:20.70 10.44 –0.02 3291 45 1 000000000000000000 14585504–1914206 63 4 14:58:50.11 –19:03:35.76 10.82 –0.03 3521 24 1 000000000000000000 14585010–1903356 64 1 15:35:57.01 43:29:35.42 9.62 –0.04 5659 47 1 587733411526606950 15355700+4329351 64 2 15:36:42.17 43:32:21.68 10.31 –0.04 5566 2 1 587733411526672449 15364216+4332217 64 3 15:36:27.08 43:31:07.59 10.53 –0.03 6038 2 1 587733411526672426 15362709+4331075 64 4 15:36:02.79 43:30:12.37 11.45 –0.04 5597 2 1 587733411526606951 15360279+4330122 64 5 15:36:35.19 43:25:32.24 12.30 –0.05 5768 0 2 587733411526672511 15363521+4325326 65 1 16:12:40.14 33:02:05.55 10.51 –0.06 9601 3 1 587736783607365679 16124014+3302054 65 2 16:12:41.33 33:02:15.64 11.19 –0.05 9446 0 1 587736783607365680 16124129+3302158 65 3 16:13:00.77 33:02:07.08 12.99 –0.04 9368 0 2 587736783607365887 16130077+3302069 65 4 16:12:56.70 33:03:05.93 13.26 –0.06 9410 0 2 587736783607365861 16125671+3303059 66 1 16:37:53.93 36:04:23.05 9.91 –0.06 9399 3 1 587733608555216981 16375395+3604233 66 2 16:37:59.89 35:59:43.85 11.18 –0.06 9618 2 1 587733603732422719 16375990+3559438 66 3 16:37:47.18 36:06:54.12 11.68 –0.05 9856 3 1 587733608555216924 16374718+3606543 66 4 16:37:48.44 36:03:39.14 12.71 –0.09 9609 0 2 587733603732357553 16374842+3603393 67 1 19:15:34.12 –54:37:36.11 9.48 –0.04 5546 45 1 000000000000000000 19153413–5437359 67 2 19:14:22.02 –54:33:56.18 10.31 –0.04 5134 30 1 000000000000000000 19142202–5433561 67 3 19:14:12.81 –54:34:26.91 10.97 –0.04 5252 22 1 000000000000000000 19141282–5434270 67 4 19:14:01.32 –54:35:15.60 12.25 –0.04 5549 45 2 000000000000000000 19140128–5435155 68 1 19:52:08.76 –30:49:30.98 9.47 –0.04 6012 11 1 000000000000000000 19520876–3049311 68 2 19:51:59.05 –30:48:57.17 10.07 –0.03 5805 45 1 000000000000000000 19515906–3048572 68 3 19:51:57.33 –30:51:23.99 10.64 –0.03 5233 45 1 000000000000000000 19515735–3051241 68 4 19:51:51.94 –30:48:30.38 11.07 –0.04 5976 45 1 000000000000000000 19515192–3048301 69 1 20:00:58.42 –47:04:12.85 10.02 –0.04 6355 18 1 000000000000000000 20005841–4704130 69 2 20:00:56.84 –47:05:03.87 10.40 –0.05 7070 54 1 000000000000000000 20005684–4705040 69 3 20:01:05.26 –47:03:33.97 11.80 –0.06 6792 45 2 000000000000000000 20010526–4703340 69 4 20:00:53.58 –47:05:42.51 11.96 –0.03 6815 44 2 000000000000000000 20005354–4705424 70 1 20:03:27.03 –55:56:49.81 8.01 –0.03 4433 26 1 000000000000000000 20032702–5556498 70 2 20:02:47.25 –56:05:25.10 8.82 –0.03 4391 76 1 000000000000000000 20024726–5605250 70 3 20:03:01.06 –55:56:52.88 9.97 –0.03 4388 33 1 000000000000000000 20030107–5556528 70 4 20:03:41.79 –55:54:55.68 10.95 –0.03 4590 19 1 000000000000000000 20034177–5554557 71 1 20:18:19.15 –70:51:31.77 7.77 –0.03 4009 16 1 000000000000000000 20181914–7051317 71 2 20:16:56.50 –70:46:05.67 8.37 –0.03 4554 30 1 000000000000000000 20165648–7046057 71 3 20:19:29.62 –70:51:35.56 9.29 –0.02 3928 22 1 000000000000000000 20192966–7051356 71 4 20:15:23.88 –70:32:15.87 10.50 –0.03 3479 30 1 000000000000000000 20152387–7032159 72 1 20:43:45.71 –26:33:00.99 10.45 –0.07 12221 92 1 000000000000000000 20434570–2633011 72 2 20:43:49.67 –26:35:32.19 11.76 –0.06 12131 45 2 000000000000000000 20434965–2635321 72 3 20:43:33.67 –26:35:10.11 12.15 –0.06 12589 45 2 000000000000000000 20433370–2635101 72 4 20:43:38.11 –26:34:17.42 12.66 –0.07 12631 0 2 000000000000000000 20433810–2634171 73 1 20:47:19.06 00:19:14.94 8.89 –0.02 4200 2 1 587731173842026987 20471908+0019150 73 2 20:47:24.29 00:18:02.99 9.65 –0.02 3790 2 1 587731173842027210 20472428+0018030 73 3 20:47:34.09 00:24:41.89 9.97 –0.03 3768 20 1 587731173842092228 20473408+0024420 73 4 20:47:07.24 00:25:48.66 10.65 –0.02 3663 2 1 587730847960596651 20470724+0025486 73 5 20:47:10.50 00:21:47.90 11.13 –0.03 3715 2 1 587731173842026895 20471048+0021479 73 6 20:47:20.35 00:29:02.36 11.35 –0.03 4228 2 1 587730847960596912 20472035+0029020 74 1 20:52:35.46 –05:42:40.06 9.85 –0.04 5968 2 1 587727214416953538 20523547–0542399 74 2 20:52:29.69 –05:44:45.97 10.22 –0.04 6128 2 1 587727214416953446 20522971–0544459 74 3 20:52:26.02 –05:46:19.86 12.06 –0.05 5995 4 2 587727214416953420 20522602–0546198 74 4 20:52:12.74 –05:47:53.63 12.25 –0.02 6060 4 2 587726878873486063 20521275–0547538
— Table of galaxy positions
GroupID
GalID
RA
Dec
err()
SDSS_ID
2MASS_ID
(J2000)
[]
source
75
1
21:08:32.01
–29:46:08.58
9.57
–0.04
5914
45
1
000000000000000000
21083199–2946083
75
2
21:07:59.93
–29:50:08.89
10.87
–0.04
5954
31
1
000000000000000000
21075991–2950089
75
3
21:08:58.28
–29:46:58.14
11.44
–0.04
5855
31
1
000000000000000000
21085826–2946582
75
4
21:08:10.63
–29:39:04.87
11.78
–0.03
5985
31
2
000000000000000000
21081059–2939049
76
1
21:16:55.29
–42:15:36.06
9.46
–0.04
5325
19
1
000000000000000000
21165529–4215361
76
2
21:16:46.19
–42:15:42.05
10.11
–0.04
5151
45
1
000000000000000000
21164619–4215421
76
3
21:17:27.92
–42:20:22.93
10.70
–0.04
5348
33
1
000000000000000000
21172789–4220231
76
4
21:16:47.80
–42:23:47.45
12.41
–0.04
5409
0
2
000000000000000000
21164779–4223471
77
1
22:03:30.92
12:38:12.38
9.83
–0.05
8041
7
1
587730774413213871
22033093+1238124
77
2
22:03:30.31
12:39:38.75
11.15
–0.05
7895
2
1
587730774413213915
22033031+1239384
77
3
22:03:22.58
12:38:57.53
12.09
–0.03
8184
0
2
587730774413214125
22032258+1238574
77
4
22:03:33.46
12:38:54.46
12.79
–0.04
8897
0
2
587730774413213877
22033345+1238544
78
1
22:36:27.96
–24:20:30.34
10.30
–0.06
10215
37
1
000000000000000000
22362797–2420306
78
2
22:36:20.35
–24:16:40.42
11.74
–0.06
10392
45
1
000000000000000000
22362036–2416406
78
3
22:36:25.77
–24:19:54.72
12.30
–0.07
10414
45
2
000000000000000000
22362578–2419546
78
4
22:36:23.15
–24:16:46.55
12.50
–0.08
10235
0
2
000000000000000000
22362315–2416466
79
1
22:55:20.45
–33:53:16.47
10.21
–0.05
8507
45
1
000000000000000000
22552046–3353166
79
2
22:55:22.38
–33:53:41.70
11.23
–0.06
8734
38
1
000000000000000000
22552239–3353416
79
3
22:55:18.62
–33:55:13.71
12.39
–0.06
8787
150
2
000000000000000000
22551861–3355136
79
4
22:55:27.79
–33:53:49.80
12.79
–0.07
8938
0
2
000000000000000000
22552777–3353496
80
1
22:57:57.52
26:09:00.01
9.25
–0.05
7375
21
1
758883828517699894
22575750+2609000
80
2
22:58:19.56
26:03:43.03
10.59
–0.05
7662
23
1
758883828517765263
22581956+2603431
80
3
22:57:51.71
26:09:43.75
11.72
–0.05
7587
0
1
758883828517699852
22575170+2609436
80
4
22:58:24.96
26:10:12.28
12.16
–0.04
7233
0
2
758883828517765149
22582499+2610119
80
5
22:57:56.56
26:06:39.86
12.24
–0.06
7654
0
2
758883828517765157
22575655+2606400
81
1
23:15:16.08
18:57:41.04
9.00
–0.03
5072
20
1
758883880592736344
23151609+1857409
81
2
23:15:03.46
18:58:24.24
10.04
–0.03
4772
10
1
758883828521304188
23150347+1858245
81
3
23:15:17.26
19:02:29.98
10.39
–0.03
4736
3
1
758883880592670819
23151728+1902299
81
4
23:15:33.06
19:02:53.24
11.11
–0.04
5173
34
1
758883880592736265
23153308+1902529
82
1
23:28:17.74
–67:49:16.92
9.82
–0.02
3903
40
1
000000000000000000
23281779–6749170
82
2
23:27:36.97
–67:48:55.66
10.27
–0.02
3905
45
1
000000000000000000
23273700–6748557
82
3
23:28:21.97
–67:45:36.91
11.37
–0.03
3882
45
1
000000000000000000
23282200–6745369
82
4
23:28:30.81
–67:45:40.73
11.49
–0.02
4290
45
1
000000000000000000
23283081–6745409
83
1
23:28:35.11
32:24:56.65
9.18
–0.03
5131
22
1
000000000000000000
23283508+3224565
83
2
23:28:10.77
32:28:22.36
10.78
–0.03
4544
36
1
000000000000000000
23281075+3228224
83
3
23:28:23.17
32:21:44.54
10.84
–0.03
4999
29
1
000000000000000000
23282316+3221445
83
4
23:28:31.60
32:25:19.68
11.37
–0.03
5277
26
1
000000000000000000
23283161+3225195
84
1
23:47:22.99
–02:18:02.42
10.07
–0.04
6932
22
1
000000000000000000
23472298–0218025
84
2
23:47:18.91
–02:18:48.60
10.71
–0.05
6327
30
1
000000000000000000
23471891–0218485
84
3
23:47:23.79
–02:21:04.55
11.03
–0.04
6003
26
1
000000000000000000
23472378–0221045
84
4
23:47:37.84
–02:19:00.03
11.56
–0.05
6817
45
1
000000000000000000
23473787–0218598
84
5
23:47:19.86
–02:16:50.78
12.72
–0.06
6664
0
0
000000000000000000
23471984–0216505
85
1
23:53:53.88
07:58:13.99
9.15
–0.03
5373
22
1
587743797290008717
23535389+0758138
85
2
23:53:26.79
07:52:32.36
9.52
–0.03
5106
7
1
587743797290008586
23532680+0752322
85
3
23:53:19.66
07:52:15.34
9.71
–0.04
5218
7
1
587743797289943215
23531967+0752152
85
4
23:53:32.15
08:07:05.27
10.66
–0.03
5154
58
1
587743960499159116
23533218+0807052
85
5
23:53:45.98
07:51:37.72
10.77
–0.04
5661
29
1
587743959962288248
23534595+0751377
Notes. Group ID, Galaxy ID, RA: Right Ascension, Dec: Declination,
: Galactic Extinction-corrected -band apparent magnitude,
k-corr: -correction in the -band
computed from Chilingarian et al. (2010) as a function of redshift and colour –,
: radial velocity,
err: error in radial velocity,
_source: catalogue from which the and err were extracted,
SDSS_ID: Object ID in the SDSS-DR7 database,
2MASS_ID: ID in the 2MASS database
References for redshift source:
1= main 2MRS (Huchra et al., 2012)
2= extra 2MRS (Huchra et al., 2012)
3= 2M++ redshift catalogue (Lavaux & Hudson, 2011)
0= NED