X-ray emission from star-forming galaxies - III. Calibration of the relation up to redshift
Abstract
We investigate the relation between total X-ray emission from star-forming galaxies and their star formation activity. Using nearby late-type galaxies and ULIRGs from Paper I and star-forming galaxies from Chandra Deep Fields, we construct a sample of 66 galaxies spanning the redshift range and the star-formation rate (SFR) range . In agreement with previous results, we find that the relation is consistent with a linear law both at and for the CDF galaxies, within the statistical accuracy of in the slope of the relation. For the total sample, we find a linear scaling relation , with a scatter of dex. About of the 0.5–8 keV luminosity generated per unit SFR is expected to be due to HMXBs. We find no statistically significant trends in the mean ratio with the redshift or star formation rate and constrain the amplitude of its variations by dex. These properties make X-ray observations a powerful tool to measure the star formation rate in normal star-forming galaxies that dominate the source counts at faint fluxes.
keywords:
X-rays: galaxies – galaxies: star formation – galaxies: starburst – X-rays: ISM – X-rays: binaries.1 Introduction
High-mass X-ray binaries (HMXBs) and the hot ionized inter-stellar medium (ISM) are the main contributors to the total X-ray output of normal (i.e. not containing a luminous active galactic nucleus (AGN)) star-forming galaxies. It is well established that the collective X-ray luminosity of HMXBs well correlates with the star formation activity of the host galaxy (Grimm, Gilfanov, & Sunyaev, 2003; Ranalli, Comastri, & Setti, 2003; Lehmer et al., 2010; Mineo, Gilfanov, & Sunyaev, 2011, 2012, hereafter Paper I). The hot ionized ISM contributes about to the observed X-ray emission from late-type galaxies in the standard X-ray band (0.5–8 keV), its luminosity has been also shown to scale linearly with star formation rate (SFR) (Grimes et al., 2005; Li & Wang, 2012; Mineo, Gilfanov, & Sunyaev, 2012, hereafter Paper II). Thus, it has been proposed that the total, integrated X-ray luminosity from star-forming galaxies can be used as a proxy of the SFR (Grimm, Gilfanov, & Sunyaev, 2003; Ranalli, Comastri, & Setti, 2003). Although not entirely free from its own systematic uncertainties and contaminations, the X-ray based SFR proxy is less affected by the interstellar extinction and cosmological passband redshift, than conventional SFR indicators. Furthermore, the scaling relation does not experience significant cosmological evolution up to redshifts of . This has been initially suggested based on direct measurements of the ratios for several galaxies in Chandra Deep Fields (Grimm, Gilfanov, & Sunyaev, 2003; Lehmer et al., 2008, 2010; Mineo, Gilfanov, & Sunyaev, 2012) and was further supported by calculations of the maximal contribution of X-ray faint star-forming galaxies to the unresolved part of the Cosmic X-ray background (Dijkstra et al., 2012) and stacking analysis results (Cowie, Barger, & Hasinger, 2012). These properties make the X-ray based SFR proxy a powerful tool to measure the star formation rate in distant galaxies.
The most significant systematic effect which can compromise the X-ray-based SFR measurements is the contamination by the emission of the central supermassive black hole, the AGN. Indeed, even low luminosity AGN, with can outshine a /yr starburst. As populations of bright galaxies are mainly composed of AGN (for recent results, see e.g. Xue et al., 2011; Lehmer et al., 2012), SFR measurements using X-ray luminosity can be applied only to a relatively small fraction of bright galaxies. In this case, a careful investigation of the nature of each galaxy is required in order to separate late-type from early-type galaxy populations. On the contrary, among faint sources, erg cm-2 s-1, the majority are star-forming galaxies located at moderate and large redshifts, (Cowie, Barger, & Hasinger, 2012; Lehmer et al., 2012). This makes the X-ray based SFR proxy a powerful tool to measure the star formation rate in faint galaxies, where it can be used en masse, to infer the cosmic star formation history (e.g. Cowie, Barger, & Hasinger, 2012).
The aim of this paper is to obtain the scaling relation for the total X-ray luminosity and to investigate its behavior in a broad range of redshifts. For the redshift , we use the sample of star-forming galaxies and ULIRGs (ultra-luminous infrared galaxies) from Papers I and II. We then select normal star-forming galaxies from the Chandra Deep Fields (CDFs) expanding the local sample towards cosmologically interesting redshifts and high star formation rates. We combine these data in order to calibrate the scaling relation over a broad range of redshifts and star formation rates.
The structure of the paper is as follows. In Section 2 we briefly summarize the selection criteria and properties of the local sample. In Section 3 we describe selection of late-type galaxies from the CDF data and the procedures used to calculate their X-ray luminosities and star formation rates. The relation is derived in Section 4 and its redshift and SFR dependences are investigated in Section 5. In Section 6 we summarize our findings.
Throughout this paper we assume a flat CDM cosmology with km/s/Mpc, and .
2 Local galaxies
| Galaxy | D | Ref.111References for distances: (1) Sanders et al. (2003), (2) Tully (1988), (3) Grisé et al. (2008), (4) Makarova & Karachentsev (2003), (5) Willick et al. (1997), (6) Saha et al. (2006), (7) Ismail et al. (2005), (8) Saviane, Hibbard, & Rich (2004), (9) Drozdovsky et al. (2002), (10) Drozdovsky & Karachentsev (2000), (11) Tully et al. (2009). | Hubble type | SFR222Star formation rate from Spitzer and GALEX data (see Sect. 6 Paper I). | 333Stellar mass from 2MASS data (see Sect. 5 Paper I). | 444Total X-ray luminosity of galaxies, i.e. gas and X-ray binary contribution, in 0.5–8 keV band, measured as described in Sect. 2.2. |
|---|---|---|---|---|---|---|
| (Mpc) | () | () | ||||
| resolved galaxies | ||||||
| NGC 0278 | (2) | SAB(rs)b | 4.1 | 0.7 | 39.52 | |
| NGC 0520 | (2) | Pec | 11.6 | 4.7 | 40.53 | |
| NGC 1313 | (3) | SB(s)d | 0.44 | 0.1 | 39.75 | |
| NGC 1569 | (4) | IB | 38.17 | |||
| NGC 2139 | (5) | SAB(rs)cd | 3.8 | 0.91 | 40.48 | |
| NGC 3079 | 18.2 | (1) | SB(s)c | 6.0 | 4.0 | 40.30 |
| NGC 3310 | 19.8 | (1) | SAB(r)bc pec | 7.1 | 0.98 | 41.02 |
| NGC 3556 | (11) | SB(s)cd | 3.1 | 1.7 | 39.87 | |
| NGC 3631 | (7) | SA(s)c | 4.6 | 2.6 | 40.79 | |
| NGC 4038/39 | (8) | - | 5.4 | 3.1 | 40.57 | |
| NGC 4194 | (2) | IBm pec | 16.8 | 2.1 | 40.92 | |
| NGC 4214 | (9) | IAB(s)m | 0.17 | 38.53 | ||
| NGC 4490 | (2) | SB(s)d pec | 1.8 | 0.39 | 40.32 | |
| NGC 4625 | (2) | SAB(rs)m pec | 0.09 | 37.92 | ||
| NGC 5253 | (6) | Im pec | 0.38 | 38.31 | ||
| NGC 5474 | 6.8 | (10) | SA(s)cd pec | 0.18 | 39.05 | |
| NGC 5775 | (2) | Sb(f) | 5.3 | 6.3 | 40.88 | |
| NGC 7090 | 7.6 | (1) | SBc | 0.29 | 0.22 | 39.08 |
| NGC 7541 | (5) | SB(rs)bc pec | 14.7 | 4.9 | 40.39 | |
| NGC 7793 | (11) | SA(s)d | 0.29 | 0.15 | 38.53 | |
| UGC 05720 | (2) | Im pec | 1.8 | 0.37 | 39.77 | |
| unresolved galaxies | ||||||
| IRAS 17208-0014 | 183.0 | (1) | ULIRG | 289.9 | 10.3 | 41.40 |
| IRAS 20551-4250 | 179.1 | (1) | ULIRG | 139.4 | 7.5 | 41.63 |
| IRAS 23128-5919 | 184.2 | (1) | ULIRG | 139.6 | 7.0 | 41.88 |
| IRAS 10565+2448 | 182.6 | (1) | ULIRG | 156.8 | 9.9 | 41.42 |
| IRAS 13362+4831 | 120.9 | (1) | LIRG | 54.8 | 17.3 | 41.81 |
| IRAS 09320+6134 | 164.3 | (1) | ULIRG | 137.1 | 13.1 | 41.39 |
| IRAS 00344-3349 | 84.0 | (1) | LIRG | 20.1 | 1.5 | 41.23 |
| NGC 4676 | 98.2 | (1) | - | 15.8 | 6.6 | 40.92 |
2.1 The sample
We constructed the local sample of star-forming galaxies by merging a sample of nearby galaxies resolved by Chandra from Paper II (Sect. 2, Table 1), and a sample of unresolved LIRGs (luminous infrared galaxies) and ULIRGs defined in Paper I (Sect. 2.2, Table 2). The local sample contains 29 star-forming galaxies, their parameters are summarized in Table 1.
The SFRs and stellar masses () were determined in Paper I, based on far-infrared, UV and K-band luminosities. These quantities were measured for the same spatial regions as used for computing the X-ray luminosities, defined in Section 5 of Paper I. The star formation rates and stellar masses of the local sample span broad ranges, from and , respectively.
2.2 Total X-ray luminosity
The data preparation was done following standard CIAO555http://cxc.harvard.edu/ciao3.4/index.html threads (CIAO version 3.4; CALDB version 3.4.1), exactly the same way as described in Sect. 3 of Paper I.
For resolved galaxies, listed in the first part of Table 1, source spectra were extracted in the 0.5–8 keV energy band and background spectra were created as described in Sect. 3.3 of Paper II. Spatial regions for extracting source spectra were defined in Paper I. Both source and background spectra and the associated ARF and RMF files were produced by using specextract script and modeled using XSPEC v. 12.3.1x. The spectra were grouped in order to have a minimum of 15 counts per channel to apply the fitting. For most of the spectra a good fit was obtained with a two component model: a thermal plasma (mekal) plus a power-law, corrected for the Galactic absorption. A second photoelectric absorption component, accounting for the intrinsic absorption and/or a second thermal component, was required for some of the galaxies. The addition of such a component was decided on a galaxy-by-galaxy basis via the result of the F-test, using a probability of as the threshold (see Paper II for details). For each galaxy, we used the best fit model to calculate the count-to-erg conversion coefficient. Using this coefficient, the energy flux was computed form the background subtracted source count rate.
For the sample of unresolved starburst galaxies presented in the second part of Table 1, we adopted 0.5–8 keV luminosities from Paper I.
3 Star-forming galaxies from Chandra Deep Fields
| CXO | Redshift | Field666References for redshift and fields: E-CDF-S and CDF-N galaxies are from Lehmer et al. (2008), 4Ms CDF-S galaxies are from Xue et al. (2011). | Morph.777Morphological Type from Bundy, Ellis, & Conselice (2005), according to the following classification: 3=Sab, 4=S, 6=Irr, 8=Merger. Sources without numerical morphological type in column 4 were classified by eye based on HST images as described in Sect.3.1 for details. | SFR | ||||
| Type | () | (erg s-1) | ( Jy) | (erg s-1) | ( yr-1) | |||
| J033209.80-274442.9 | 0.08 | 4Ms CDF-S | 3 | 9.24 | 39.57 | 45.2 | 27.88 | 0.4 |
| J033211.54-274713.3 | 0.58 | 4Ms CDF-S | 6 | 10.45 | 41.08 | 239.3 | 30.47 | 163.9 |
| J033217.90-275100.1 | 0.12 | 4Ms CDF-S | 4 | 9.90 | 39.52 | 108.9 | 28.58 | 2.1 |
| J033220.28-275222.3 | 0.34 | 4Ms CDF-S | 6 | 10.21 | 40.69 | 64.5 | 29.38 | 13.4 |
| J033223.67-274938.5 | 0.58 | 4Ms CDF-S | 6 | 10.19 | 40.91 | 41.5 | 29.71 | 28.7 |
| J033227.73-275041.2 | 1.10 | 4Ms CDF-S | 6 | 10.96 | 41.67 | 66.0 | 30.57 | 207.7 |
| J033228.00-274639.7 | 0.25 | 4Ms CDF-S | 3 | 10.22 | 40.01 | 86.3 | 29.19 | 8.6 |
| J033229.86-274425.1 | 0.08 | 4Ms CDF-S | 4 | 9.96 | 39.94 | 1068.0 | 29.17 | 8.3 |
| J033230.00-274405.0 | 0.07 | 4Ms CDF-S | 3 | 9.79 | 40.09 | 452.2 | 28.79 | 3.4 |
| J033232.99-275030.0 | 0.67 | 4Ms CDF-S | 4 | 10.66 | 41.15 | 38.2 | 29.83 | 37.4 |
| J033236.19-274932.0 | 0.55 | 4Ms CDF-S | 8 | 10.66 | 41.31 | 64.6 | 29.85 | 39.2 |
| J033237.27-275127.5 | 0.69 | 4Ms CDF-S | 6 | 10.11 | 41.23 | 38.9 | 29.87 | 40.9 |
| J033238.83-274956.5 | 0.25 | 4Ms CDF-S | 3 | 10.03 | 40.04 | 63.9 | 29.05 | 6.2 |
| J033256.66-275316.5 | 0.37 | E-CDF-S | 8 | 9.56 | 41.39 | 36.3 | 29.20 | 8.9 |
| J123559.74+621550.3 | 0.38 | CDF-N | 4 | 10.56 | 41.28 | 225.8 | 30.02 | 58.8 |
| J123619.47+621252.9 | 0.47 | CDF-N | 3 | 10.43 | 41.31 | 65.3 | 29.70 | 27.8 |
| J123621.09+621208.5 | 0.78 | CDF-N | 6 | 10.43 | 41.45 | 27.6 | 29.84 | 38.7 |
| J123623.03+621346.7 | 0.48 | CDF-N | 8 | 10.07 | 41.39 | 41.8 | 29.53 | 18.7 |
| J123634.47+621213.4 | 0.46 | CDF-N | 8 | 10.88 | 41.53 | 224.7 | 30.21 | 91.0 |
| J123634.53+621241.3 | 1.22 | CDF-N | 6 | 10.6 | 42.39 | 201.1 | 31.17 | 813.9 |
| J123636.86+621135.2 | 0.08 | CDF-N | 4 | 9.44 | 39.27 | 65.0 | 28.00 | 0.6 |
| J123639.93+621250.4 | 0.85 | CDF-N | 4 | 10.6 | 41.87 | 63.3 | 30.29 | 108.8 |
| J123643.97+621250.4 | 0.56 | CDF-N | 4 | 10.18 | 41.07 | 36.8 | 29.63 | 23.6 |
| J123645.40+621901.3 | 0.45 | CDF-N | 3 | 10.1 | 41.4 | 41.3 | 29.46 | 15.9 |
| J123646.60+621049.4 | 0.94 | CDF-N | - | 10.19 | 41.62 | 25.9 | 30.01 | 56.5 |
| J123646.67+620833.6 | 0.97 | CDF-N | 3 | 10.89 | 41.93 | 81.7 | 30.54 | 192.0 |
| J123648.30+621426.9 | 0.14 | CDF-N | 3 | 9.55 | 40.05 | 64.7 | 28.52 | 1.8 |
| J123649.72+621313.4 | 0.47 | CDF-N | 6 | 9.87 | 41.14 | 59.3 | 29.66 | 25.6 |
| J123651.12+621031.2 | 0.41 | CDF-N | 4 | 10.23 | 41.1 | 86.8 | 29.69 | 26.9 |
| J123652.77+621354.7 | 1.36 | CDF-N | - | 10.48 | 42.15 | 28.8 | 30.43 | 150.6 |
| J123652.83+621808.1 | 0.25 | CDF-N | 3 | 10.3 | 40.53 | 167.4 | 29.48 | 16.9 |
| J123653.37+621140.0 | 1.27 | CDF-N | 8 | 10.44 | 42.3 | 84.2 | 30.83 | 374.7 |
| J123658.34+620958.4 | 0.14 | CDF-N | 3 | 10.2 | 39.98 | 56.4 | 28.46 | 1.6 |
| J123659.92+621450.3 | 0.76 | CDF-N | 8 | 10.38 | 41.45 | 42.1 | 30.00 | 55.5 |
| J123700.41+621617.3 | 0.91 | CDF-N | - | 10.23 | 41.76 | 49.0 | 30.25 | 99.0 |
| J123708.32+621056.4 | 0.42 | CDF-N | 6 | 10.07 | 41.26 | 66.8 | 29.60 | 21.9 |
| J123716.82+621007.8 | 0.41 | CDF-N | 3 | 10.21 | 40.89 | 92.7 | 29.71 | 28.8 |
In order to extend the relation towards higher redshifts and SFRs, we selected a sample of late-type galaxies in the Chandra Deep Fields. We started from the samples studied by Lehmer et al. (2008), who selected late-type galaxies in the 2 Ms Chandra Deep Field-North (CDF-N; Alexander et al., 2003) and Extended Chandra Deep Field-South (E-CDF-S; Lehmer et al., 2005), and by Xue et al. (2011), the 4 Ms Chandra Deep Field-South (CDF-S) survey. For the E-CDF-S, the Lehmer et al. (2008) late-type galaxy sample was constructed using data within a 1 Ms Chandra exposure of the CDF-S proper (Alexander et al., 2003) and four flanking E-CDF-S fields with 250 ksec Chandra exposures each (Lehmer et al., 2005). The Xue et al. (2011) 4 Ms exposure covered only the CDF-S but to 4–16 times larger depth.
As we describe in the sections below, to study the –SFR correlation and its redshift dependence, we filtered these samples according to the following criteria: (i) rigorous determination of the morphological type appropriate for a star-forming galaxy; (ii) availability of a robust 0.5–8 keV X-ray detection; (iii) availability of 1.4 GHz radio flux measurement for the SFR calculation or SFR determinations by Lehmer et al. (2008); (iv) the value of specific SFR () larger than .
3.1 Selection by morphological type
We began by applying two main filtering criteria to the Lehmer et al. (2008) and Xue et al. (2011) CDF catalogs: • we excluded i) all the AGN candidates and ii) objects detected only in one of the sub-bands (i.e., 0.5–2 keV and 2–8 keV), for which full band luminosity was not available. Then we proceeded with more accurate filtering, excluding the early type galaxies using the morphological classifications of galaxies in the GOODS fields (Bundy, Ellis, & Conselice, 2005) and original HST data for those galaxies which were not included in the GOODS catalogs.
The 4 Ms CDF-S survey (Xue et al., 2011) includes 740 X-ray sources, of which 578 are classified as AGN and 162 as normal galaxies. The additional filtering mentioned above reduced the sample to 102 normal CDF-S galaxies. We cross-correlated these sources with the morphological catalog of galaxies in the GOODS South field (Bundy, Ellis, & Conselice, 2005). Using a matching radius of , we found 79 matches. Among them, we selected only sources classified as late-type or merging galaxies. The 22 sources with no match in the Bundy, Ellis, & Conselice (2005) catalog have -band magnitude fainter than the threshold limit applied to construct the above mentioned catalog. We constructed HST , , and color image cut-outs and classified each galaxy as either early-type or late-type by visual classification. Seven sources were classified as early type galaxies and consequently were excluded from further analysis. We also excluded one source because its morphology did not allow us to clearly classify it neither as a late-type nor as an early-type galaxy. The remaining 14 sources were added to the selection of CDF-S sources obtained so far. After our morphological selection, we were left with a sample of 67 star-forming galaxies from the 4 Ms CDF-S region.
The sample from Lehmer et al. (2008) includes 225 X-ray detected late-type galaxies (selected via optical colors). Among them, 121 were classified as AGN candidates, while the remaining 104 sources were classified as normal late-type galaxies. Applying the same morphological filtering criteria as above yielded 52 sources: 37 in the CDF-N and 15 in the E-CDF-S. As Lehmer et al. (2012) point out, a single color division does not perfectly disentangle the early-type and late-type galaxy populations. In order to exclude a possible early-type galaxy contamination of the Lehmer et al. (2008) sample, we cross-matched the 52 sources with the morphological catalogs of galaxies in the GOODS North and South fields (Bundy, Ellis, & Conselice, 2005). Using a matching radius of we found a total of 44 matches, 11 for the E-CDF-S and 33 for the CDF-N sample. Two galaxies in the latter sample (J123603.26+621111.3 and J123627.32+621258.1) were classified as early-type and were excluded. We inspected the HST color image cut-outs of the four sources with no match in the GOODS-North morphological catalog. We classified three of these sources as late-type galaxies based on visual inspection. Concerning the E-CDF-S late-type galaxies from Lehmer et al. (2008), 10 of these sources were already part of the Xue et al. (2011) sample. Hereafter, we adopt the properties from the deeper 4 Ms CDF-S from Xue et al. (2011) for these galaxies. The obtained sample from Lehmer et al. (2008) consists of 35 unique star-forming galaxies.
As a check, we cross-correlated the obtained sample of CDF-N sources with the “High-SFR sample” in Paper I (Table 3). This sample was compiled by Grimm, Gilfanov, & Sunyaev (2003) and was used in Paper I as a secondary sample of unresolved star-forming galaxies in order to explore the relation in the high SFR regime. It includes seven galaxies from Chandra observations of the Hubble Deep Field North (HDF-N; Brandt et al., 2001) and one from the Lynx field (Stern et al., 2002). For the seven HDF-N sources, we found six counterparts. The remaining galaxy, 123716.3+621512, was not present in the GOODS catalog. We constructed the HST image cut-out as described above and visually classified the source as an early-type galaxy. Correspondingly, we did not consider it further in our analyses.
After this selection we were left with a sample of 104 X-ray selected star-forming galaxies drawn from the CDFs. The sample will be reduced further after the cross-correlation with radio catalogs (see Sect. 3.3).
3.2 X-ray luminosity
Both Lehmer et al. (2008) and Xue et al. (2011) provide rest-frame X-ray luminosities in the 0.5–8 keV band. In both cases the K-correction was performed assuming a power spectrum. Lehmer et al. (2008) used a photon index , appropriate for star-forming galaxies (e.g. Lehmer et al., 2005, and references therein), whereas Xue et al. (2011) used a photon index of , more appropriate for AGNs (e.g. Tozzi et al., 2006). For sources from the Lehmer et al. (2008) sample we used their original luminosity values. However, recomputed luminosities for galaxies from Xue et al. (2011), using their fluxes and redshifts and adopting a photon index .
3.3 Cross-correlation with radio catalogs and star formation rate estimates
The far-infrared (FIR) and ultraviolet (UV) luminosities are good proxies of the star formation activity in late-type galaxies. However, the use of these two estimators for CDF galaxies is limited by both the lack of rest-frame UV spectroscopic data and the sensitivity limit of the available IR observations. For these reasons, Lehmer et al. (2008) were able only to compute upper limits on SFRs for most of the sources in their galaxy sample. To measure star formation rates in the CDF galaxies, we used 1.4 GHz radio emission (e.g. Condon, 1992). It has been shown (Bell, 2003; Schmitt et al., 2006) that this estimator is in good agreement with both IR- and UV-based estimators used for the local resolved galaxy sample (Sect. 2). We cross-correlated the X-ray sample of star-forming galaxies produced in section 3.1 with catalogs of radio sources based on VLA observations of CDFs. For the CDF-N we used the Morrison et al. (2010) catalog, and Miller et al. (2013) catalog for the CDF-S. Using a matching radius of we found a total of 39 matches with VLA sources: 23 from CDF-N and 16 from the CDF-S, of which one uniquely belongs to the selection from Lehmer et al. (2008) and 15 to the 4 Ms CDF-S sample of Xue et al. (2011). The radio flux densities were converted to luminosities using the following equation:
| (1) |
For CDF-N galaxies detected in the Morrison et al. (2010) catalog, we used the total (i.e. integrated) radio flux densities . For CDF-N galaxies in the Miller et al. (2013) catalog, we used either peak or integrated flux densities according to their prescription. We assumed a spectral index of , according to Condon (1992). The radio-based SFRs were estimated using the calibration of Bell (2003):
| (2) |
3.4 X-ray sources with “missing” radio counterparts
As discussed in Section 3.3, only a fraction X-ray selected normal late-type galaxies have radio counterparts: 23 out of 35 CDF-N sources () and 16 out of 68 CDF-S sources ().
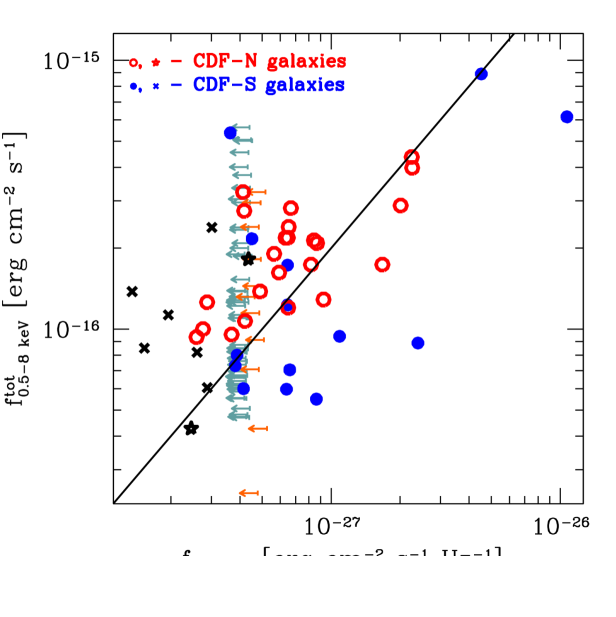
In Fig. 2 we plot the 1.4 GHz flux versus 0.5–8 keV flux for the entire sample of CDF sources classified as normal late-type galaxies. For sources undetected in radio we plot upper limits. The latter were derived from the publicly-available radio RMS maps of both the GOODS-N VLA Deep 20cm Radio Survey888http://www.ifa.hawaii.edu/morrison/GOODSN/ (Morrison et al., 2010) and the VLA 1.4GHz Survey of the Extended Chandra Deep Field South: Second Data Release999http://www.astro.umd.edu/nmiller/VLA_ECDFS.html (Miller et al. 2013). The plotted upper limits in Fig. 2 are at the level. For reference, the solid line shows our best fitting relation derived in Section 4, eq. (4), converted to flux units. To calculate the solid line, the average value of redshift among CDF galaxies is assumed. It can be seen in Fig. 2 that the radio-undetected sources span both X-ray bright as well as X-ray faint sources with little variation in the radio limits. If the galaxies with the highest X-ray fluxes, at the few level, followed the average SFR relation, we would have expected them to be detected in the radio band. On the other hand, some the X-ray faint sources may be normal star-forming galaxies that have remained undetected because of the insufficient sensitivity of the radio data.
In order to investigate the nature of the X-ray sources undetected in the radio band, we stacked the 0.5–2 keV and 2–8 keV data of these sources to obtain their average X-ray emission in each bandpass and infer their mean spectral slopes. The details of the data reduction and stacking procedure used are described in detail in Section 4.2 of Lehmer et al. (2008). The stacked X-ray spectrum was fitted with a power law model, giving the photon index of . We further divided galaxies into two groups, separated by the median X-ray flux, and obtained the mean photon indices of and for the bright and faint groups respectively. For comparison, we stacked the sample of sources detected in both X-ray and radio and obtain a mean photon index .
The radio catalogs include only detections. In order to probe deeper, we searched for sources on the radio maps down to and selected those within from the positions of X-ray sources. We found ten sources, three in the CDF-N field and seven in the CDF-S field, one of which had not high enough specific SFR to pass our selection criterion (see Section 3.5). We measured their radio intensities as follows. For the CDF-N we performed a Gaussian fit on both the and radio maps. Primary beam correction was applied along with a correction for radial bandwidth smearing. The results for each resolution image were then compared and the best fit was selected. If the peak SNR was more than 10% higher on the lower-resolution image then that result was used (Owen & Morrison, 2008). Finally, if the total flux density of the source was significantly larger at lower resolution then that result was adopted. In cases where the results appeared inconsistent, the images were examined to resolve the issue. One of the three CDF-N sources, appears to be a possible FRI source (see e.g., Morrison et al., 2003). It is extended in radio and therefore it was not included in the original radio catalog that we cross-matched (see Section 3.3). As this sources appears to be a radio-loud AGN with twin radio jets, we excluded it from the following analysis. For the ECDF-S field only mosaicked radio images are publicly available, therefore the radial bandwidth smearing correction could not be applied. We performed a Gaussian fit using the available maps and adopted the resulting peak flux for the radio counterparts to the X-ray sources. The X-ray stacking analysis of the sources with radio counterparts in the 3-5 range yielded an average , which is consistent with that obtained above for radio-undetected sources. We also investigated possible variations of the effective stacked photon index with the ratio and found no significant trend.
Thus, galaxies detected in both X-ray and radio bands have X-ray spectra typical for star-forming galaxies (e.g. Ptak et al., 1999), confirming that their X-ray emission is indeed associated with star-formation. On the other hand, Chandra sources without radio counterparts have harder spectra, , suggesting that there is likely to be some level of low-luminosity and/or obscured AGN contamination within this population. Hereafter, we therefore exclude from the analysis of the –SFR relation X-ray sources undetected in the radio band. Sources with counterparts were also excluded.
3.5 Stellar mass and specific star formation rate
As a final check, we verified that selected CDF galaxies satisfy the selection criterion applied for the sample of resolved galaxies in Paper I – that their specific SFR exceeds yr-1.
This was rather straightforward for late-type galaxies selected from Lehmer et al. (2008), for which stellar mass measurements were available. For CDF-S galaxies from Xue et al. (2011), we used the multi-wavelength optical data provided in the same catalog. To be consistent with the estimations in Lehmer et al. (2008), we calculated the stellar masses using the calibration of Bell et al. (2003). In this procedure, we made use of colors and the -band luminosity. One CDF-S source was excluded because it did not have a band magnitude estimation. The stellar mass was therefore obtained as follows:
| (3) |
In particular, we derived based on K-band AB magnitudes from the MUSYC catalog (Taylor et al., 2009), and computed colors based on AB magnitudes in R-band from the ESO 2.2 m WFI R-band catalog (Giavalisco et al., 2004), and -band magnitudes from the GOODS-S Hubble Space Telescope (HST) catalog (Giavalisco et al., 2004).
All CDF sources satisfied the yr-1 criterion.
3.6 X-ray variability and AGN candidates in the CDF-S
As an additional criterion to filter out AGN-contaminated galaxies, we used the results from Young et al. (2012) for the 4 Ms CDF-S, to separate star-forming galaxies from AGN candidates, based on their X-ray variability. We applied same criteria as in Lehmer et al. (2012), namely: (i) X-ray variability on timescales of months to years detected with the confidence of ; (ii) the 0.5–8 keV luminosity greater than (see Young et al., 2012, for details). By cross-matching our CDF-S sources with this catalog, we found that two sources, and , are likely to be AGNs. These sources were excluded from the analysis.
3.7 The final CDF sample
The final CDF sample consists of 39 X-ray selected galaxies with radio SFR measurements from the CDFs: 23 objects from CDF-N and 14 from CDF-S. They are listed in Table 2, along with their parameters.
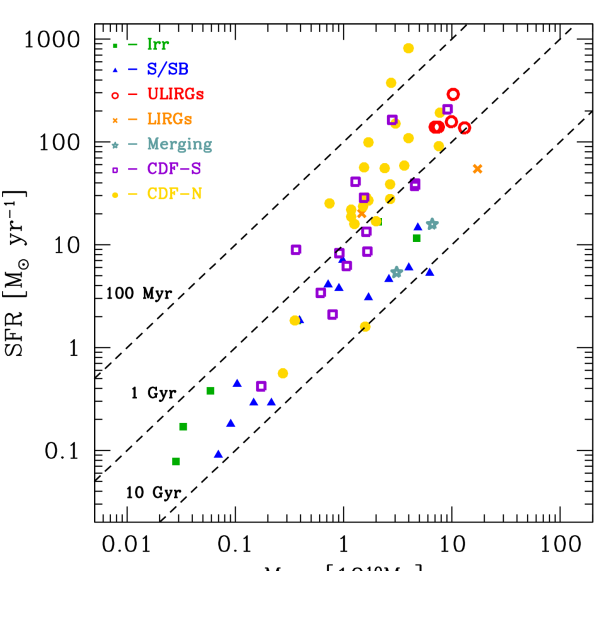
The entire sample, including 21 local (resolved) galaxies, 8 LIRGs and ULIRGs and 37 CDF galaxies (66 galaxies in total) is shown in the SFR– plane in Fig.1.
4 relation for total luminosity
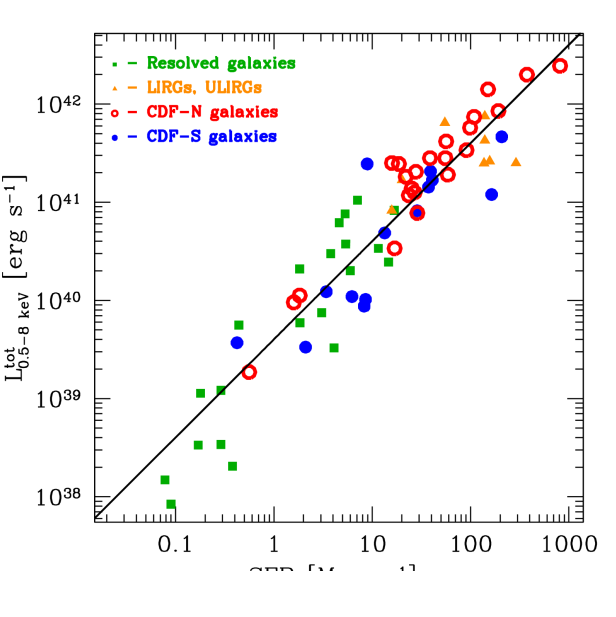
We approximate the data (in Fig.3) with the log-linear model . This model was applied to local sample and CDF sample separately. Both slope and normalization were set as free parameters of the fit. To fit the data we used least square minimization. The results are given in Table 3, which demonstrates that the best fit parameters for the local and CDF samples are compatible. We therefore performed the joint fit to the whole sample of star-forming galaxies that includes both local and CDF sources, using same model. We obtained a slope , suggesting a linear relation. The linear scaling relation obtained by fixing the slope to unity is shown in Fig. 3 and it is given by the following equation:
| (4) |
where the uncertainty was computed from the scatter of the points around the best fit. The results of all fits are summarized in Table 3.
In Paper I we obtained the relation for X-ray point sources in star-forming galaxies (). Comparing the scale factor for compact sources with that in eq.(4) above we conclude that the unresolved emission contributes, on average, of the total 0.5–8 keV luminosity of star-forming galaxies generated per unit of SFR. This result is consistent with the preliminary estimate obtained in Paper I based on the comparison of the relations of the HMXBs in the resolved galaxies and total emission from unresolved galaxies. It is also consistent with the scaling relation for the ISM emission obtained in Paper II.
In the conclusion of this section we note that the result of the fitting of the relation depends on whether the fit was performed in the logarithmic or linear space. In the linear case, it also depends on whether the least square fit in the form was performed or individual ratios were averaged (note that in the log case it is same). Note also that large scatter of points, much bigger than statistical uncertainties, renders the minimization less appropriate. Doing the least square fit to the linear quantities, we obtain the scale of (). Averaging the ratio in the linear space, we obtain yet another number: (), i.e. notably larger than in eq.(4). The value obtained in the logarithmic fit is smaller, because it gives equal weights to the low and high points.101010Indeed, for two measurements yielding and the logarithmic (geometrical) average is while the linear average is , i.e. is nearly twice larger. As this seems to be a more correct approach and in order to be consistent with Paper I, we used the fit in the log space as default.
| free slope | linear fit | ||||
| Sample | |||||
| (dex) | (dex) | ||||
| galaxies | |||||
| CDF galaxies | |||||
| CDF-S galaxies | |||||
| CDF-N galaxies | |||||
| all | |||||
Note. The parameters are relative to the least-squares fit to the data with the relation , respectively setting the slope free and fixing it to unity. is the dispersion around the best-fitting relation. See Sect. 2.2 and 3.2 for the definition of the X-ray luminosities, Sect. 6 of Paper I and 3.3 of present work for the definition of SFR for sample and CDF galaxies respectively.
4.1 CDF-S vs CDF-N
Visual inspection of Fig. 3 suggests that there may be an offset in ratio between the CDF-S and CDF-N fields. To asses its statistical significance, we fitted the data for the CDF-S and CDF-N separately; the results are presented in Table 3. For the linear model, we found that the ratios for CDF-N and CDF-S differ by 0.27 dex. The statistical significance of this difference measured with respect to the dispersion of the points is , i.e. the offset is marginally significant. We also note that the CDF-N galaxies appear to have smaller scatter, dex vs dex.
To explore the origin of the difference between the fields, we first investigate importance of the Eddington bias in our CDF samples. To this end, we compared the fluxes of CDF-N and CDF-S sources with the sensitivity limits, in the 0.5–8 keV band, of the respective fields, erg cm-2 s-1 for the CDF-N (Alexander et al., 2003) and erg cm-2 s-1 for the CDF-N (Xue et al., 2011). We selected only CDF galaxies with flux above three times the sensitivity limit of the given field. Such a selection shrank the sample by 50%. For the new sample we repeated the fitting procedure and obtained for CDF-S and for CDF-N. These numbers are in perfect agreement with each other as well as with the local sample (Table 3) and, taken at the face value, may suggest that the offset between CDF-S and CDF-N is caused by the Eddington bias. We note however, that whereas for the CDF-N the shifts downwards for the reduced sample, as it should be expected if X-ray fluxes were affected by the Eddington bias, CDF-S data shows the opposite behavior, with the best fit increasing for the reduced sample. Thus, change of the in CDF-S and good agreement between the two fields in the reduced sample was a result of statistical fluctuations. We conclude that although the Eddington bias may explain a part of the offset between CDF-S and CDF-N, it is unlikely that it is responsible for all of it.
We can exclude that systematic differences in Chandra calibration of the CDF-N and CDF-S would affect the observed offset. Indeed, the 1 Ms CDF-S and 2 Ms CDF-N were analyzed in exactly the same way by Alexander et al. (2003). The data for both surveys were taken throughout the first three years of the mission, therefore comparing the 1 Ms CDF-S with 4 Ms CDF-S systematics would provide us with an approximation of the difference in calibration between the CDF-N and CDF-S. In particular, sources with flux erg cm-2 s-1 have mean , i.e. a difference of , which is negligible for the aims of the present work. Furthermore, the amplitude of the difference dex, corresponds to the factor of difference in flux calibration, which is far beyond the calibration uncertainties expected for Chandra.
Another potential source of systematic difference in the between the two fields is offset in the radio data. This however requires a special investigation which is beyond the scope of this paper.
4.2 Comparison with previous results
Ranalli, Comastri, & Setti (2003) studied the relation using X-ray data from ASCA and BeppoSAX satellites. In Paper I, we converted their X-ray luminosity and SFR to make them consistent with the analogous quantities used here and derived: , i.e. more than times smaller than our eq.(4). The rather large discrepancy is likely caused by the confusion in the definition of SFR proxies (see detailed discussion in Paper I). On the other hand, the relation of Ranalli, Comastri, & Setti (2003), transformed to be compatible with our definitions is . The scale in this relation is larger that the scale in the corresponding relation for HMXBs from Paper I (eq.(23)), consistent with contribution of hot ISM and other unresolved emission components to the total luminosity – see the discussion after eq.(4) above. This proves that the underlying relations are fully compatible and the discrepancy in the relation is due the difference in the use and definitions of SFR proxies.
Persic & Rephaeli (2007) investigated the relation between the total X-ray emission from normal and starburst (ULIRGs) galaxies in the 2–10 keV band and the SFR derived from infrared luminosity. Using their eq. (10) and converting the 2–10 keV luminosity to the 0.5–8 keV band (a factor of 1.28) we obtain: . This relation is consistent, within a factor of with our eq. (4). On the other hand, in Paper I we found a rather large disagreement between our relations for the HMXB luminosity.
Lehmer et al. (2010) recently studied the relation between 2–8 keV luminosity and SFR for a sample of nearby LIRGs using Chandra observations. They obtained the hard band luminosities by modeling the X-ray spectra in 0.5–8 keV band using Galactic absorption, a thermal component and a power-law component. This is consistent with the model we used to fit the X-ray spectra of our sample of LIRGs and ULIRGs and determine their X-ray luminosities. In order to compare our results with the relation obtained by Lehmer et al. (2010), we converted their 2–8 keV luminosity to the 0.5–8 keV band. We assumed same model as above, with average quantities from our ULIRGs spectral fits (, keV, and thermal-to-power-law normalization ratio of ). For the linear (first line in their Table 4) relation in Lehmer et al. (2010) we obtain a scale factor (). This result is also in a reasonable agreement with our eq. (4).
5 Constraints on the redshift and SFR dependence of the relation
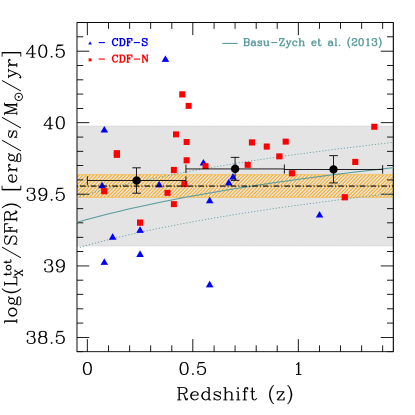
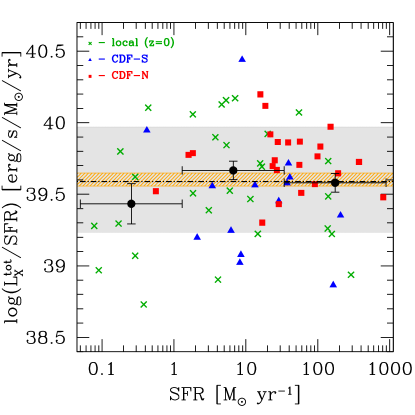
The composition of the sample (29 galaxies at the redshift and 25 galaxies at ) allows us to constrain a possible redshift evolution of the X-ray emission produced per unit SFR. To this end, we grouped the CDF galaxies into three redshift bins of equal width spanning from to and computed the average ratio and its uncertainty within each bin. Same quantities were computed for the local sample of galaxies, to characterize the population. The result of this calculation is shown in Fig. 4. It is evident from the figure, that the average values for CDF galaxies are consistent, within uncertainties, between each other and with the average quantity for local galaxies. To confirm this, we applied the Spearman’s rank test and we found no statistically significant correlations, neither for the individual values nor for the average points, with the corresponding probabilities of and respectively.
Thus, the total X-ray emission produced per unit SFR by late-type galaxies does not show statistically significant trends with the redshift up to . The sensitivity of this analysis is sufficient to rule-out evolution larger than dex (by factor of ) between and , although as a caveat we should note that the high redshift bin contained only 4 galaxies. This conclusion is in agreement with results of the X-ray stacking analysis of late-type galaxies (Lehmer et al., 2008) and with calculations of the maximal contribution of star-forming galaxies to the unresolved CXB intensity (Dijkstra et al., 2012).
Recent population synthesis calculations by Fragos et al. (2012) predict that the ratio of the 0.5–8 keV luminosity to the SFR increases by a factor of between redshift and . Such an evolution is within the uncertainties of our results.
Furthermore, recent deep X-ray stacking of the 4 Ms CDF-S data, Basu-Zych et al. (2013) suggested that there may be mild evolution of the rest-frame 2–10 keV luminosity per unit SFR with the redshift and SFR. In Figure 4, we show the expected redshift evolution of /SFR as a function of redshift, from Basu-Zych et al. (2013), for SFRs equal to the median SFR (solid grey curve) and interquartile SFR range (dotted grey curve) of our CDF galaxy sample. These curves have been corrected to our choice of X-ray bandpass and IMF. It is obvious from Figure 4 that although our data does not require redshift evolution of the scale in the mean /SFR relation, it is also consistent with the mild evolution found by Basu-Zych et al. (2013).
Finally, in the right hand panel of Fig.4 we constrain the possible dependence of the ratio on the SFR. Using both local and CDF galaxies, we bin the data into 3 SFR bins and compute the average and its uncertainty (-based) for each redshift bin. The formal for the binned data, with 2 degrees of freedom. The probability of having such (or bigger) value of the is , which is equivalent to detection. This may or may not indicate the existence of some SFR dependence in the ratio. If any, the amplitude of this dependence also does not exceed dex (a factor of ). Finally, we note that due to the observer’s bias (see Sect. 2.3 of Paper I), the effect of statistics of the small numbers (Gilfanov, Grimm, & Sunyaev, 2004) is not strong in our sample.
6 Summary
Based on the sample of nearby resolved galaxies more distant ULIRGs at intermediate distances and star-forming galaxies from the CDFs, we construct a sample of 54 star-forming galaxies spanning the range of redshifts from up to and the range of star formation rates M⊙/yr (Fig.1). Using this sample, we calibrate the relation for the 0.5–8 keV band luminosity (Fig.3). We find that dependences for the local and CDF samples are consistent with linear relations with the typical accuracy of in the slope. The linear relation obtained for the entire sample is given by eq.(4). We did not find any statistically significant trends in the scaling relation with the redshift and star formation rate with the upper limit on the possible variations in the ratio of dex (a factor of ) (Fig.4). This property makes the X-ray emission a powerful tool to measure star formation rate in a broad range of redshifts and star formation regimes, which can be applied en masse to faint distant galaxies.
Acknowledgments
SM gratefully acknowledges financial support through the NASA grant AR1-12008X and funding from the STFC grant 664 ST/K000861/1.The authors are grateful to Ken Kellermann for providing them with both radio RMS map and the source list of the second data release of the VLA Survey of the Extended Chandra Deep Field South, prior to publication. The authors thank William Forman for his valuable comments and suggestions to improve the quality of the paper. This research made use of Chandra archival data and software provided by the Chandra X-ray Center (CXC) in the application package CIAO. This research has made use of SAOImage DS9, developed by Smithsonian Astrophysical Observatory. The Spitzer Space Telescope is operated by the Jet Propulsion Laboratory, California Institute of Technology, under contract with the NASA. GALEX is a NASA Small Explorer, launched in 2003 April. This publication makes use of data products from Two Micron All Sky Survey, which is a joint project of the University of Massachusetts and the Infrared Processing and Analysis Center/California Institute of Technology, funded by the NASA and the National Science Foundation. This research has made use of the NASA/IPAC Extragalactic Database (NED) which is operated by the Jet Propulsion Laboratory, California Institute of Technology, under contract with the National Aeronautics and Space Administration.
References
- Alexander et al. (2003) Alexander, D. M., Bauer, F. E., Brandt, W. N., et al. 2003, AJ, 126, 539
- Barger et al. (2003) Barger A. J., et al., 2003, AJ, 126, 632
- Basu-Zych et al. (2013) Basu-Zych, A. R., Lehmer, B. D., Hornschemeier, A. E., et al. 2013, ApJ, 762, 45
- Bell (2003) Bell E. F., 2003, ApJ, 586, 794
- Bell et al. (2003) Bell E. F., McIntosh D. H., Katz N., Weinberg M. D., 2003, ApJS, 149, 289
- Brandt et al. (2001) Brandt W. N., et al., 2001, AJ, 122, 2810
- Bundy, Ellis, & Conselice (2005) Bundy K., Ellis R. S., Conselice C. J., 2005, ApJ, 625, 621
- Condon (1992) Condon J. J., 1992, ARA&A, 30, 575
- Cowie, Barger, & Hasinger (2012) Cowie L. L., Barger A. J., Hasinger G., 2012, ApJ, 748, 50
- Dijkstra et al. (2012) Dijkstra M., Gilfanov M., Loeb A., Sunyaev R., 2012, MNRAS, 421, 213
- Drozdovsky & Karachentsev (2000) Drozdovsky I. O., Karachentsev I. D., 2000, A&AS, 142, 425
- Drozdovsky et al. (2002) Drozdovsky I. O., Schulte-Ladbeck R. E., Hopp U., Greggio L., Crone M. M., 2002, AJ, 124, 811
- Fragos et al. (2012) Fragos T., et al., 2012, arXiv, arXiv:1206.2395, submitted to ApJ
- Giavalisco et al. (2004) Giavalisco M., et al., 2004, ApJ, 600, L93
- Gilfanov, Grimm, & Sunyaev (2004) Gilfanov M., Grimm H.-J., Sunyaev R., 2004, MNRAS, 351, 1365
- Gilli et al. (2003) Gilli R., et al., 2003, ApJ, 592, 721
- Grimes et al. (2005) Grimes J. P., Heckman T., Strickland D., Ptak A., 2005, ApJ, 628, 187
- Grimm, Gilfanov, & Sunyaev (2003) Grimm H.-J., Gilfanov M., Sunyaev R., 2003, MNRAS, 339, 793
- Grisé et al. (2008) Grisé F., Pakull M. W., Soria R., Motch C., Smith I. A., Ryder S. D., Böttcher M., 2008, A&A, 486, 151
- Ismail et al. (2005) Ismail H. A., Alawy A. E., Takey A. S., Issa I. A., Selim H. H., 2005, JKAS, 38, 7
- Kellermann et al. (2008) Kellermann K. I., Fomalont E. B., Mainieri V., Padovani P., Rosati P., Shaver P., Tozzi P., Miller N., 2008, ApJS, 179, 71
- Li & Wang (2012) Li J.-T., Wang Q. D., 2012, arXiv, arXiv:1210.2997
- Lehmer et al. (2005) Lehmer B. D., et al., 2005a, AJ, 129, 1
- Lehmer et al. (2005) Lehmer, B. D., Brandt, W. N., Alexander, D. M., et al. 2005b, ApJS, 161, 21
- Lehmer et al. (2008) Lehmer B. D., et al., 2008, ApJ, 681, 1163
- Lehmer et al. (2010) Lehmer B. D., Alexander D. M., Bauer F. E., Brandt W. N., Goulding A. D., Jenkins L. P., Ptak A., Roberts T. P., 2010, ApJ, 724, 559
- Lehmer et al. (2012) Lehmer B. D., et al., 2012, ApJ, 752, 46
- Luo et al. (2008) Luo B., et al., 2008, ApJS, 179, 19
- Makarova & Karachentsev (2003) Makarova L. N., Karachentsev I. D., 2003, Ap, 46, 144
- Mineo, Gilfanov, & Sunyaev (2011) Mineo S., Gilfanov M., Sunyaev R., 2011, AN, 332, 349
- Mineo, Gilfanov, & Sunyaev (2012) Mineo S., Gilfanov M., Sunyaev R., 2012a, MNRAS, 419, 2095 (Paper I)
- Mineo, Gilfanov, & Sunyaev (2012) Mineo S., Gilfanov M., Sunyaev R., 2012b, MNRAS, 426, 1870 (Paper II)
- Miller et al. (2013) Miller, N. A., Bonzini, M., Fomalont, E. B., et al. 2013, arXiv:1301.7004
- Morrison et al. (2003) Morrison G. E., Owen F. N., Ledlow M. J., Keel W. C., Hill J. M., Voges W., Herter T., 2003, ApJS, 146, 267
- Morrison et al. (2010) Morrison G. E., Owen F. N., Dickinson M., Ivison R. J., Ibar E., 2010, ApJS, 188, 178
- Owen & Morrison (2008) Owen F. N., Morrison G. E., 2008, AJ, 136, 1889
- Persic & Rephaeli (2007) Persic M., Rephaeli Y., 2007, A&A, 463, 481
- Ptak et al. (1999) Ptak, A., Serlemitsos, P., Yaqoob, T., & Mushotzky, R. 1999, ApJS, 120, 179
- Ranalli, Comastri, & Setti (2003) Ranalli P., Comastri A., Setti G., 2003, A&A, 399, 39
- Saha et al. (2006) Saha A., Thim F., Tammann G. A., Reindl B., Sandage A., 2006, ApJS, 165, 108
- Sanders et al. (2003) Sanders D. B., Mazzarella J. M., Kim D.-C., Surace J. A., Soifer B. T., 2003, AJ, 126, 1607
- Sakai & Madore (1999) Sakai S., Madore B. F., 1999, ApJ, 526, 599
- Saviane, Hibbard, & Rich (2004) Saviane I., Hibbard J. E., Rich R. M., 2004, AJ, 127, 660
- Schmitt et al. (2006) Schmitt H. R., Calzetti D., Armus L., Giavalisco M., Heckman T. M., Kennicutt R. C., Jr., Leitherer C., Meurer G. R., 2006, ApJ, 643, 173
- Stern et al. (2002) Stern D., et al., 2002, AJ, 123, 2223
- Taylor et al. (2009) Taylor E. N., et al., 2009, ApJS, 183, 295
- Tozzi et al. (2006) Tozzi P., et al., 2006, A&A, 451, 457
- Tully (1988) Tully R. B., 1988, Sci, 242, 310
- Tully et al. (2009) Tully R. B., Rizzi L., Shaya E. J., Courtois H. M., Makarov D. I., Jacobs B. A., 2009, AJ, 138, 323
- Willick et al. (1997) Willick J. A., Courteau S., Faber S. M., Burstein D., Dekel A., Strauss M. A., 1997, ApJS, 109, 333
- Xue et al. (2011) Xue Y. Q., et al., 2011, ApJS, 195, 10
- Young et al. (2012) Young M., et al., 2012, ApJ, 748, 124