http://www.pnas.org/content/109/26/10245 \issuedateJune 26 \issuenumber26
Submitted to Proceedings of the National Academy of Sciences of the United States of America
Anomalous Front Broadening During Spontaneous Imbibition in a Matrix with Elongated Pores
Abstract
During spontaneous imbibition a wetting liquid is drawn into a porous medium by capillary forces. In systems with comparable pore length and diameter, such as paper and sand, the front of the propagating liquid forms a continuous interface. Sections of this interface advance in a highly correlated manner due to an effective surface tension, which restricts front broadening. Here we investigate water imbibition in a nanoporous glass (Vycor) in which the pores are much longer than they are wide. In this case, no continuous liquid-vapor interface with coalesced menisci can form. Anomalously fast imbibition front roughening is experimentally observed by neutron imaging. We propose a theoretical pore network model, whose structural details are adapted to the microscopic pore structure of Vycor glass, and show that it displays the same large scale roughening characteristics as observed in the experiment. The model predicts that menisci movements are uncorrelated. This indicates that despite the connectivity of the network the smoothening effect of surface tension on the imbibition front roughening is negligible. These results suggest a new universality class of imbibition behavior which is expected to occur in any matrix with elongated, interconnected pores of random radii.
keywords:
liquid imbibition | porous media | interface roughening | neutron imaging | pore network model | computer simulationsNVG , nanoporous Vycor glass
Many everyday processes involve the flow of a liquid into a porous matrix, for instance when we dunk a biscuit into coffee, clean the floor with a cloth, or get drenched with rain. The same process is also important in nature, e.g. for water to reach the tips of the tallest trees or to flow through soil, and crucial for different industrial processes, ranging from oil recovery and chromatography to food processing, agriculture, heterogeneous catalysis, and impregnation (for reviews see [1, 2, 3, 4]).
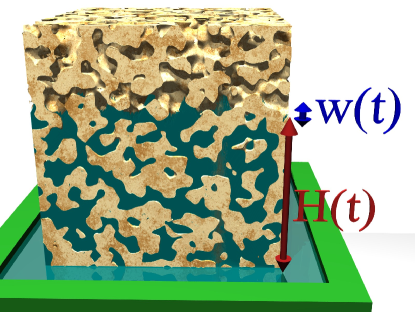
The above processes are examples of imbibition (Fig. 1). Imbibition of a liquid into a porous matrix is governed by the interplay of capillary pressure, viscous drag, volume conservation and gravity. The porous matrix often has a complex topology. The inhomogeneities result in variations in the local bulk hydraulic permeability and in the capillary pressure at the moving interface. Nevertheless, the invasion front during solely capillarity-driven (i.e. spontaneous) imbibition advances in a simple square-root-of-time manner, according to the Lucas-Washburn law [5, 6]. This is a result of the time-independent mean capillary pressure and the increasing viscous drag in the liquid column behind the advancing front. It is valid down to nanoscopic pore sizes [7, 8, 9] and particularly robust with regard to the geometrical complexity of the porous matrix [1, 4, 10, 11]. The evolution of the invasion front displays universal scaling features on large length and time scales, which are independent of the microscopic details of the fluid and matrix [12, 13, 14, 15, 16, 17, 18]. This parallels the elegance of critical phenomena.
Typically imbibition is studied using paper [14, 15, 16] or Hele-Shaw cells [17, 18]. In these systems, pore space is laterally highly interconnected. This results in a continuous liquid-gas interface, whose advancement is spatially correlated due to an effective surface tension [19]. Consequently menisci advancement beyond the average front position is slowed down whilst menisci lagging behind are drawn forward. Hence, the roughening of the interface is slowed down. By contrast, in many real porous systems, e.g. rock and soil [20], the pore network consists of elongated pores with reduced connectivity [1].
Here we investigate the spontaneous imbibition of water into nanoporous Vycor glass (NVG), which is a silica substrate with an interconnected network of nanometer-sized, elongated pores [21]. The narrow pores lead to capillary pressures of several hundred times atmospheric pressure. This means that gravity would only halt capillary rise after several kilometers and several billion years [22]. Hence, with this system, we are able to observe pure spontaneous imbibition over large length (centimeter) and long time (hours) scales. The observation of the advancing front is difficult since it is deeply buried inside the matrix [23, 24]. Nevertheless, neutron radiography [25, 26, 27] allows us to image the liquid inside porous materials [28, 29]. Recent technical improvements in neutron imaging provide the spatial and temporal resolution (tens of m and tens of s) to follow imbibition and to obtain quantitative information on the morphological evolution of the progressing interface.
Our experiments and simulations show that the interface roughness as measured by the interface width increases much faster than observed previously, namely with . This is close to the square-root-of-time progression of the invasion front H(t) . The propagation front hence comprises an almost constant fraction, , of the occupied part of the matrix, including voids and overhangs. We find that lateral correlations of the invasion front are short-ranged and independent of time. This means that, in the present case, surface tension is irrelevant in a coarse grained description of interface broadening on macroscopic length scales. Similar broadening has been observed, but for different experimental conditions, namely drainage and forced imbibition of less-wetting fluids [30, 31].
1 Results and Discussion
Quantitative Experimental Characterization of the Imbibition Front. We investigate imbibition in NVG which contains pores with a mean radius nm, a radius polydispersity of 20 %, a pore aspect ratio between 5 and 7 (where is the pore length), and a porosity of about 30 % [8, 21, 32, 33]. (For details see Methods.) The bottom face of an empty NVG is brought into contact with the surface of a water reservoir. Capillary forces draw the liquid into the porous matrix.
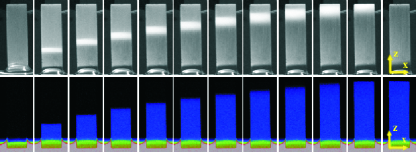
The invasion front appears as a bright region when imaged using reflected light (Fig. 2, top row). The pronounced (multiple) light scattering is caused by filled and empty regions randomly alternating on the length scale of the wavelength of visible light; several hundred nanometers [34]. These spatial scales are much larger than any intrinsic length of the porous matrix, such as the pore diameter or the pore-pore distance. Thus strong scattering of light at the advancing interface indicates structures of filled and empty parts (voids) of surprisingly large size. It prevents also a quantitative determination of the liquid profile in the propagating front and hence of the width of the interface. By contrast the spatial and temporal resolutions of neutron imaging [35] allow quantitative measurements in systems such as NVG (Fig. 2, bottom row).
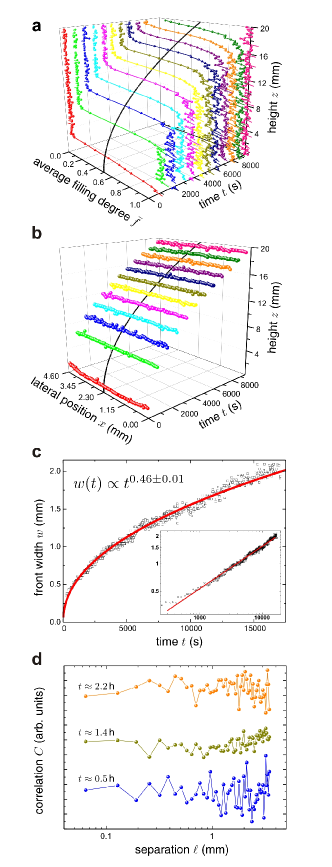
From the neutron images we determine the spatial and temporal evolution of the local filling degree . Due to the projection in the -direction, this is the average amount of filled pore space at lateral position , height and time . Its lateral average, that is the vertical concentration profile , is shown in Fig. 3a. The time-dependence of the front height, quantified by the mean median rise level , follows the Lucas-Washburn -law (Figs. 3a,b, solid lines), consistent with previous studies [8]. Fits of Gauss error functions to the profiles yield the time-dependence of the width (Fig. 3c). The fit of results in a growth exponent of the width or roughness, (Fig. 3c, solid line). The value significantly exceeds previous theoretical predictions, in particular those from phase-field models which are based on quenched, random fields. Such models predict slower roughening dynamics with and a strong spatial correlation of the height fluctuations within the moving interface [13].
Instead of the median rise level averaged in direction, , we now consider the local -dependent median rise level (Fig. 3b) to investigate fluctuations in -direction, i.e. within the front. We calculate the height-height correlation function:
| (1) |
The observed fluctuations in (Fig. 3d) are due mainly to the limited data density and stray gamma radiation from the reactor and instrument hitting the camera. The data exhibit neither scaling of with nor any indication of spatial correlations in the experimentally accessible range 75 µm 4000 µm. Although the correlations are reduced due to the projection in -direction, the absence of any detectable correlation is in contrast to all previously reported experiments and theories on imbibition front roughening.
Pore-network Model.
No theoretical model is available that is consistent with our system and which predicts the spontaneous imbibition behavior observed. An ensemble of independent pores of random but constant radius exhibits a roughening exponent 1/2 since the meniscus heights evolve independently from one another as with random pre-factors . However, this independent pore model is inappropriate for Vycor glass, since the pore radii vary strongly along individual pores (see Fig. 1). An ensemble of independent pores with radii which vary randomly along their length has a roughening exponent of 1/4 (see Appendix), which does not agree with the experimentally observed value. Thus independent pore models do not explain the observed exponent. A roughening exponent has recently been reported within the framework of a lattice gas model for spontaneous imbibition [41]. This model is appropriate for silica aerogels with an extremely large porosity of 87–95 % and gives rise to a continuous liquid-gas interface. Consequently one expects here an effective surface tension to be present, inducing height-height correlations in the advancing imbibition front. The model details are thus not appropriate for NVB. To our knowledge, all other existing theoretical models (for an overview see [4]) are also incompatible with our experimental observations which are i) fast broadening dynamics with a growth exponent close to , ii) absence of height-height correlations in the advancing imbibition front.
Hence we propose a pore-network model [36, 37] adapted to our experimental situation. This consists of individual, elongated capillaries arranged in a two-dimensional square lattice with laterally periodic boundary conditions. Capillaries are connected at nodes and inclined at . All capillaries have the same length , while the radius of each capillary is randomly chosen from a uniform distribution with mean radius and width , i.e. disorder strength . [21, 33]. (For details see Methods.) We investigated aspect ratios and polydispersities .
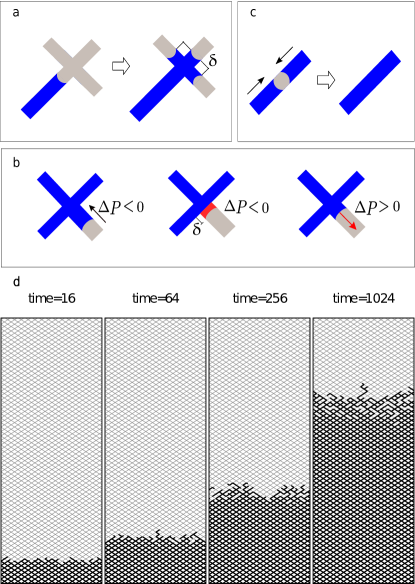
The pressure at all nodes at the bottom of the lattice are set to zero while at the menisci the Laplace pressure prevails. This pressure difference drives the flow through the capillaries. This flow is opposed by viscous drag according to Hagen-Poiseuille’s law. During the whole process, volume conservation must be maintained. When a meniscus reaches an empty node it ‘jumps’ over the node, generating new menisci in a distance from the node (Fig. 4a). This implementation of node crossing avoids a microscopic treatment of the filling process of the nodes and is valid as long as this is not the rate limiting step, which we will discuss below. If the Laplace pressure of a meniscus exceeds the node pressure the meniscus is arrested at the distance until the node pressure increases beyond the Laplace pressure (Fig. 4b). Then propagation of the meniscus resumes.
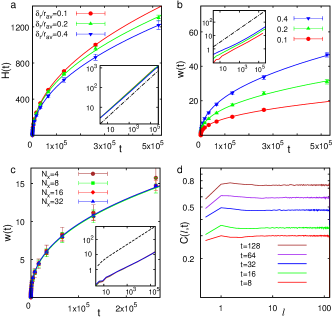
Computer Simulation Results of Imbibition. With our model, we observe a strong roughening of the imbibition front (Fig. 4d) with fast moving menisci advancing through sequences of thin capillaries and arrested menisci lagging behind. Quantitatively, the computer simulations yield a mean rise level (where denotes an average over all menisci labelled by the index ), which obeys the Lucas-Washburn -behavior (Fig. 5a). The width increases rapidly as with or for the smallest and largest polydispersities, respectively (Fig. 5b). We find a slight upward trend of at large times (Fig. 5b, inset), which is also suggested in the experimental data (Fig. 3c) and indicates that the asymptotic value of the growth exponent might be larger. This is consistent with the fact that a smaller is observed when the asymptotic behavior is approached later (as in the case of the smaller polydispersity). This implies that the asymptotic value is closer to that found for the larger polydispersity with an increased uncertainty, i.e. . Variation of the aspect ratio in the range gave identical results for the exponent .
We systematically studied finite size effects, especially on . Remarkably, we only find a dependence on the lateral system size for the smallest system size (Fig. 5c). This provides an upper bound for the characteristic length scale of height-height correlations. Within the framework of the scaling theory of roughening [38, 39], the interface width in a finite system of lateral size is expected to behave as
| (4) |
The data (Fig. 5c) suggest , implying that the roughening dynamics are not or are only weakly spatially correlated. This is confirmed by the height-height correlation function (eq. 1, Fig. 5d), which saturates quickly (around ). Scaling theory [38, 39] predicts saturation of for , which implies independent of time . This finding supports our experimental result (Fig. 3d) that any spatial roughness correlations are absent and extends its validity down to pore-pore distances and thus towards the nanometer-scale, i.e. far beyond our experimental resolution.
Experiments and Simulations Both Yield an Anomalous Roughness Growth Exponent. Experiments and simulations exhibit corresponding behavior, even on a quantitative level, i.e. progression of the imbibition front according to the Lucas-Washburn -law, fast broadening of the front with a large growth exponent and short range height-height correlations over a maximum of 1–2 pore lengths only. The pore-network model with its elongated pores hence successfully mimics the characteristics of NVG. In such morphologies, all menisci are restricted to individual pores and thus cannot interact via an effective surface tension. In the absence of interactions between individual menisci local processes at the junction become important for the front roughening. The dynamics of junction filling, as analyzed in [40], describes a threshold mode in which meniscus propagation is halted whilst the junction is filled and the new menisci in the adjacent pores form. This takes only a few milliseconds in nanometer sized pores with filling heights up to 2 cm (as in the present case), for which gravity is negligible. Once the new menisci have formed, those in the thicker pores are arrested as long as their Laplace pressure is larger than the pressure within the junction. These arrests can last much longer than the filling process, up to times of the order of the age of the propagation front, which can be several hours in our experiments. Thus for the asymptotic (long time) behavior of the broadening dynamics, the filling process of individual junctions is negligible and front roughening is mainly influenced by the arrests after the filling of the junctions. As a consequence, the distribution of pore diameters and the frequencies of junctions is expected to be much more important than the topology, in particular the dimensionality, of the network. This contrasts with the role the latter usually plays in surface roughening and critical phenomena [38, 39].
It should be noted that it is crucial that the pores in NVG are connected [21, 33], since an ensemble of independent pores with randomly varying radii over their lengths would give a roughness exponent 1/4 (see Appendix). Perhaps counterintuitively, the introduction of junctions, i.e. branch points or crossings, enhances height fluctuations and hence the front width. This is because at each branch point one meniscus can split into two (or more) upwards moving menisci with one typically moving faster than the other, or even one moving and the other stopping until the node pressure exceeds its Laplace pressure.
2 Conclusions
Pore Aspect Ratio Determines the Universality Class. Our results show that spontaneous imbibition crucially depends on the pore aspect ratio . For short pores (small ), neighboring menisci coalesce and form a continuous imbibition front. Thus the smoothening effect of an effective surface tension within the interface leads to a slow broadening of the front. Various theoretical models describe the roughening of a vapor-liquid interface during spontaneous imbibition in the presence of an effective surface tension, e.g. phase field models [19]. These predict a roughening exponent . The elongated pores in nanoporous Vycor glass (large aspect ratio ) inhibit the formation of a connected vapor-liquid interface. In this case the individual menisci cannot interact via an effective surface tension and the broadening of the imbibition front is anomalously fast with establishing another universality class. The regime of weak roughening (small ) must be separated from the regime of strong roughening (large ) by a critical value of the aspect ratio, but its precise value will depend on structural details of the pore network, in particular the pore junction geometry.
We want to stress that strong imbibition front broadening is not linked to the nanometer size of the pores. However, its experimental observation over large length and time scales significantly benefits from the dominance of capillary forces over gravitational forces, which results from the nanometer-sized pores. The theoretical model employs macroscopic hydrodynamic concepts only. Therefore, strong interfacial broadening is a consequence of any spontaneous imbibition process in porous structures with interconnected elongated capillaries independent of their macroscopic extension and mean pore diameter. It is not only important to nanofluidics, but for liquid transport in porous media in general.
Our observation of a new universality class of strong interfacial broadening is thus a very general finding, which has been made possible due to recent improvements in the resolution of neutron imaging [35]. The front roughness is crucial for many processes, such as water transport in geology, flux in oil recovery, glueing, dying and impregnation. Our results enable us to link the broadening dynamics during these processes to the properties of the porous materials. To what extent this behavior can be described with alternative models for transport in porous media, e.g. models which consider a saturation-dependent hydraulic permeability of the pores [4], warrants further investigation.
Neutron Imaging.
The nanoporous Vycor glass (NVG) consists of an interconnected network of elongated pores with a mean radius nm, a radius polydispersity , a pore aspect ratio , and a porosity of about 30 % [8, 21, 32, 33]. The macroscopic dimensions of the sample are mm3. Its faces, except the bottom face, are sealed to preclude liquid evaporation. To initiate imbibition, the bottom face of the sample is brought into contact with the surface of a water reservoir. During imbibition, the huge capillary pressure highly compresses entrapped air which is subsequently dissolved in water and hence does not affect our experiments. All experiments are performed at room temperature.
The neutron imaging experiments are performed at the ANTARES beamline of the research reactor FRM II of the Technical University Muenchen (Garching, Germany) [42]. A beam of cold neutrons passes through an aperture with size and, after a distance , ‘illuminates’ the sample, which is situated mm in front of the scintillator. The geometrical resolution is m. The transmitted neutrons are detected using a very thin ‘Gadox’ scintillator, which does not limit the geometrical resolution, and a CCD camera with pixel size µm. Series of images are recorded for total measurement times up to several hours. Individual measurement times are 30 s and data transfer times 10 s. In the first few kinetic images smearing occurs due to the front moving a significant distance during the individual measurement times. However, after about 1000 s, the smearing due to the limited time resolution is negligible compared to the spatial resolution (and only these data are used for fitting ). Raw images were corrected for detection efficiency, background and noise, while corrections for scattered neutrons are not necessary [43].
The experimentally determined neutron transmission , that is the ratio of transmitted intensity and incident intensity , is related to the absorption coefficient by
| (5) |
where mm is the sample thickness. The absorption coefficient
| (6) |
depends on the absorption coefficient of the porous matrix , experimentally determined from the dry matrix, and on that of the liquid , determined from the completely filled matrix providing . The filling factor can then be determined from the experimentally determined transmission . While silica, and thus NVG, is almost transparent to neutrons, the neutron beam is strongly attenuated by hydrogen in the water. The contrast is further enhanced by the characteristic wavelength distribution of the ANTARES beamline, which contains a large fraction of cold neutrons.
Computer Simulations. The pore-network model consists of capillaries arranged on a two-dimensional square lattice inclined at . The system consists of and nodes in the horizontal and vertical directions, respectively, with periodic boundary conditions in horizontal direction. At the nodes, four capillaries are connected to each other (Fig. 4). All capillaries have the same length , while the radius of each capillary is chosen randomly from a uniform distribution with mean radius and distribution width , i.e. disorder strength . We performed computer simulations for different lateral system sizes and a vertical size up to , which implies a maximum height which was not reached by the invasion front within the simulation time.
The water rises spontaneously from the bottom to the top of the lattice. The dynamics are controlled by capillary pressure, viscous drag and volume conservation. At each meniscus, i.e. for each capillary connected to node , we calculate the capillary pressure given by the Laplace pressure
| (7) |
where is the radius of the capillary and the surface tension ( mN/m for water). Flow through the capillary is driven by the pressure difference , where is the pressure at node .
According to Hagen-Poiseuille’s law, the volume flux from node into capillary is
| (8) |
where is the length of the liquid column in capillary of node and the viscosity of the liquid ( mPa s for water). The volume flux determines the change of the liquid volume and thus of the length of the liquid column according to . Hence, once the node pressures are known, the time dependencies of the heights are given by ordinary differential equations.
The node pressures are determined by the boundary conditions and volume conservation. The boundary conditions are the Laplace pressure at the menisci, , and zero pressure at all nodes at the bottom of the lattice which are connected to the water reservoir. The volume conservation at each node is given by
| (9) |
which corresponds to Kirchhoff’s law. The sum runs over all capillaries attached to node . The resulting set of sparse linear equations is numerically solved to obtain the node pressures for a given meniscus height configuration . The differential equations for are then numerically integrated using an implicit Euler scheme for time-stepping. Note that, due to the nanometer-sized capillaries, capillary pressure dominates gravity, which can thus be neglected.
The time step in the numerical integration of the equations of motion of the menisci heights is chosen such that each meniscus moves at most a distance and no meniscus crosses a node. If this would occur for one meniscus, is reduced such that this meniscus reaches the next node and then ‘jumps’ over the node, generating new menisci in a distance from the node (Fig. 4a), and all other menisci are also processed with the reduced . Similarly, if the meniscus retracts due to a negative pressure difference, , the meniscus is arrested when it has approached the node up to a distance . Thus a liquid column with a length of at least is kept in the capillary, i.e. always holds. The meniscus is released when (Fig. 4b). When two menisci meet, they merge and the capillary thus is completely filled (Fig. 4c), which mimics the absence of entrapped air in our experimental system.
During a computer simulation of the time evolution of the model, the average rise level of the invading front and its width are calculated at different times . Since the invasion front contains overhangs and voids, the average is taken over all menisci indexed by . The presented data are averaged over 100 simulation runs using different disorder realizations. The statistical error of this average is represented by the error bars of the simulation results.
[Imbibition front broadening in an inhomogeneous porous medium
of independent pores] For comparison with the proposed model, we
here consider spontaneous imbibition in an ensemble of independent,
i.e. non-connected or isolated, pores. The radius of a single pore
varies randomly with height such that an appropriate model for the
meniscus motion in such a pore is , where
is uncorrelated white noise with mean and variance
, i.e. ,
. For
the time to reach some height one thus gets where is white noise with mean and
variance . Averaging the stochastic variable yields
(which is the Lucas-Washburn law) and
for the variance ,
which means . The time to reach
height therefore varies typically between and
, vice versa at time one then expects the height
to vary between and
which means .
S.G. an Z.S. contributed equally to this work. S.G. and H.H. carried out the neutron radiography experiments, Z.S. performed the computer simulations for the pore network model. S.G., H.H., S.E. and P.H. designed, discussed and analyzed the experiments, Z.S. and H.R. designed and
analyzed the theoretical model. All authors contributed to the writing of the manuscript.
Acknowledgements.
We acknowledge FRM II for providing beam time. We are grateful to our local contacts Michael Schulz, Elbio Calzada and Burkhard Schillinger. We thank Mikko Alava for helpful discussions. Part of this work was supported by the DFG priority program 1164, Nano- & Microfluidics (Grant. No. Hu 850/2) and the DFG graduate school 1276, ‘Structure formation and transport in complex systems’ (Saarbruecken).References
- [1] Sahimi M (1993) Flow phenomena in rocks — from continuum models to fractals, percolation, cellular-automata, and simulated annealing. Rev Mod Phys 65: 1393.
- [2] Halpinhealy T and Zhang Y-C (1995) Kinetic roughening phenomena, stochastic growth directed polymers and all that. Phys Rep 254: 215.
- [3] Hinrichsen H (2000) Non-equilibrium critical phenomena and phase transitions into absorbing states. Adv Phys 49: 815.
- [4] Alava M, Dube M, and Rost M (2004) Imbibition in disordered media. Adv Phys 53: 83.
- [5] Lucas R (1918) Ueber das Zeitgesetz des kapillaren Aufstiegs von Fluessigkeiten. Kolloid Zeitschrift23: 15.
- [6] Washburn E-W (1921) The dynamics of capillary flow. Phys Rev 17: 273.
- [7] Dimitrov D-I, Milchev A, and Binder K (2007) Capillary rise in nanopores: Molecular dynamics evidence for the Lucas-Washburn equation Phys Rev Lett 99: 054501.
- [8] Gruener S, Hofmann T, Wallacher D, Kityk A-V, and Huber P (2009). Capillary rise of water in hydrophilic nanopores. Phys Rev E 79: 067301.
- [9] Gruener S and Huber P (2009) Spontaneous imbibition dynamics of an n-alkane in nanopores: Evidence of meniscus freezing and monolayer sticking. Phys Rev Lett 103: 174501.
- [10] Courbin L, Denieul E, Dressaire E, Roper M. Ajdari A, Stone H-A (2007) Imbibition by polygonal spreading on microdecorated surfaces. Nature Materials 6: 661.
- [11] Reyssat M, Courbin L, Reyssat E, Stone H-A (2008) Imbibition in geometries with axial variations. J Fluid Mech 615: 335.
- [12] Planet R, Pradas M, Hernndes-Machado, and J. Ortin (2007) Pressure-dependent scaling scenarios in experiments of spontaneous imbibition. Phys Rev E 76: 056312.
- [13] Dube M, Daneault C, Vuorinen V, Alava M, and Rost M (2007) Front roughening in three-dimensional imbibition. Eur Phys J B 56: 15.
- [14] Buldyrev SV, Barabasi A-L, Caserta F, Havlin S, Stanley H-E, and Vicsek T (1992) Anomalous interface roughening in porous media — experiment and model. Phys Rev A 45: R8313.
- [15] Horvath V-K and Stanley H-E (1995) Temporal scaling of interfaces propagating in porous media. Phys Rev E 52: 5166.
- [16] Miranda A-M, Menezes-Sobrinho I-L, and Couto M-S (2010) Spontaneous imbibition in newspaper sheets. Phys Rev Lett 104: 086101.
- [17] Hernandez-Machado A et al. (2001) Interface roughening in Hele-Shaw flows with quenched disorder: Experimental and theoretical results. Europhys Lett 55: 194.
- [18] Geromichalos D, Mugele F, and Herminghaus S (2002) Nonlocal dynamics of spontaneous imbibition fronts. Phys Rev Lett 89: 104503.
- [19] Dube M, Rost M, and Alava M (2000) Conserved dynamics and interface roughening in spontaneous imbibition: A critical overview. Eur Phys J B 15: 691.
- [20] Song Y-Q, Ryu S, and Sen P-N (2000). Determining multiple length scales in rocks. Nature 406: 178.
- [21] Gelb L-D and Gubbins K-E (1998) Characterization of porous glasses: Simulation models, adsorption isotherms, and the Brunauer-Emmett-Teller analysis method. Langmuir 14: 2097.
- [22] Caupin F, Cole M-W, Balibar S, and Treiner J (2008) Absolute limit for the capillary rise of a fluid. Europhys Lett 82: 56004.
- [23] Callaghan PT et al. (1991) Diffraction-like effects in NMR diffusion studies of fluids in porous solids. Nature 351: 467.
- [24] Howle L, Behringer R-P, Georgiadis J (1993) Visualization of convective fluid-flow in a porous-medium. Nature 362: 230.
- [25] Winkler B. Application of neutron radiography and neutron tomography (2006) Rev Mineralogy Geochem 63.
- [26] Kaestner A, Lehmann E, Stampanoni M. Imaging and image processing in porous media research (2008) Adv. Water Resources 31: 1174.
- [27] Strobl M, Manke I, Kardjilov N, Hilger A, Dawson M, Banhart J (2009) Advances in neutron radiography and tomography. J Phys D: Appl Phys 42: 243001.
- [28] Cnudde V, Dierick M, Vlassenbroeck J, Masschaele B, Lehmann E, Jacobs P, Van Hoorebeke L (2008) High-speed neutron radiography for monitoring the water absorption by capillarity in porous materials. Nucl. Instrum. Meth. Phys. Res. B 266: 155.
- [29] Hall SA, Hughes D, Rowe S (2010) Local charcaterization of fluid flow in sandstone with localized deformation deatures through fast neutron imaging. EPJ Web of Conferences 6: 22008.
- [30] Lenormand R (1990) Liquids in porous media. J Phys: Cond Matt 2: SA79.
- [31] Martys N, Cieplak M, Robbins MO (1991) Critical phenomena in fluid invasion of porous media. Physical Review Letters 66: 1058.
- [32] Gruener S. Rheology and Dynamics of Simple and Complex Liquids in Mesoporous Matrices. Ph.D. thesis, Saarland University, Saarbruecken, Germany (2010).
- [33] Levitz P, Ehret G, Sinha S-K, and Drake J-M (1991) Porous Vycor glass: The microstructure as probed by electron microscopy, direct energy transfer, small-angle scattering, and molecular adsorption. J Chem Phys 95: 6151.
- [34] Page J-H, Liu J, Abeles B, Deckman H-W, and Weitz D-A (1993) Pore-space correlations in capillary condensation in Vycor. Phys Rev Lett 71: 1216.
- [35] Lehmann E-H, Frei G, Kuehne G, Boillat P (2007) The micro-setup for neutron imaging: A major step forward to improve the spatial resolution. Nucl Instrum Meth Phys Res A 576: 389.
- [36] Aker E, Maloy K-J, Hansen A, and Batrouni G-G (1998) A two-dimensional network simulator for two-phase flow in porous media. Transp Porous Med 32: 163.
- [37] Lam C-H and Horvath V-K (2000). Pipe network model for scaling of dynamic interfaces in porous media. Phys Rev Lett 85: 1238.
- [38] Barabasi A-L and Stanley H-E. Fractal Concepts in Surface Growth (Cambridge University Press, New York, 1995).
- [39] Krug J. Origins of scale invariance in growth processes (1997) Adv Phys 46: 139.
- [40] Shikhmurzaev Y-D and Sprittles J-E. Wetting front dynamics in an isotropic porous medium (2012) J Fluid Mech 694: 399.
- [41] Leoni F, Kierlik E, Rosinberg M-L, and Tarjus G (2011) Spontaneous imbibition in disordered porous solids: A theoretical study of helium in silica aerogels. Langmuir 27: 8160.
- [42] Calzada E, Gruenauer F, Muehlbauer M, Schillinger B, Schulz M (2009). New design for the ANTARES-II facility for neutron imaging at FRM-II. Nucl. Instrum. Meth. Phys. Res. A 605:50).
- [43] Hassanein R, Lehmann E, Vontobel P. Methods of scattering corrections for quantitative neutron radiography (2005) Nucl Instrum Meth Phys Res A 542: 353.