The insulator Sr3Ir2O7 studied by means of angle-resolved photoemission spectroscopy
Abstract
The low-energy electronic structure of the spin-orbit insulator Sr3Ir2O7 has been studied by means of angle-resolved photoemission spectroscopy. A comparison of the results for bilayer Sr3Ir2O7 with available literature data for the related single-layer compound Sr2IrO4 reveals qualitative similarities and similar band widths for both materials, but also pronounced differences in the distribution of the spectral weight. In particular, photoemission from the states appears to be suppressed. Yet, it is found that the Sr3Ir2O7 data are in overall better agreement with band-structure calculations than the data for Sr2IrO4.
pacs:
71.20.-b, 71.70.Ej, 79.60.-iI Introduction
Extending from the wealth of phenomena occurring in transition-metal oxides, which has been studied already extensively in the last century (see e. g. Ref. Goodenough, 1971), compounds containing heavy transition-metal elements like iridium have recently attracted much interest. Probably the most prominent example is the discovery of a Mott-insulating state in the material Sr2IrO4 Kim et al. (2008). Subsequently, various theoretical proposals ranging from the realization of the Kitaev model in Mott insulators Jackeli and Khaliullin (2009) to “tailoring” potential topological insulators out of related materials Carter et al. (2012) have been made. In the layered quasi-two-dimensional compound Sr2IrO4 it is the interplay of crystal-field splitting, spin-orbit coupling, and electron-correlation effects that determines the electronic structure and leads to the realization of the complex Mott-insulating weakly ferromagnetic (canted antiferromagnetic) state Kim et al. (2008, 2009). The very nature of this state also suggests that the low-energy electronic structure is susceptible to electron-lattice interactions (distortions, phonons) as well as changes in the magnetic structure Moon et al. (2009).
The corresponding Ir-O bilayer compound Sr3Ir2O7 is expected to form a similar state while it is suggested to be very close to an insulator-metal transition and just on the verge of the Mott-insulating region with a largely diminished gap Moon et al. (2008). While band-structure calculations indicate that the low-energy electronic structures of the two materials are overall similar Moon et al. (2008), their magnetic properties somewhat differ. Magnetization measurements show a weakly ferromagnetic state in Sr2IrO4 Cao et al. (1998); the same is true for Sr3Ir2O7, yet, additionally a peculiar magnetization reversal at low temperatures has been reported Cao et al. (2002). The true nature of the magnetic structure has been revealed in a series of resonant X-ray magnetic scattering experiments. These have established that both Sr2IrO4 and Sr3Ir2O7 actually order as commensurate antiferromagnets Kim et al. (2009); Boseggia et al. (2012a), and in addition provide direct evidence in support of the model through the observation of extremely large branching ratios. One very significant difference between the two compounds, however, is that in Sr2IrO4 the moments are confined to the - plane (with a small canting), while in Sr3Ir2O7 they reorient to point along the axis Jackeli and Khaliullin (2009); Kim et al. (2012a); Boseggia et al. (2012b). It is also worth noting that neutron diffraction experiments indicate that magnetic correlations may extend to significantly higher temperatures than indicated by the resonant X-ray scattering experiments Dhital et al. (2012). Furthermore, recent resonant inelastic X-ray scattering experiments show pronounced differences in the spin excitation spectra of Sr2IrO4 Kim et al. (2012b) and Sr3Ir2O7 Kim et al. (2012c).
Given its entanglement with the magnetic properties it is important to provide a comparison of the low-energy electronic structure for the two compounds. A powerful experimental tool to determine the electronic spectrum is angle-resolved photoemission spectroscopy (ARPES). While ARPES data on Sr2IrO4 have been reported previously Kim et al. (2008), until now such data on Sr3Ir2O7 were not available. Therefore, in this article we report the low-energy electronic structure for Sr3Ir2O7 measured by ARPES and compare it to the available single-layer data as well as density-functional-theory band-structure calculations. We find an overall very good agreement between the experiment and the calculations for the bilayer compound, yet, the measured spectral weight from the states is extremely weak. Moreover, while the distribution of spectral weight is markedly different from Sr2IrO4, the data from both compounds are qualitatively similar and exhibit some disagreement with the calculations in the center of the Brillouin zone.

II Experimental results
The studied single crystal of Sr3Ir2O7 was synthesized at the Clarendon Laboratory using a self-flux technique as described in Ref. Boseggia et al., 2012a. ARPES experiments were performed at the BALTAZAR laser-ARPES facility using a laser-based angle-resolving time-of-flight analyzer and linearly polarized eV photons Berntsen et al. (2011). The -axis-oriented single crystal of Sr3Ir2O7 was cleaved and measured under ultra-high-vacuum conditions with a pressure below mbar at a temperature K. Complementary partial areas of the Brillouin zone were covered by a series of measurements with different sample orientations and the resulting spectra were normalized and combined to yield a full data set spanning more than an eighth of the Brillouin zone. The energy and crystal-momentum resolution of the measurements are about meV and Å-1, respectively. The chemical potential was determined within an accuracy of about meV through a work-function estimate.
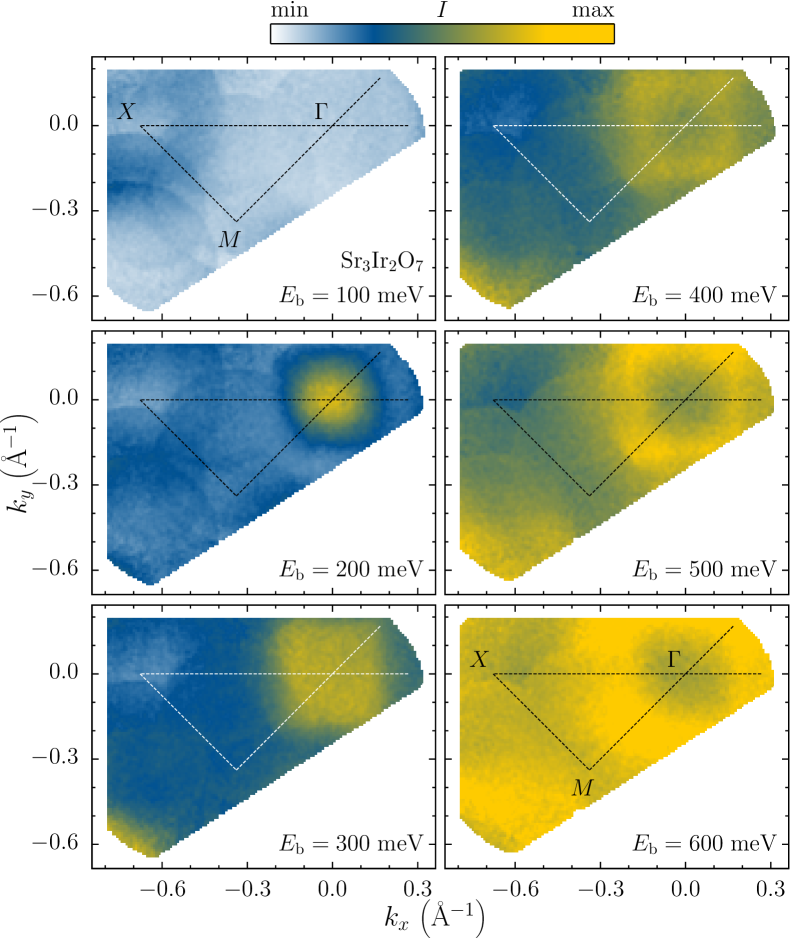
Figure 1 shows measured ARPES spectra [energy-distribution curves (EDCs)] along a line of high-symmetry points in reciprocal space. The insulating character of Sr3Ir2O7 is reflected in the lack of spectral weight around zero binding energy (, no Fermi surface). With increasing binding energy first a weak dispersive feature appears around the point indicated by the extremal EDC curvature. At the center of the Brillouin zone () there seems to be a very weak “intensity tail” at low binding energy, yet, the first clear maximum at is found just above meV. While being rather flat in the close vicinity of , the spectral weight rather quickly shifts from this “band” to a feature at higher binding energies when departing from (in every direction) and finally forms a broad flat maximum located away from at meV.
A further overview over the spectral-weight distribution in the whole Brillouin zone is provided in the constant-energy surfaces depicted in Fig. 2. In this context, it should be noted that the observed Brillouin zone of Sr3Ir2O7 is smaller than expected for the originally determined tetragonal space group with an in-plane lattice constant Å Subramanian et al. (1994). Therefore, the near-surface electronic structure provides further evidence that at least at low temperatures Sr3Ir2O7 might feature similar coherent IrO6 octahedra rotations as Sr2IrO4 leading to a bigger tetragonal unit cell Crawford et al. (1994) or even have an orthorhombic structure as reported previously (see, e. g. Refs. Cao et al., 2002 or Matsuhata et al., 2004).
III Analysis
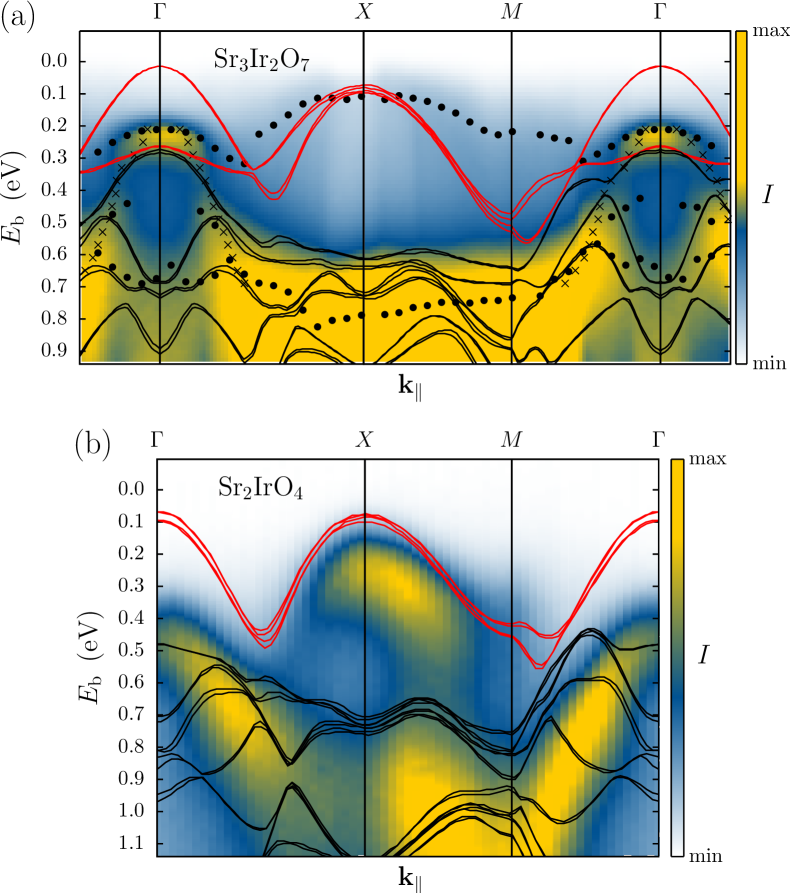
The ARPES data on Sr3Ir2O7 presented here are consistent with previous studies of the optical conductivity which showed an insulating state with a small gap Moon et al. (2008). To facilitate a further comparison, the ARPES spectra for Sr3Ir2O7 are depicted together with density-functional-theory band-structure calculations Moon et al. (2008) in Fig. 3(a). Like in Fig. 1, the bullets () represent distinct maxima in the concave EDC curvature. The high intensity above meV with the strong mode dispersing to about meV at show a remarkable agreement with the bands (solid black lines) predicted by the calculations. The distribution of the remaining spectral weight at lower energies has the same topology as the calculated bands (solid red lines). Hence, even though not all the bands could be clearly resolved in our experiment the data show a good overall agreement with the results of the calculations.
Turning to the pronounced feature in the vicinity of the EDCs reveal two modes originating at meV. An intense band strongly disperses towards the high-energy maximum indicated by the curvature maxima at meV, a second weakly dispersing band with only low intensity follows the low-energy onset between meV and meV. Naturally, the fast dispersing feature is seen more clearly in the intensity distribution at fixed binding energies [momentum-distribution curves (MDCs)]. The MDCs along the high-symmetry lines close to can be well described by a model function consisting of two Lorentzians. The resulting peak positions (crosses, ) are depicted in Fig. 3(a). Starting at meV they trace the intense band and overlap with the EDC curvature maxima at higher binding energies. These features identified in the EDCs and MDCs around are consistent with the calculated and bands. Overall, we observe that all the bands carry very little spectral weight. While the bands around and a part of the bilayer-split bands around can still be recognized, the only sign of the predicted split-off bands at very low binding energies around might be the aforementioned almost vanishingly weak EDC “tail” below meV (cf. Fig. 1), whose signature, however, is too faint for any further analysis. Owing to their weakness, the width of the occupied bands is difficult to determine. Judging from the onset of spectral weight, given by the lowest-energy EDC curvature maxima, one obtains a band width of about meV. Yet, based on our data, it cannot be excluded that several bands are hidden in the spectral region between about meV and meV. Therefore, the most accurate estimate for a single band appears to be possible considering only the dispersion between and having a band width of about meV.
IV Discussion
Our data on Sr3Ir2O7 also show a qualitative resemblance with the ARPES data on Sr2IrO4 Kim et al. (2008) as there are clearly valence-band maxima at and where the latter is found at a lower binding energy. For a direct comparison the ARPES data for Sr2IrO4 ( eV, K, Ref. Kim et al., 2008) and the calculated band structure of Ref. Moon et al., 2008 are shown in Fig. 3(b). Contrary to the case of Sr3Ir2O7, the details of the calculations seem to differ substantially from the data particularly close to the center of the Brillouin zone and in the size of the predicted energy gap. In Ref. Kim et al., 2008 it has been pointed out that the calculations reproduce the valence-band-maxima topology for this material. Yet, the assignment of both the valence-band maxima at and to the bands Kim et al. (2008) is ambiguous as in Sr3Ir2O7 the main spectral weight at seems to originate from the states. Taking into account only the band connected to the valence-band maximum at , the band width between and appears to be about meV which is rather close to our estimate for Sr3Ir2O7, while for both materials the calculated band width is about two to three times larger ( meV between and ) Moon et al. (2008). The most pronounced difference between the ARPES data of the single-layer and bilayer materials is the intensity found in the valence-band maxima—while for Sr2IrO4 a high intensity is found in the valence-band maximum at , the low-energy spectral weight in Sr3Ir2O7 is substantially suppressed.
The measurements of the optical conductivity and the calculated density of states Moon et al. (2008) would suggest more similar results for both materials, but various effects could lead to the observed difference. In general, it could be related to varying photoemission cross-sections for the distinct photon energies used in the experiments Yeh and Lindau (1985). However, this does not explain the weakness of the bands in Sr3Ir2O7 as they derive from the same Ir states as the bands. Also, there could be an effect from probing different out-of-plane crystal momenta in the not truely two-dimensional systems. Additionally, the symmetry of the states could play a role in the photoemission process—however, the experiment was not performed in a specific high-symmetry geometry, which renders the substantial suppression of the intensity of the states due to that unlikely. Eventually, the low intensity might be the result of a lack in suitable final states excitable by the rather low photon energy used in the experiment. Future ARPES experiments on both materials employing various photon energies and geometries could provide an answer to this open question.
Concerning the peculiarities in the magnetic properties of these materials, the observation of the (qualitatively) similar low-energy electronic structures in Sr2IrO4 and Sr3Ir2O7 would suggest similar magnetic properties. However, different moment orderings cannot be excluded either as long as the “orbital order” is similar Kim et al. (2012a) and might provide a reason for the marked differences observed in magnetization and muon-spin rotation Franke et al. (2011). Also, as mentioned before, the rather good agreement of the data and band calculations for Sr3Ir2O7 but not Sr2IrO4 could be a hint for less pronounced electron correlations in the bilayer material consistent with the apparent departure from the spin-wave expectation observed in resonant inelastic X-ray scattering experiments Kim et al. (2012c).
V Conclusion
To summarize, we presented experimental ARPES data on Sr3Ir2O7 and compared them to data on Sr2IrO4 as well as band-structure calculations available in the literature. The data on both compounds are qualitatively similar, thus confirming the related electronic structures. The comparison with the calculations shows a very good overall agreement for Sr3Ir2O7, thus confirming the insulating state in this material. However, the band width appears to be reduced as compared to the calculations and the observed bands carry very little spectral weight. Further studies are required to elucidate the origin of this effect as well as the partial disagreement of the data and calculations for Sr2IrO4.
Acknowledgements.
This work was made possible through support from the Knut and Alice Wallenberg Foundation, the Swedish Research Council, the Swiss National Science Foundation, its NCCR MaNEP and Sinergia network MPBH, as well as the EPSRC.References
- Goodenough (1971) John B. Goodenough, “Metallic oxides,” Prog. Solid State Chem. 5, 145–399 (1971).
- Kim et al. (2008) B. J. Kim, Hosub Jin, S. J. Moon, J.-Y. Kim, B.-G. Park, C. S. Leem, Jaejun Yu, T. W. Noh, C. Kim, S.-J. Oh, J.-H. Park, V. Durairaj, G. Cao, and E. Rotenberg, “Novel Mott State Induced by Relativistic Spin-Orbit Coupling in ,” Phys. Rev. Lett. 101, 076402 (2008).
- Jackeli and Khaliullin (2009) G. Jackeli and G. Khaliullin, “Mott Insulators in the Strong Spin-Orbit Coupling Limit: From Heisenberg to a Quantum Compass and Kitaev Models,” Phys. Rev. Lett. 102, 017205 (2009).
- Carter et al. (2012) Jean-Michel Carter, V. Vijay Shankar, M. Ahsan Zeb, and Hae-Young Kee, “Semimetal and topological insulator in perovskite iridates,” Phys. Rev. B 85, 115105 (2012).
- Kim et al. (2009) B. J. Kim, H. Ohsumi, T. Komesu, S. Sakai, T. Morita, H. Takagi, and T. Arima, “Phase-Sensitive Observation of a Spin-Orbital Mott State in Sr2IrO4,” Science 323, 1329–1332 (2009).
- Moon et al. (2009) S. J. Moon, Hosub Jin, W. S. Choi, J. S. Lee, S. S. A. Seo, J. Yu, G. Cao, T. W. Noh, and Y. S. Lee, “Temperature dependence of the electronic structure of the Mott insulator studied by optical spectroscopy,” Phys. Rev. B 80, 195110 (2009).
- Moon et al. (2008) S. J. Moon, H. Jin, K. W. Kim, W. S. Choi, Y. S. Lee, J. Yu, G. Cao, A. Sumi, H. Funakubo, C. Bernhard, and T. W. Noh, “Dimensionality-Controlled Insulator-Metal Transition and Correlated Metallic State in Transition Metal Oxides (, 2, and ),” Phys. Rev. Lett. 101, 226402 (2008).
- Cao et al. (1998) G. Cao, J. Bolivar, S. McCall, J. E. Crow, and R. P. Guertin, “Weak ferromagnetism, metal-to-nonmetal transition, and negative differential resistivity in single-crystal ,” Phys. Rev. B 57, R11039–R11042 (1998).
- Cao et al. (2002) G. Cao, Y. Xin, C. S. Alexander, J. E. Crow, P. Schlottmann, M. K. Crawford, R. L. Harlow, and W. Marshall, “Anomalous magnetic and transport behavior in the magnetic insulator ,” Phys. Rev. B 66, 214412 (2002).
- Boseggia et al. (2012a) S. Boseggia, R. Springell, H. C. Walker, A. T. Boothroyd, D. Prabhakaran, D. Wermeille, L. Bouchenoire, S. P. Collins, and D. F. McMorrow, “Antiferromagnetic order and domains in Sr3Ir2O7 probed by x-ray resonant scattering,” Phys. Rev. B 85, 184432 (2012a).
- Kim et al. (2012a) J. W. Kim, Y. Choi, Jungho Kim, J. F. Mitchell, G. Jackeli, M. Daghofer, J. van den Brink, G. Khaliullin, and B. J. Kim, “Dimensionality Driven Spin-Flop Transition in Layered Iridates,” Phys. Rev. Lett. 109, 037204 (2012a).
- Boseggia et al. (2012b) S. Boseggia, R. Springell, H. C. Walker, A. T. Boothroyd, D. Prabhakaran, S. P. Collins, and D. F. McMorrow, “On the magnetic structure of Sr3Ir2O7: an x-ray resonant scattering study,” J. Phys.: Condens. Matter 24, 312202 (2012b).
- Dhital et al. (2012) Chetan Dhital, Sovit Khadka, Z. Yamani, Clarina de la Cruz, T. C. Hogan, S. M. Disseler, Mani Pokharel, K. C. Lukas, Wei Tian, C. P. Opeil, Ziqiang Wang, and Stephen D. Wilson, “Spin ordering and electronic texture in the bilayer iridate Sr3Ir2O7,” Phys. Rev. B 86, 100401 (2012).
- Kim et al. (2012b) Jungho Kim, D. Casa, M. H. Upton, T. Gog, Young-June Kim, J. F. Mitchell, M. van Veenendaal, M. Daghofer, J. van den Brink, G. Khaliullin, and B. J. Kim, “Magnetic Excitation Spectra of Probed by Resonant Inelastic X-Ray Scattering: Establishing Links to Cuprate Superconductors,” Phys. Rev. Lett. 108, 177003 (2012b).
- Kim et al. (2012c) Jungho Kim, A. H. Said, D. Casa, M. H. Upton, T. Gog, M. Daghofer, G. Jackeli, J. van den Brink, G. Khaliullin, and B. J. Kim, “Giant Magnon Gap in Bilayer Iridate Sr3Ir2O7: Enhanced Pseudo-dipolar Interactions Near the Mott Transition,” (2012c), arXiv:1205.5337 .
- Berntsen et al. (2011) M. H. Berntsen, O. Götberg, and O. Tjernberg, “An experimental setup for high resolution 10.5 eV laser-based angle-resolved photoelectron spectroscopy using a time-of-flight electron analyzer,” Review of Scientific Instruments 82, 095113 (2011).
- Subramanian et al. (1994) M.A. Subramanian, M.K. Crawford, and R.L. Harlow, “Single crystal structure determination of double layered strontium iridium oxide [Sr3Ir2O7],” Materials Research Bulletin 29, 645–650 (1994).
- Crawford et al. (1994) M. K. Crawford, M. A. Subramanian, R. L. Harlow, J. A. Fernandez-Baca, Z. R. Wang, and D. C. Johnston, “Structural and magnetic studies of ,” Phys. Rev. B 49, 9198–9201 (1994).
- Matsuhata et al. (2004) Hirofumi Matsuhata, Ichiro Nagai, Yoshiyuki Yoshida, Sigeo Hara, Shin-ichi Ikeda, and Naoki Shirakawa, “Crystal structure of Sr3Ir2O7 investigated by transmission electron microscopy,” Journal of Solid State Chemistry 177, 3776–3783 (2004).
- Yeh and Lindau (1985) J.J. Yeh and I. Lindau, “Atomic subshell photoionization cross sections and asymmetry parameters: ,” Atomic Data and Nuclear Data Tables 32, 1–155 (1985).
- Franke et al. (2011) I. Franke, P. J. Baker, S. J. Blundell, T. Lancaster, W. Hayes, F. L. Pratt, and G. Cao, “Measurement of the internal magnetic field in the correlated iridates Ca4IrO6, Ca5Ir3O12, Sr3Ir2O7 and Sr2IrO4,” Phys. Rev. B 83, 094416 (2011).