A search for thermal X-ray signatures in Gamma-Ray Bursts II: The Swift sample
Abstract
In several gamma-ray bursts (GRBs) excess emission, in addition to the standard synchrotron afterglow spectrum, has been discovered in the early time X-ray observations. It has been proposed that this excess comes from black body emission, which may be related to the shock break-out of a supernova in the GRBs progenitor star. This hypothesis is supported by the discovery of excess emission in several GRBs with an associated supernova. Using mock spectra we show that it is only likely to detect such a component, similar to the one proposed in GRB 101219B, at low redshift and in low absorption environments. We also perform a systematic search for black body components in all the GRBs observed with the Swift satellite and find six bursts (GRB 061021, 061110A, 081109, 090814A, 100621A and 110715A) with possible black body components. Under the assumption that their excess emission is due to a black body component we present radii, temperatures and luminosities of the emitting components. We also show that detection of black body components only is possible in a fraction of the Swift bursts.
keywords:
gamma-rays: bursts, gamma-rays: observations, supernovae: general1 Introduction
Gamma-ray bursts (GRBs) emit extreme amounts of -rays on a short time scale; typically erg are released in seconds. Only violent processes, such as a compact object merger or the collapse of a massive star, can explain these large energy releases, which have made GRBs observable out to high redshifts of (Tanvir et al., 2009; Salvaterra et al., 2009; Cucchiara et al., 2011).
There exists strong evidence, that the collapse of massive stars can produce long GRBs ( s; Kouveliotou et al., 1993), since spectroscopic features from supernovae (SNe) have been detected in optical follow-up observations of GRBs (e.g. Galama et al. (1998); Hjorth et al. (2003); Starling et al. (2011). Also see review by Hjorth & Bloom (2011)). All these SNe are of type Ic with broad lines and no signs of Hydrogen or Helium. Besides these spectroscopic detections, evidence for SN Ic features is also found in light curves of some GRBs (Patat et al., 2001; Lipkin et al., 2004; Cobb et al., 2010; Cano et al., 2011).
One burst of particular interest was GRB 060218 (Soderberg et al., 2006; Mazzali et al., 2006). It had an associated supernova (Pian et al., 2006), and its X-ray afterglow could best be described by a combination of synchrotron emission, which is usual for afterglows, and black body emission (Campana et al., 2006). Waxman et al. (2007) showed that this black body emission could origin in a shock generated by the breakout of a supernova through the surface of the GRBs progenitor star. Subsequently, thermal X-ray emission which may be described by a black body has been suggested in GRB 090618, GRB 100316D and GRB 101219B, which all have associated SNe (Page et al. (2011), Starling et al. (2011), Starling et al. (2012), respectively. See also Starling et al. (2012)). This supports the connection of the black body component with emission from a supernova. Deviations from a single power law in the early X-ray spectra in GRBs, was also found by Butler (2007), who identified a soft emission component in % of the bursts in the studied sample.
In this series of papers, we search for more bursts with X-ray black body components, and derive the conditions under which such components may be reliably recovered. In Paper I (Starling et al., 2012) black body components were identified in bursts with spectroscopic or photometric signatures in the optical. The aim of this paper is to perform a systematic search for more bursts with X-ray black body components in the Swift sample, and to derive the conditions under which such components may be reliably recovered. In Section 2 the sample and model fitting are described, and in Section 3 we create simulated spectra to set constraints on the detectability of black body components. In Section 4 bursts are selected as candidates for having black body emission, and Section 5 presents and discusses the final list of candidates. Section 6 extracts physical parameters, assuming that the excess emission is black body emission, and the fraction of GRBs with probable excess emission is examined.
For the cosmological calculations we assume a CDM-universe with , , and . All stated errors and error bars are 90% confident. In the plots is in units of cm-2 unless stated otherwise. We will use the words thermal components and black body components interchangeably.
2 Fitting models with black body components to a sample of GRBs
2.1 A sample of Swift bursts
The sample, in which we will search for X-ray black body components, consists of the GRBs observed with the Swift XRT (Burrows et al., 2005), where redshifts are determined with optical spectroscopy, or simultaneous multi-band photometry, as obtained from the GROND-instrument (Krühler et al., 2011a). Furthermore we only select bursts, where Windowed Timing mode (WT mode) observations exist, since this assures that data were taken shortly after the trigger. The sample consists of 190 bursts with the most recent burst from August 8th 2011.
We used the publicly available111Website for XRT data: http://www.swift.ac.uk/ WT mode data, see Evans et al. (2009). Note, that the sample also includes bursts not triggered by Swift. We make use of the time-averaged WT mode spectra, which have all been created in the same manner according to Evans et al. (2009) and using the Swift software version 3.8 and the latest calibration data.
2.2 Spectral modelling
In order to identify black body emission for a burst, it is necessary to understand the interplay between all contributing components in the observed spectrum: the afterglow continuum, the black body emission and the absorption of the source emission by gas in the line-of-sight within the host galaxy and the Galaxy. These properties can be parametrised by the seven parameters in Table 1. Note, that not all parameters are free: in our sample the redshift of each burst is known, and the Galactic column density can, in most cases, be determined to within 5% (Kalberla et al., 2005).
| Description | M1 | M2 | M3 | M4 | |
|---|---|---|---|---|---|
| Redshift of the GRB | fixed | fixed | fixed | fixed | |
| Galactic column density | fixed | fixed | fixed | fixed | |
| or | Intrinsic column density in the GRB host galaxy | free | free | late fit | late fit |
| Photon index, defined as ( is flux) | free | free | free | free | |
| Flux of the power law component of the afterglow in a keV band | free | free | free | free | |
| Black body temperature (in the rest frame of the burst) | - | free | - | free | |
| Flux of the black body emission in a keV band | - | free | - | free |
For each burst we fitted four different models to the WT spectrum. These models are also shown in Table 1. Model 1 (M1) is an absorbed power law, whereas Model 2 (M2) also includes black body emission at the redshift of the bursts. Model 3 and 4 (M3 and M4) are similar to Model 1 and 2, with the only difference, that is fitted to the late-time Photon Counting mode spectrum, which we expect to be free from additional components and therefore a reliable measure of any absorbing column, instead of from the early-time (WT) spectrum itself. The atomic data used are Solar abundances from Wilms et al. (2000) and cross-sections from Verner et al. (1996).
For all the WT spectra we group the spectra in 20 counts per bin and perform a -fit. For the late time observations, used to determine in Model 3 and 4, ungrouped spectra are fitted with Cash statistics Cash (1979).
2.3 Selecting candidates with the F-test
The F-test (e.g.; Lampton et al., 1976) is a statistical test, which gives the probability that an improvement in the reduced , with the inclusion of extra parameters, is due to an improvement in the fitting model. To test whether a black body component is present in a spectrum, we therefore use the F-test to compare Model 1 and 2 and Model 3 and 4. Protassov et al. (2002) showed, that the F-test is not a stringent test, but in the following section we will explicitly show, that the F-test in many cases is sufficient to recover black body components, when they are present. In Section 4 we will select the candidates.
3 Recovering a black body component in mock spectra of GRB 101219B
In Section 4 it will be found, that one of the candidates for having a black body component is GRB 101219B with a temperature of 0.22 keV in the Model 2 fit (see Section 4 and Table 2). This value is consistent with the value found in Paper I. With a redshift of (de Ugarte Postigo et al., 2011) GRB 101219B is one of the most distant GRBs with a spectroscopically detected supernova (Sparre et al., 2011). Now mock spectra will be used to derive the range of column densities, redshifts and afterglow parameters for which a detection of the black body component is possible, and we will use this information to refine our candidate list.
3.1 The role of column densities
To reveal the role of the column densities, the F-test significances of the black body detections are calculated for several 101219B-like mock spectra with -values varying from to cm-2. The other parameters used to create the mock spectra are identical to the recovered value in the fit of Model 2 from the real data.
The left panel in Figure 1 shows how the F-test significance (calculated from Model 1 and 2) depends on the -value used to generate the mock spectra. If the F-test significance is lower than we will say that Model 2 is favoured over Model 1 (i.e. the presence of a black body component is favoured). The central and the right panel show the and recovered by the fits of the same mock spectra. When the used to generate the mock data is larger than cm-2, the recovered by the fit is often too small, and in most cases a temperature with a large error is recovered. For cm-2 the F-test favours the existence of a black body component, and correct and -values are recovered within their errors.
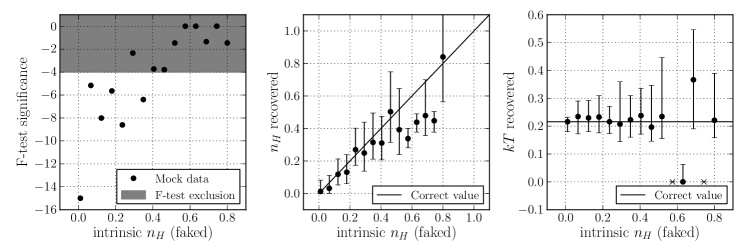
Similar mock spectra without black body components were also made, and no significant detections of black body components were favoured by the F-test.
3.1.1 Fixing to the late time spectrum
For the fits of the real data the -values in Model 3 and 4 are fixed to the fitted value from the late time spectrum. Now it will explicitly be shown, that this method might lead to significant black body detections for spectra with no real black body components, when is fixed to a too large value.
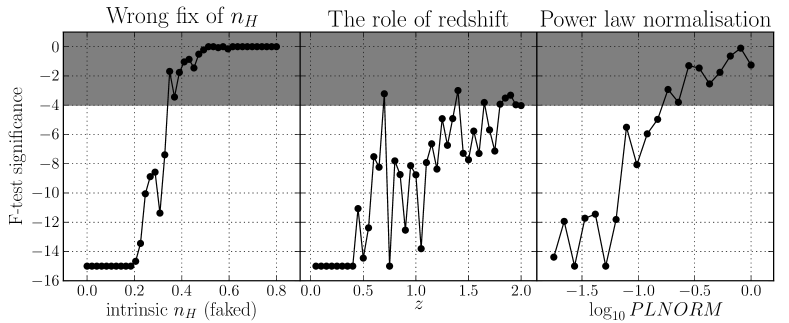
First spectra with photon indices and power law normalizations identical to GRB 101219B are generated, but with varying from to cm-2. All the spectra are generated without black body components. In the fitting function is fixed to cm-2 for all the spectra, just like if this value had come from the fit of a late time spectrum. In Figure 2 (left panel) it is shown that the F-test favours a black body component when cm-2. All the recovered black body components had temperatures between 0.08 keV and 0.2 keV. We conclude that, if is fixed to a value cm-2 larger than the real value, a spurious black body component will compensate for the flux lost due to the high column density absorption parameter.
A side result of this analysis is that typical Galactic column densities can not lead to spurious detections of black body components. is typically of order cm-2 with a 10 per cent error (Kalberla et al., 2005), which is well below the critical value of cm-2 found above.
3.2 Redshift and afterglow parameters
To find the redshifts for which it is possible to observe a GRB 101219B-like black body component, simulations like those in Section 3.1 are performed, with the only difference that is varied instead of . Figure 2 (central panel) shows, that black body components are recovered with F-test significances when . For the significance of the detections are lowered by several orders of magnitudes.
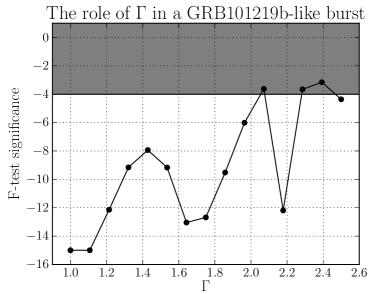
The role of the parameters describing the synchrotron emission from the afterglow will now be quantified. First we fix the photon index to the GRB 101219B-value and simulate spectra with power law normalizations covering the values observed in our sample. The resulting F-test significances of our fits are shown in Figure 2 (right panel). A low normalization constant is essential in order not to dilute the signal from the black body component with noise from the afterglow emission. We also fitted simulated spectra with a fixed normalisation and a varying photon index, see Figure 3. A trend in the complicated pattern is that GRB 101219B-like black bodies are most likely to be detected with low photon indices.
4 Selecting Candidates
Now we will start searching for candidates with black body components in our sample. The bursts with F-test probabilities lower than in the Model 1-2 comparison or the Model 3-4 comparison were selected. For now, we are only interested in making an initial list of candidates, which will be refined later. We are therefore using a looser F-test significance threshold here than in Section 3 (a limit of is now used instead of ). The selected candidates are listed in Table 2.
4.1 Ruling out candidates with uncertain
It is important to understand the contribution of in order to make a reliable detection of a black body component. We therefore removed all bursts with a 90% error on larger than cm-2 for Model 2 or larger than cm-2 for Model 4. A lower threshold was chosen for Model 2, so candidates with a degenerate -value were excluded. In Table 2 a burst is marked with uncertain , if it is excluded due to this criterion. The analysis was done for larger values of the thresholds, but it did not lead to the detection of more candidates in the refined analysis, which will be presented in Section 4.3 and 4.4.
| GRB | F-stat (M1-2) | F-stat (M3-4) | (M2) | (M4) | (M2) | (M4,fixed) | Note | |
|---|---|---|---|---|---|---|---|---|
| 050724 | 0.257 | overflow | underflow | |||||
| 050820A | 2.6147 | overflow | underflow | unc. High- | ||||
| 060124 | 2.3 | High- | ||||||
| 060202 | 0.783 | |||||||
| 060218 | 0.0331 | |||||||
| 060418 | 1.49 | overflow | ||||||
| 060502A | 1.5026 | unc. (M2 only) | ||||||
| 060604 | 2.68 | High- | ||||||
| 060714 | 2.7108 | unc. High- | ||||||
| 060904B | 0.7029 | |||||||
| 061021 | 0.3463 | |||||||
| 061110A | 0.7578 | overflow | ||||||
| 061121 | 1.3145 | |||||||
| 070318 | 0.8397 | |||||||
| 070419A | 0.9705 | unc. | ||||||
| 070508 | 0.82 | |||||||
| 070724A | 0.457 | |||||||
| 071031 | 2.6918 | High- | ||||||
| 071112C | 0.8227 | |||||||
| 080210 | 2.6419 | unc. High- | ||||||
| 080310 | 2.4274 | High- | ||||||
| 080319B | 0.9382 | underflow | ||||||
| 080413A | 2.433 | unc. High- | ||||||
| 080430 | 0.767 | |||||||
| 080603B | 2.6892 | unc. High- | ||||||
| 080604 | 1.4171 | |||||||
| 080605 | 1.6403 | |||||||
| 080721 | 2.5914 | unc. High- | ||||||
| 080805 | 1.5042 | unc. | ||||||
| 080928 | 1.6919 | overflow | underflow | |||||
| 081007 | 0.5295 | unc. (M2 only) | ||||||
| 081008 | 1.967 | |||||||
| 081109 | 0.9787 | |||||||
| 081203A | 2.05 | overflow | unc. High- | |||||
| 081222 | 2.77 | High- | ||||||
| 081230 | 2.03 | High- | ||||||
| 090418A | 1.608 | |||||||
| 090424 | 0.544 | |||||||
| 090618 | 0.54 | |||||||
| 090809 | 2.737 | High- | ||||||
| 090812 | 2.452 | High- | ||||||
| 090814A | 0.696 | |||||||
| 090926B | 1.24 | unc. | ||||||
| 091029 | 2.752 | overflow | unc. High- | |||||
| 100117A | 0.92 | unc. | ||||||
| 100418A | 0.6235 | |||||||
| 100621A | 0.542 | |||||||
| 101219B | 0.55 | |||||||
| 110205A | 2.22 | High- | ||||||
| 110715A | 0.82 | |||||||
| 110731A | 2.83 | unc. High- | ||||||
| 110808A | 1.348 | unc. |
4.2 Candidates at high and low redshift
4.2.1 The high-redshift candidates ()
For GRB 101219B-like black body components are difficult to detect (see Section 3.2 and Figure 2). A number of candidates with have, however, emerged in our analysis. They typically exhibit high temperatures ( keV), which is much higher than most previously claimed examples (e.g.; Campana et al., 2006; Starling et al., 2011). They also have an uncertain , which increases the risk of a spurious detection.
At low redshift (e.g. ), only a few candidates have temperatures larger than keV, even though a detection of such a black body component is expected to be easier at lower redshift. The high-redshift candidates are therefore unlikely to represent real black bodies, and they will not be examined further in this work.
4.2.2 The low-redshift candidates ()
Three of the candidates, GRB 060218, GRB 090618 and GRB 101219B, already have identified black body components in other studies, and they also have a spectroscopically confirmed SN in the optical. Among our candidates is also GRB 100418A, which also has a SN in the optical (de Ugarte Postigo et al. in prep.). Paper I studied the early X-ray spectrum of GRB 100418, and also find that a model with a powerlaw and a black body model can give a good fit. However, they cannot rule out an absorbed power law model given the large uncertainty on the intrinsic absorbing column of this GRB host, which may be higher than the limit for detectability we find in Section 3.1 of cm-2. Paper I also studied GRB 081007, and found an indication of a black body component, but no conclusive evidence.
At first sight it is worrying, that GRB 100316D, which Starling et al. (2011) showed had an excess black body emission, is not among our candidates. An examination of this burst shows, that it is not selected due to a F-test value of 0.007 (for the Model 1-2 comparison), which is slightly above our threshold of 0.005 defined in Section 2.3. It is therefore clear that our candidate selection algorithm will not find all bursts with black body components (discussed further in Section 6.1).
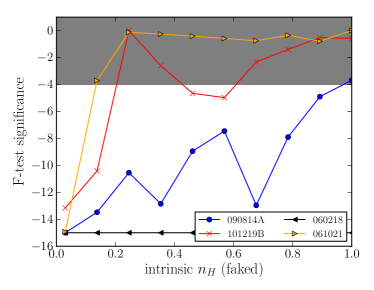
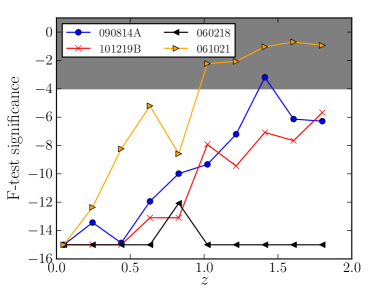
Figure 4 and 5 show how the F-test significances of the black body component detections in a selection of our low redshift candidates depend on column density and redshift. In general the same trends found for GRB 101219B above applies for both GRB 090814A and GRB 061021. A black body component, similar to the one present in GRB 060218, is expected to be detectable at high redshifts (e.g. 2).
4.3 Approach I: Fitting with 5 free parameters
The final step in our selection procedure is to do a time sliced analysis of the remaining candidates, i.e. those without remarks in Table 2. In this section we will focus on the candidates selected in the comparison between Model 1 and 2. In Section 4.4 we will fit and analyse the candidates selected with Model 3 and 4.
For each of the candidates, where Model 2 is favoured by the F-test, we manually inspected the light curves, and selected time intervals, where the light curves exhibit a single power law decay. We especially tried to avoid time intervals with flares and plateaus.
To each time sliced spectrum all the models were fit, see a summary of the fits in Table 3. Several candidates with no flare-free epochs are excluded from the table. The candidates with excess emission are GRB 061021, GRB 061110A and GRB 090814A. They have low column densities ( cm-2) for both Model 2, where the is a free parameter, and Model 4, where is fitted with the late time spectrum. In all the fits the presence of a black body component is favoured by the F-test with significances from to . The temperatures are between and keV, which is consistent with claimed black body components in other studies.
In Table 3, some bursts are also listed as candidates with some caveats. These are GRB 100621A (because it has a F-test significance of 0.00144, and a large ), GRB 061121 (it has large and , and the F-test does not favour a black body component in Model 3 and 4) and GRB 050724 (it has an unexpectedly high ). We note that GRB 050724 has been classified as a short burst with extended emission (Barthelmy et al., 2005), so its origins may not lie in the collapse of a massive star as is the case for the rest of our sample which are all long GRBs.
4.4 Approach II: Breaking -degeneracies with the late time spectrum
The three bursts, which were candidates for having black body components in the previous subsection, all have low column densities cm-2. This is expected from Figure 4 which showed, that it is hard to recover a black body component at large , when it is fitted as a free parameter (as in Model 1 and 2).
We will now do a new search for black body components, where we use the the late time spectrum to fit , i.e. use Model 3 and 4. This method can break the degeneracies between and the other parameters, but it also has the disadvantage that a spurious black body component can be found if a too high value of is recovered in the late time spectrum (see Section 3.1.1).
We fitted Model 3 and 4 to the candidates. Table 4 summarizes the fits. Several of the candidates are not shown in the table, since they have complex and bumpy light curves, or too little data to extract a good spectrum.
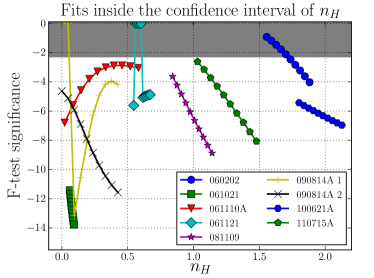
Several bursts have favourable F-test significances. To explicitly check whether the fixing of might have caused spurious black body detections, we made additional fits, where was fixed to a range of different values within the confidence intervals recovered in the late time fits. Figure 6 shows how the significances of the detections depend on the value to which is fixed. The detection is not robust for GRB 060202 and GRB 061121 because of degeneracies between and from the late time spectrum. The list of candidates from the Model 3 to 4 comparison consists of GRB 061021, 061110A, 081109, 090814A, 100621A and 110715A.
| Candidates with probable excess emission: |
| GRB | Time | F-test M12 | F-test M34 | (M2) | (M4) | (M2) | (M4,fixed) | ||
|---|---|---|---|---|---|---|---|---|---|
| 061021 | |||||||||
| 061110A | |||||||||
| 090814A | |||||||||
| 090814A |
| Candidates with some caveats: |
| GRB | Time | F-test M12 | F-test M34 | (M2) | (M4) | (M2) | (M4,fixed) | ||
|---|---|---|---|---|---|---|---|---|---|
| 050724 | |||||||||
| 061121 | |||||||||
| 100621A | |||||||||
| 100621A |
| Candidates where a black body component is not favoured: |
| GRB | Time | F-test M12 | F-test M34 | (M2) | (M4) | (M2) | (M4,fixed) | ||
|---|---|---|---|---|---|---|---|---|---|
| 060202 | 0.783 | ||||||||
| 060202 | 0.783 | overflow | |||||||
| 060418 | 1.49 | ||||||||
| 070508 | 0.82 | ||||||||
| 070508 | 0.82 | ||||||||
| 071112C | 0.8227 | undef | |||||||
| 080319B | 0.9382 | ||||||||
| 080430 | - | ||||||||
| 080604 | 1.4171 | ||||||||
| 080605 | 1.6403 | ||||||||
| 080928 | 1.6919 | undef | |||||||
| 090424 | 0.544 |
| Candidates with probable excess emission: |
| GRB | Time | F-test M34 | (M4) | (M4,fixed) | ||
|---|---|---|---|---|---|---|
| 061021 | 0.3463 | |||||
| 061110A | 0.7578 | |||||
| 081109 | 0.9787 | |||||
| 090814A | 0.696 | |||||
| 090814A | 0.696 | |||||
| 100621A | 0.542 | |||||
| 100621A | 0.542 | |||||
| 110715A | 0.82 |
| Candidates with some caveats: |
| GRB | Time | F-test M34 | (M4) | (M4,fixed) | ||
|---|---|---|---|---|---|---|
| 060202 | 0.783 | |||||
| 060202 | 0.783 | |||||
| 061121 | 1.3145 |
| Candidates where a black body component is not favoured: |
| GRB | Time | F-test M34 | (M4) | (M4,fixed) | ||
|---|---|---|---|---|---|---|
| 071112C | 0.8227 | undef | ||||
| 080604 | 1.4171 | |||||
| 090424 | 0.544 |
5 The final candidates and potential caveats
We will refer to the bursts in Table 4 as our final list of candidates for having a black body component. In this section we will discuss potential caveats for each candidate.
5.1 The Redshifts
It is essential that the redshift, which is a fixed parameter in all our models, is reliably determined. Table 5 summarizes how the redshift has been found for the bursts with excess emission. GRB 061021, GRB 090814A and GRB 110715 have redshifs found with only two absorption lines. It is however possible that these absorption lines comes from other galaxies than the host galaxy of the bursts. The remaining bursts have more reliably determined redshifts with several absorption and/or emission lines.
| GRB | Redshift | Absorption lines | Emission lines | References |
| 061021 | 0.3463 | Mg ii2796, Mg ii2803 | - | Fynbo et al. (2009). |
| 061110A | 0.7578 | Mg ii2796, Mg ii2803 | H, Oiii doublet | Fynbo et al. (2009). |
| 081109 | 0.9787 | - | GROND photometry | Krühler et al. (2011b). |
| 090814A | Mg ii and Ca ii | - | Jakobsson et al. (2009). | |
| 100621 | 0.542 | - | Oii 3727, H, Oiii doublet | Milvang-Jensen et al. (2010); Krühler et al. (2011b). |
| 110715A | 0.82 | Ca ii, Ca i | - | Piranomonte et al. (2011). |
5.2 Light curves and spectral evolution
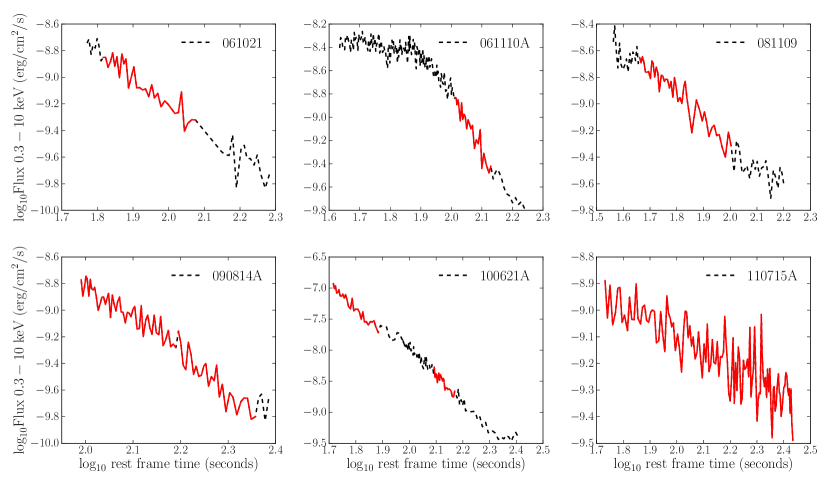
Figure 7 shows the parts of the light curves which were used in the time sliced analysis of the final candidates. We tried to avoid achromatic and X-ray flares and effects from flattening of the light curves, when the time intervals were selected, but we note that evolution of the spectral parameters, the power law index and/or the black body temperature and normalisation, may be occurring during any of our spectra. When analysing time sliced spectra this risk is lowered, and we examined the hardness ratios in the XRT Repository in order to flag incidences of strong spectral evolution. GRBs 061021, 061110A, 090814A and 110715A have approximately constant hardness ratios in the intervals where time sliced spectra were analysed. GRB 081109 shows a slowly hardening spectrum, while GRB 100621A becomes significantly softer during the first time slice but shows no spectral evolution during our second time slice. Therefore the parameters we derive in Table 6 for these latter two GRBs should be considered more uncertain than the error bars allow. Evolution of the black body component has been demonstrated for GRBs 060218 (e.g. Campana et al., 2006), 090618 (Page et al., 2011), 100316D (Starling et al., 2011; Olivares E. et al., 2012) and 101219B (Paper I), where the black body cools and expands with time, but typically this evolution is slow compared with the exposure times covered by our X-ray spectra.
5.3 Contribution from the prompt emission
It is important that the prompt emission, which has a spectrum peaking at the energy, , is not entering our X-ray spectrum for the Swift XRT ( keV), since this potentially could give features resembling black body components. Here is a summary of the measurement of for each burst:
061021
was measured to lie above 540 keV up to 8 seconds after the trigger (Golenetskii et al., 2006). This is well above XRT-energies.
061110A
No spectral break or cutoff was seen with Swift/BAT, so no information is present. The role of the prompt emission remains unknown for this burst.
090814A
No spectral break or cutoff was seen by Swift/BAT. The role of the prompt emission remains unknown for this burst.
081109
Fermi/GBM measured keV (von Kienlin, 2008) after 26 seconds. Our spectrum is well below that energy.
100621A
Konus-Wind fits their spectrum covering seconds with keV (Golenetskii et al., 2010). Our spectrum starts at 80 s, so probably the peak energy was still well above the XRT band.
110715A
18 seconds after trigger Konus-wind measured keV (Golenetskii et al., 2011), and BAT found keV (Ukwatta et al., 2011). It is unlikely, that this affects our XRT spectrum, which starts at 98 seconds.
| GRB | Radius (m) | (keV) | ( erg s-1) | ref | Time (s) | (s) | (erg) | |
| 061021 | 0.13 | this work | 46 | |||||
| 061110A | 0.19 | this work | 41 | |||||
| 081109 | 0.16 | this work | 190 | |||||
| 090814A | 0.30 | this work | 0.696 | 80 | ||||
| 090814A | 0.20 | this work | 0.696 | 80 | ||||
| 100621A | 0.25 | this work | 0.542 | 64 | ||||
| 110715A | 0.15 | this work | 0.82 | 13 | ||||
| 060218 | 0.20 | Campana et al. (2006) | 200 | 2100 | ||||
| 090618 | 1.00 | Page et al. (2011) | 150 | 113 | ||||
| 090618 | 0.20 | Page et al. (2011) | 250 | 113 | ||||
| 100316D | 0.3 | Starling et al. (2011) | 0.0591 | 250 | ||||
| 101219B | 0.20 | Paper I | 250 | 34 |
5.4 Is it a black body component?
The six bursts in our final candidate list (GRB 061021, GRB 061110A, GRB 081109, GRB 090814A, GRB 100621A and GRB 110715A) are clearly special, since models with a black body component included give better fits than absorbed power laws. We do, however, not have conclusive evidence that the actual emission mechanism is a black body component. Other possible explanations could be a model with multiple absorption components at different redshifts, the prompt emission peak could be moving through the band, there could be strong spectral evolution, or the determined redshift could be wrong. We have a total of 190 bursts in our sample, so some of them will likely be affected by such features. Due to these caveats we will not report discovery of black body emission, but instead we will report the finding of bursts with possible black body emission.
6 Properties of the black body components
In this section, we will assume, that the actual mechanism behind the excess emission in the spectra of the six bursts is a single temperature black body component. Table 6 shows radius (assuming spherical symmetry) and temperature for these bursts together with values reported in other studies. For our final candidates the radii are calculated from the fitted temperature and luminosity. In the calculation we assume a spherically symmetric black body, in thermal equilibrium, which can be described by the Stefan-Boltzmann law,
| (1) |
Also note that the luminosities and radii in the table are lower limits, since only the photons in a keV are included in the luminosity calculation. Due to these caveats, the values in the table should be seen as rough estimates only.
The bursts have temperatures in the range, keV, which is consistent with the previously proposed black body components in the time-averaged WT spectra of GRB 060218, 090618, 100316D and 101219B. They also have luminosities consistent with these previously studied bursts, whereas the radii are sligthly larger for GRB 061110A, 081109 and 110715A than the previously claimed examples.
In the case of GRB 060218 several studies (Ghisellini et al., 2007a, b; Chevalier & Fransson, 2008; Li, 2007) disfavour the scenario that the excess emission is due to a black body component, since they can not explain the large black body luminosities. All our bursts with possible black body emission have a luminosity larger than GRB 060218 (Table 6), so they might suffer from a similar problem.
All the bursts have durations () between 13 and 190 seconds, which is typical for long bursts. The redshifts are in the range, , so they are slightly more distant than the cases reported in other studies ().
6.1 The fraction of bursts with black body components
In the Model 1 to 2 comparison we found three new candidates (GRB 061021, 061110A, 090814A) and we re-discovered GRB 060218, 090618, 101219B. So we found a black body component in 6 out of the 116 bursts (i.e. 5%) with successful fits.
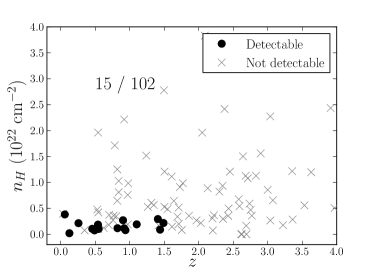
We will now shed light on the fraction of Swift bursts for which it is possible to recover a black body component like the one in GRB 101219B. In Section 3 it was found that such a black body component can be detected (with the F-test comparison of Model 1 and 2) if , cm-2 and the logarithm of the powerlaw normalisation is below (see Figure See Figure 1, 2 and 3). Figure 8 shows versus for all the bursts in our sample with successful fits. It is marked whether a bursts passes these detection criteria. We see that in 15 , 15 out of 102 bursts, a detection will be possible. This calculation is, of course, only a rough estimate. The X-ray black body components need not all be like the one in GRB 101219B, and the limits we have used on , , and power law normalisation are expected to be degenerate with each other. This calculation is, however, sufficient to establish that black body components only are detectable in a fraction of the bursts, even if such a black body component is present in all GRBs.
None of the new candidates found in this work have a optically confirmed SN. Note, however, that we excluded bursts which already are discussed in other works, including Paper I where several bursts with associated SNe are analysed.
7 Conclusion
We have first examined under which conditions a black body component, like the one proposed to be in GRB 101219B, can be recovered. At high redshift and in environments with intermediate or high column densities a detection of such a component will not be possible. We also find that it will be hard to recover a black body component, when a bright afterglow emission is present. We show that detection of a black body component only will be possible in a small fraction of all GRBs in our sample.
We have searched for black body components in all the Swift bursts with known redshift and created a list of bursts with possible black body components (GRB 061021, 061110A, 081109, 090814A, 100621A and 110715A). They have temperatures, radii and luminosities similar to those found in previous studies of black body components in GRBs.
Acknowledgments
We wish to thank J.P.U. Fynbo for commenting on the paper. This work was made possible through a University of Leicester College of Science Fellowship Support Scheme. The Dark Cosmology Centre is funded by the Danish National Research Foundation. RLCS acknowledges support from a Royal Society Fellowship.
References
- Barthelmy et al. (2005) Barthelmy S. D., et al., 2005, Nature, 438, 994
- Burrows et al. (2005) Burrows D. N., et al., 2005, SSRv, 120, 165
- Butler (2007) Butler N. R., 2007, ApJ, 656, 1001
- Campana et al. (2006) Campana S., et al., 2006, Nature, 442, 1008
- Cano et al. (2011) Cano Z., et al., 2011, MNRAS, 413, 669
- Cash (1979) Cash W., 1979, ApJ, 228, 939
- Chevalier & Fransson (2008) Chevalier R. A., Fransson C., 2008, ApJ, 683, L135
- Cobb et al. (2010) Cobb B. E., Bloom J. S., Perley D. A., Morgan A. N., Cenko S. B., Filippenko A. V., 2010, ApJ, 718, L150
- Cucchiara et al. (2011) Cucchiara A., et al., 2011, ApJ, 736, 7
- de Ugarte Postigo et al. (2011) de Ugarte Postigo A., et al., 2011, GRB Coordinates Network, 11579, 1
- Evans et al. (2009) Evans P. A., et al., 2009, MNRAS, 397, 1177
- Fynbo et al. (2009) Fynbo J. P. U., et al., 2009, ApJS, 185, 526
- Galama et al. (1998) Galama T. J., et al., 1998, Nature, 395, 670
- Ghisellini et al. (2007a) Ghisellini G., Ghirlanda G., Tavecchio F., 2007a, MNRAS, 382, L77
- Ghisellini et al. (2007b) Ghisellini G., Ghirlanda G., Tavecchio F., 2007b, MNRAS, 375, L36
- Golenetskii et al. (2006) Golenetskii S., Aptekar R., Mazets E., Pal’Shin V., Frederiks D., Cline T., 2006, GRB Coordinates Network, 5748, 1
- Golenetskii et al. (2010) Golenetskii S., et al., 2010, GRB Coordinates Network, 10882, 1
- Golenetskii et al. (2011) Golenetskii S., et al., 2011, GRB Coordinates Network, 12166, 1
- Hjorth & Bloom (2011) Hjorth J., Bloom J. S., 2011, ArXiv e-prints astroph/1104.2274
- Hjorth et al. (2003) Hjorth J., et al., 2003, Nature, 423, 847
- Jakobsson et al. (2009) Jakobsson P., et al., 2009, GRB Coordinates Network, 9797, 1
- Kalberla et al. (2005) Kalberla P. M. W., Burton W. B., Hartmann D., Arnal E. M., Bajaja E., Morras R., Pöppel W. G. L., 2005, A&A, 440, 775
- Kouveliotou et al. (1993) Kouveliotou C., Meegan C. A., Fishman G. J., Bhat N. P., Briggs M. S., Koshut T. M., Paciesas W. S., Pendleton G. N., 1993, ApJ, 413, L101
- Krühler et al. (2011a) Krühler T., et al., 2011a, A&A, 526, A153
- Krühler et al. (2011b) Krühler T., et al., 2011b, A&A, 534, A108
- Lampton et al. (1976) Lampton M., Margon B., Bowyer S., 1976, ApJ, 208, 177
- Li (2007) Li L.-X., 2007, MNRAS, 375, 240
- Lipkin et al. (2004) Lipkin Y. M., et al., 2004, ApJ, 606, 381
- Mazzali et al. (2006) Mazzali P. A., Deng J., Nomoto K., Sauer D. N., Pian E., Tominaga N., Tanaka M., Maeda K., Filippenko A. V., 2006, Nature, 442, 1018
- Milvang-Jensen et al. (2010) Milvang-Jensen B., et al., 2010, GRB Coordinates Network, 10876, 1
- Olivares E. et al. (2012) Olivares E. F., et al., 2012, A&A, 539, A76
- Page et al. (2011) Page K. L., Starling R. L. C., Fitzpatrick G., Pandey S. B., Osborne J. P., et al., 2011, MNRAS, 416, 2078
- Patat et al. (2001) Patat F., et al., 2001, ApJ, 555, 900
- Pian et al. (2006) Pian E., et al., 2006, Nature, 442, 1011
- Piranomonte et al. (2011) Piranomonte S., Vergani S. D., Malesani D., Fynbo J. P. U., Wiersema K., Kaper L., 2011, GRB Coordinates Network, 12164, 1
- Protassov et al. (2002) Protassov R., van Dyk D. A., Connors A., Kashyap V. L., Siemiginowska A., 2002, ApJ, 571, 545
- Salvaterra et al. (2009) Salvaterra R., et al., 2009, Nature, 461, 1258
- Soderberg et al. (2006) Soderberg A. M., et al., 2006, Nature, 442, 1014
- Sparre et al. (2011) Sparre M., et al., 2011, ApJ, 735, L24
- Starling et al. (2011) Starling R. L. C., et al., 2011, MNRAS, 411, 2792
- Starling et al. (2012) Starling R. L. C., et al., 2012, ArXiv e-prints, astroph/1207.1444
- Starling et al. (2012) Starling R. L. C., Page K. L., M. Sparre 2012, Accepted to the proceedings of IAU 279 ’Death of massive stars: supernovae and gamma-ray bursts’
- Tanvir et al. (2009) Tanvir N. R., et al., 2009, Nature, 461, 1254
- Ukwatta et al. (2011) Ukwatta T. N., et al., 2011, GRB Coordinates Network, 12160, 1
- Verner et al. (1996) Verner D. A., Ferland G. J., Korista K. T., Yakovlev D. G., 1996, ApJ, 465, 487
- von Kienlin (2008) von Kienlin A., 2008, GRB Coordinates Network, 8505, 1
- Waxman et al. (2007) Waxman E., Mészáros P., Campana S., 2007, ApJ, 667, 351
- Wilms et al. (2000) Wilms J., Allen A., McCray R., 2000, ApJ, 542, 914
.