Uppaal-smc:
Statistical Model Checking for Priced Timed Automata
††thanks:
The paper is supported by VKR Centre of Excellence – MT-LAB and the
IDEA4CPS center established on a grant from Danish National Research
Foundation
Abstract
This paper offers a survey of Uppaal-smc, a major extension of the real-time verification tool Uppaal. Uppaal-smc allows for the efficient analysis of performance properties of networks of priced timed automata under a natural stochastic semantics. In particular, Uppaal-smc relies on a series of extensions of the statistical model checking approach generalized to handle real-time systems and estimate undecidable problems. Uppaal-smc comes together with a friendly user interface that allows a user to specify complex problems in an efficient manner as well as to get feedback in the form of probability distributions and compare probabilities to analyze performance aspects of systems. The focus of the survey is on the evolution of the tool – including modeling and specification formalisms as well as techniques applied – together with applications of the tool to case studies.
1 Introduction
Quantitative properties of stochastic systems are usually specified in logics that allow one to compare the measure of executions satisfying certain temporal properties with thresholds. The model checking problem for stochastic systems with respect to such logics is typically solved by a numerical approach [4, 15] that iteratively computes (or approximates) the exact measure of paths satisfying relevant sub-formulas; the algorithms themselves depend on the class of systems being analyzed as well as the logic used for specifying the properties.
Another approach to solve the model checking problem is to simulate the system for finitely many runs, and use hypothesis testing to infer whether the samples provide a statistical evidence for the satisfaction or violation of the specification [41]. The crux of this approach is that since sample runs of a stochastic system are drawn according to the distribution defined by the system, they can be used to get estimates of the probability measure on executions. Those techniques, also called Statistical Model Checking techniques (SMC) [27, 37, 41, 36], can be seen as a trade-off between testing and formal verification. In fact, SMC is very similar to Monte Carlo used in industry, but it relies on a formal model of the system. The core idea of SMC is to monitor a number of simulations of a system whose behaviors depend on a stochastic semantic. Then, one uses the results of statistics (e.g. sequential hypothesis testing or Monte Carlo) together with the simulations to get an overall estimate of the probability that the system will behave in some manner. While the idea resembles the one of classical Monte Carlo simulation, it is based on a formal semantic of systems that allows us to reason on very complex behavioral properties of systems (hence the terminology). This includes classical reachability properties such as “can I reach such a state?”, but also non trivial properties such as “can I reach this state x times in less than y units of time?”. Of course, in contrast with an exhaustive approach, such a simulation-based solution does not guarantee a result with 100% confidence. However, it is possible to bound the probability of making an error. Simulation-based methods are known to be far less memory and time intensive than exhaustive ones, and are sometimes the only option [42, 28].
Statistical model checking is now widely accepted in various research areas such as software engineering, in particular for industrial applications [6, 34, 19], or even for solving problems originating from systems biology [18, 30]. There are several reasons for this success. First, SMC is very simple to understand, implement, and use. Second, it does not require extra modeling or specification effort, but simply an operational model of the system, that can be simulated and checked against state-based properties. Third, it allows us to verify properties [16, 17, 6] that cannot be expressed in classical temporal logics. Finally, SMC allows to approximate undecidable problems. This latter observation is crucial. Indeed most of emerging problems such as energy consumption are undecidable [25, 10] and can hence only be estimated. SMC has been applied to a wide range of problems that goes from embedded systems[16] and systems biology [16, 17] to more industrial applications [6].
In a series of recent works [23, 14, 22], we have investigated the problem of Statistical Model Checking for networks of Priced Timed Automata (PTA). PTAs are timed automata, whose clocks can evolve with different rates, while111in contrast to the usual restriction of priced timed automata [8, 3] being used with no restrictions in guards and invariants. In [22], we have proposed a natural stochastic semantic for such automata, which allows to perform statistical model checking. Our work has later been implemented in Uppaal-smc, that is a stochastic and statistical model checking extension of Uppaal. Uppaal-smc relies on a series of extensions of the statistical model checking approach generalized to handle real-time systems and estimate undecidable problems. Uppaal-smc comes together with a friendly user interface that allows a user to specify complex problems in an efficient manner as well as to get feedback in the form of probability distributions and compare probabilities to analyze performance aspects of systems.
The objective of this paper is to offer a survey of Uppaal-smc. This includes modeling and specification formalism as well as techniques applied – together with applications of the tool to case studies.
Structure of the paper
In Section 2, we introduce the formalism of networks of Priced timed automata. Section 3 provides an overview of some existing statistical model checking algorithms, while Sections 4 and 5 introduce the GUI and give some details on the engine of Uppaal-smc. Finally, Section 6 presents a series of applications for the tool-set and Section 7 concludes the paper.
2 Modeling Formalism
The new engine of Uppaal-smc [23] supports the analysis of Priced Timed Automata (PTAs) that are timed automata whose clocks can evolve with different rates in different locations. In fact, the expressive power (up to timed bisimilarity) of NPTA equals that of general linear hybrid automata (LHA) [2], rendering most problems – including that of reachability – undecidable. We also assume PTAs are input-enabled, deterministic (with a probability measure defined on the sets of successors), and non-zeno. PTAs communicate via broadcast channels and shared variables to generate Networks of Price Timed Automata (NPTA).
 |
 |
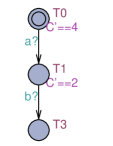 |
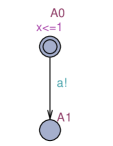
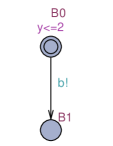
Fig. 1 provides an NPTA with three components , ,
and as specified using the Uppaal GUI. One can easily see that
the composite system has the transition sequence:
demonstrating that the final location of is reachable.
In fact, location is reachable within cost to and within
total time and in depending on when (and in which
order) and choose to perform the output actions and
. Assuming that the choice of these time-delays is governed by
probability distributions, a measure on sets of runs of NPTAs is
induced, according to which quantitative properties such as
“the probability of being reached within a total
cost-bound of 4.3” become well-defined.
In our early works [22], we provide a natural stochastic semantics, where PTA components associate probability distributions to both the time-delays spent in a given state as well as to the transition between states. In Uppaal-smc uniform distributions are applied for bounded delays and exponential distributions for the case where a component can remain indefinitely in a state. In a network of PTAs the components repeatedly race against each other, i.e. they independently and stochastically decide on their own how much to delay before outputting, with the “winner” being the component that chooses the minimum delay. For instance, in the NPTA of Fig. 1, wins the initial race over with probability .
As observed in [22], though the stochastic semantic of each individual PTA in Uppaal-smc is rather simple (but quite realistic), arbitrarily complex stochastic behavior can be obtained by their composition when mixing individual distributions through message passing. The beauty of our model is that these distributions are naturally and automatically defined by the network of PTAs.
The Hammer Game
To illustrate the stochastic semantics further consider the network of two priced timed automata in Fig. 3 modeling a competition between the two players Axel and Alex both having to hammer three nails down. As can be seen by
| a) Axel | |
|---|---|
| b) Alex |
the representing Work-locations the time (-interval) and rate of energy-consumption required for hammering a nail depends on the player and the nail-number. As expected Axel is initially quite fast and uses a lot of energy but becomes slow towards the last nail, somewhat in contrast to Alex. To make it an interesting competition, there is only one hammer illustrated by repeated competitions between the two players in the Ready-locations, where the slowest player has to wait in the Idle-location until the faster player has finished hammering the next nail. Interestingly, despite the somewhat different strategy applied, the best- and worst-case completion times are identical for Axel and Alex: 59 seconds and 150 seconds. So, there is no difference between the two players and their strategy, or is there?
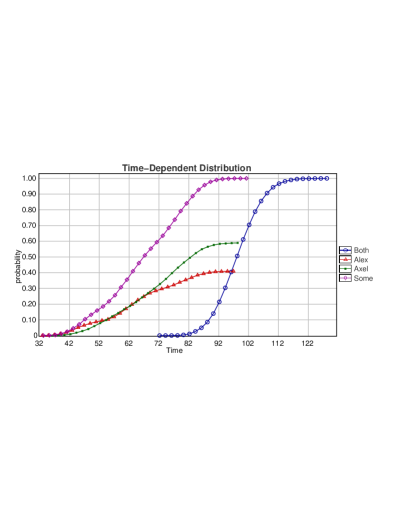
Assume now that a third person wants to bet on who is the more likely winner – Axel or Alex – given a refined semantics, where the time-delay before performing an output is chosen stochastically (e.g. by drawing from a uniform distribution) and independently by each player (component).
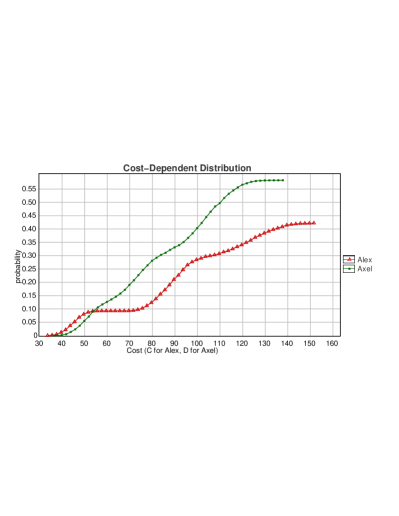
Under such a refined semantics there is a significant difference between the two players (Axel and Alex) in the Hammer Game. In Fig. 4a) the probability distributions for either of the two players winning before a certain time is given. Though it is clear that Axel has a higher probability of winning than Alex (59% versus 41%) given unbounded time, declaring the competition a draw if it has not finished before 50 seconds actually makes Alex the more likely winner. Similarly, Fig. 4b) illustrates the probability of either of the two players winning given an upper bound on energy. With an unlimited amount of energy, clearly Axel is the most likely winner, whereas limiting the consumption of energy to maximum 52 “energy-units” gives Alex an advantage.
 |
 |
| a) | b) |
Extended Input Language
Uppaal-smc takes as input NPTAs as described above. Additionally, there is support for other features of the Uppaal model checker’s input language such as integer variables, data structures and user-defined functions, which greatly ease modeling. Uppaal-smc allows the user to specify an arbitrary (integer) rate for the clocks on any location. In addition, the automata support branching edges where weights can be added to give a distribution on discrete transitions. It is important to note that rates and weights may be general expressions that depend on the states and not just simple constants.
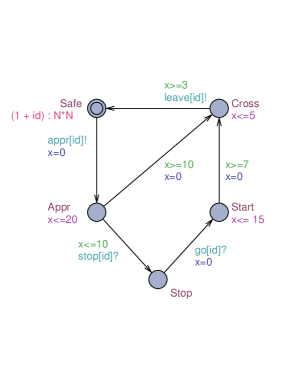
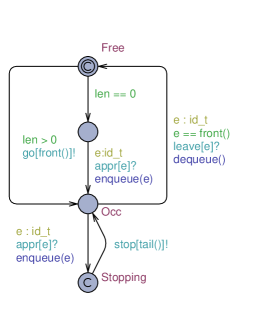
To illustrate the extended input language, we consider a train-gate example. This example is available in the distributed version of Uppaal-smc. A number of trains are approaching a bridge on which there is only one track. To avoid collisions, a controller stops the trains. It restarts them when possible to make sure that trains will eventually cross the bridge. There are timing constraints for stopping the trains modeling the fact that it is not possible to stop trains instantly. The interesting point w.r.t. SMC is to define the arrival rates of these trains. Figure 5(a) shows the template for a train. The location Safe has no invariant and defines the rate of the exponential distribution for delays. Trains delay according to this distribution and then approach and synchronize with appr[i]! with the gate controller. Here we define the rational where is the identifier of the train and the number of trains. Rates are given by expressions that can depend on the current states. Trains with higher arrive faster. Taking transitions from locations with invariants is given by a uniform distribution. This happens in Appr, Cross, and Start, e.g., it takes some time picked uniformly between 3 and 5 time units to cross the bridge. Figure 5(b) shows the gate controller that keeps track of the trains with an internal queue data-structure (not shown here). It uses functions to queue trains (when a train is approaching while the bridge is occupied in Occ) or dequeue them when possible (when the bridge is free and some train is queued).
 |
 |
| (a) | (b) |
Floating Point Arithmetic
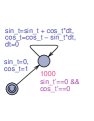
For modeling certain systems, e.g., biological systems, integer arithmetic shows its precision limits very quickly. The current engine implements simple arithmetic operations on clocks as floating point variables. This allows various tricks, in particular the tool can compute nontrivial functions using small step integration. For example, Figure 6(a) shows a timed automaton with floating point arithmetic.
 |
 |
 |
| (a) | (b) | (c) |
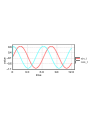
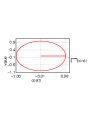
The clocks sin_t and cos_t are used to compute and using simple facts as for small steps of , whereas and , and similarly for . The interesting trick on the model is the high exponential rate (1000) that tells the engine to take small (random) time steps and record the duration in clock dt. The other clocks are stopped and updated on transition. The value evolution of variables sin_t and cos_t in terms of time are plotted in Figure 6(b). Figure 6(c) shows sin_t values with corresponding cos_t which form almost perfect circle. These plots are rendered using value monitoring features described in Section 4.
3 Properties and Queries
For specifying properties of NPTAs, we use weighted temporal properties over runs expressed in the logic [11] (Weighted Metric Temporal Logic), defined by the grammar , where is an atomic proposition, is a natural number and is a clock. Here, the logical operators are interpreted as usual, and O is a next state operator. An -formula is satisfied by a run if is satisfied on the run until is satisfied, and this will happen before the value of the clock increases with more than . For an NPTA we define to be the probability that a random run of satisfies .
The problem of checking () is unfortunately undecidable in general 222Exceptions being PTA with 0 or 1 clocks.. For the sub-logic of cost-bounded reachability problems , where is a state-predicate, is a clock and is bound, we approximate the answer using simulation-based algorithms known under the name of statistical model checking algorithms. We briefly recap statistical algorithms permitting to answer the following three types of questions:
-
1.
Hypothesis Testing: Is the probability for a given NPTA greater or equal to a certain threshold ?
-
2.
Probability evaluation: What is the probability for a given NPTA ?
-
3.
Probability comparison: Is the probability greater than the probability ?
From a conceptual point of view solving the above questions using SMC is simple. First, each run of the system is encoded as a Bernoulli random variable that is true if the run satisfies the property and false otherwise. Then a statistical algorithm groups the observations to answer the three questions. For the qualitative questions (1 and 3), we shall use sequential hypothesis testing, while for the quantitative question (2) we will use an estimation algorithm that resemble the classical Monte Carlo simulation. The two solutions are detailed hereafter.
Hypothesis Testing
This approach reduces the qualitative question to testing the hypothesis against . To bound the probability of making errors, we use strength parameters and and we test the hypothesis and with and . The interval defines an indifference region, and and are used as thresholds in the algorithm. The parameter is the probability of accepting when holds (false positives) and the parameter is the probability of accepting when holds (false negatives). The above test can be solved by using Wald’s sequential hypothesis testing [40]. This test computes a proportion among those runs that satisfy the property. With probability 1, the value of the proportion will eventually cross or and one of the two hypothesis will be selected. In Uppaal-smc we use the following query: Pr[]()>=, where defines how to bound the runs. The three ways to bound them are 1) implicitly by time by specifying <= (where M is a positive integer), 2) explicitly by cost with <= where is a specific clock, or 3) by number of discrete steps with #<=. In the case of hypothesis testing is the probability to test for. The formula is either <> or [] where is a state predicate.
Probability Estimation
This algorithm [27] computes the number of runs needed in order to produce an approximation interval for with a confidence . The values of and are chosen by the user and the number of runs relies on the Chernoff-Hoeffding bound. In Uppaal-smc we use the following query: Pr[]()
Probability Comparison
This algorithm, which is detailed in [22], exploits an extended Wald testing. In Uppaal-smc, we use the following query: Pr[]()>= Pr[]().
In addition to those three classical tests, Uppaal-smc also supports the evaluation of expected values of min or max of an expression that evaluates to a clock or an integer value. The syntax is as follows: E[](min:) or E[](max:), where is as explained in this section, gives the number of runs explicitly, and is the expression to evaluate. For this property, no confidence is given (yet).
Full
Regarding implementation, the reader shall observe that both of the above statistical algorithms are trivially implementable. To support the full logic of is slightly more complex as our simulation engine needs to rely on monitors for such logic. In [11], we proposed an extension of Uppaal-smc that can handle arbitrary formulas of . Given a property , our implementation first constructs deterministic under- and over-approximation monitoring PTAs for . Then it puts these monitors in parallel with a given model , and applies SMC-based algorithms to bound the probability that is satisfied on .
4 Graphical User Interface
Besides short ’yes’ or ’no’ answers and probability estimates, Uppaal-smc verifier also provides a few statistical measures in terms of time (or cost), including frequency histogram, average time (or cost), probability density distribution, cumulative probability distribution (the last two with confidence intervals, e.g. using the Clopper-Pearson method [20]).
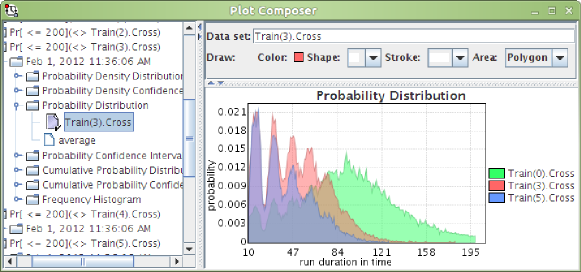
These statistical data can also be superposed onto a single plot for comparison purposes using the plot composer tool. Figure 7 shows the superposed probability distributions of trains 0, 3 and 5 crossing from our train-gate example. On the left side of the plot composer window the user can select a particular data to be added to the plot and on the right side the user can see the superposed plot and can also change some details such as labels, shapes and colors.
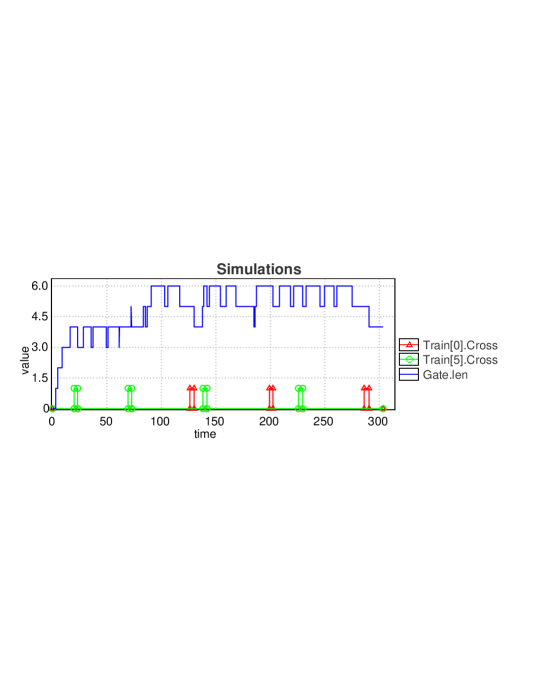
Monitoring Expressions
Uppaal-smc now allows the user to visualize the values of expressions (evaluating to integers or clocks) along runs. This gives insight to the user on the behavior of the system so that more interesting properties can be asked to the model-checker. To demonstrate this on our previous train-gate example, we can monitor when Train(0) and Train(5) are crossing as well as the length of the queue. The query is simulate 1 [<=300]{Train(0).Cross,Train(5).Cross,Gate.len}. This gives us the plot of Figure 8. Interestingly Train(5) crosses more often (since it has a higher arrival rate). Secondly, it seems unlikely that the gate length drops below 3 after some time (say 20), which is not an obvious property from the model. We can confirm this by asking Pr[<=300](<> Gate.len < 3 and t > 20) and adding a clock t. The probability is in .
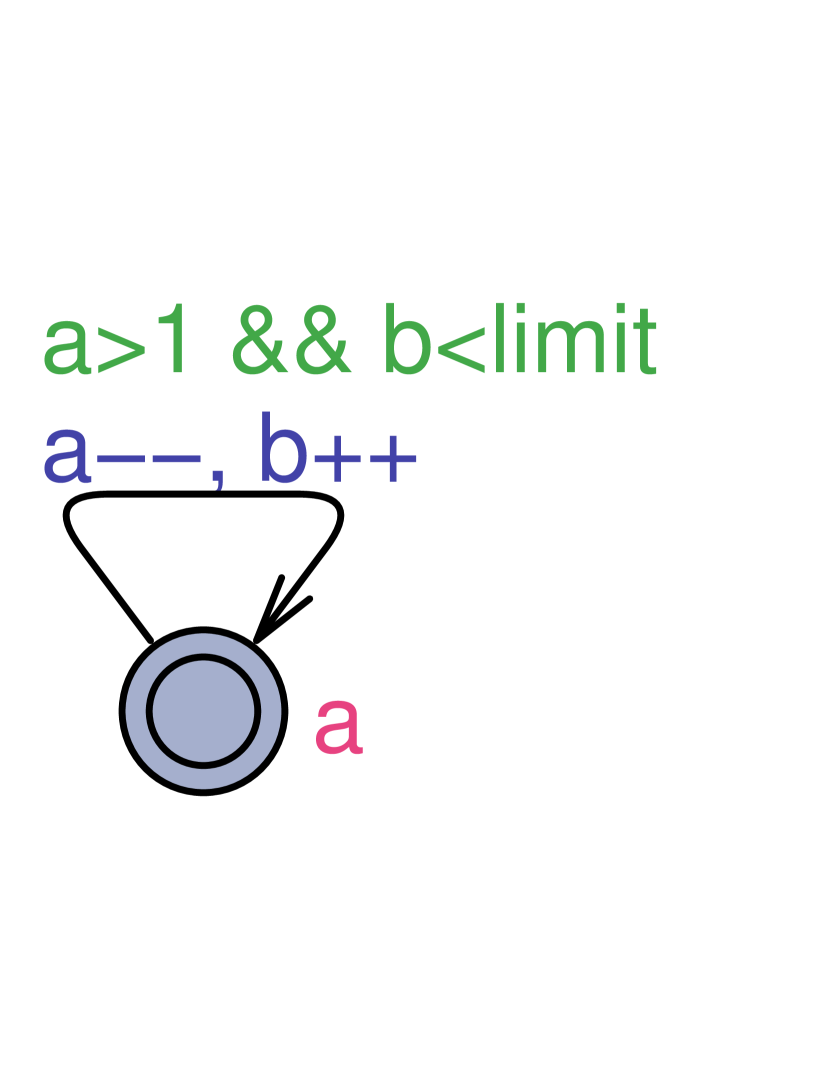
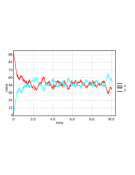
As a second example to illustrate this feature, we consider the modeling of chemical reactions. Figure 9(a) and 9(b) show two symmetric timed automata that model the concentrations of reactants a and b (here as integers). The exponential rate for taking the transition is given by the concentration of a and b. Figure 9(c) shows the evolution of the system when it is started with a=99 and b=1: a is consumed to produce b and vice-versa, and the concentrations oscillate.
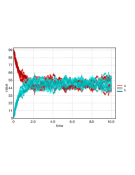
The simulations are obtained by querying simulate 1 [<=10]{a,b}. Figure 9(c) is showing one evolution of a and b over time. The tool can also plot clouds of trajectories, which is useful to identify patterns in the behavior, as shown in figure 9(d).
 (a)
(a)
|
 |
 |
|---|---|---|
| (b) | (c) | (d) |
It is important to notice that generating such curves is not as trivial as it seems. In fact, on such models, if the exponential rates are higher, then the time steps are much smaller, which generates a lot of points, up to consuming several GB of memory. Drawing such plots is not practical. The tool would not work due to out-of-memory problems or in the best case will take around 30s to transfer the data and several seconds for every redraw. To solve this the engine applies an on-the-fly filtering of the points based on the principle that if two points are too close to each other to be distinguished on the screen, then they are considered to be the same. A resolution parameter is used to define the maximal resolution of the plot and eliminates the memory and speed problems completely (down to almost not measurable).
5 Engine
The actual techniques to achieve the current performance of the tool were never exposed before. In this section, we present a few key optimizations to implement the algorithms presented and new features that were not available in earlier versions of Uppaal-smc.
Distributed SMC
The problem in distributing the implementation of the sequential SMC algorithm is that a bias may be introduced. The reason is that sequential testing relies on collecting outcomes of the generated runs on-the-fly. If some computation cores generate some accepting runs faster, which is possible if rejecting runs happen to be longer or simply more expensive to compute, then the result will be biased. The solution of this problem is to force all the cores to generate the same amount of simulations. The paper [41] proposes a method to ensure this by splitting the simulations into batches of the same size, and this method has been generalized and implemented in Uppaal-smc [14]. The distributed implementation gives a linear speed-up in the number of cores used.
Detection of States
When choosing the delays, the engine does not know if it will skip the state that should be observed by the query or not. This problem is present when picking delays to take transitions as well. For example, the query could be <> A.critical and x >= 2 and x <= 3 where x is a clock. The engine should not delay 4 time units from a state where x=0 because the first possible transition is enabled at this point. Special care is taken to make sure that the formula is part of the next interesting points that are computed when choosing the delays. Now comes the question of how to detect those interesting points in both the formula and the guards.
The technique we use follows the decorator pattern where we evaluate guards (for detecting which transitions will be enabled in the future) and formulas in the query to keep track of the lower bounds. We wrap a state inside a decorator state that keeps track of the constraints on-the-fly, only remembering the bounds that we need. The point of the technique here is to avoid symbolic states that would require zones typically implemented with different bound matrices.
Early Termination
The engine checks for query on-the-fly on every generated run. If a query is satisfied then the computation of the run is stopped before it reaches the specified bound. In addition, in order to give the user a way to stop runs earlier, the engine supports an until property: p U q can be queried instead of <> q and cut the runs as soon as p stops to hold.
Dependencies and Reuse of Choice
When a process takes an action, it may not affect other processes, which means that from a stochastic point-of-view, picking a new delay from scratch or reusing the old (random) choice is equivalent. The engine exploits this independence: it remembers the previous delays chosen by the processes and invalidates them when dependent transitions are taken. A process has its delay invalidated if there is a dependency with another transition being taken, which happens in case of synchronization or a dependency through a clock rate, invariant, guard, or update. A static analysis is made at the granularity of how transitions affect processes333We judge that keeping track of the dependencies down to the locations may have a too large overhead..
The result is that whenever a process needs to pick a delay, it does so. Whenever a process takes a transition, the processes that may be affected by it must pick a new delay at the next step. Otherwise, processes reuse their choices from the previous step in the simulation444If time elapses then of course the delays chosen are updated..
Checking the query Pr[<=300](<> Train(0).Cross and (forall (i:id_t) i!=0 imply
| Trains | 5 | 10 | 20 | 40 |
|---|---|---|---|---|
| Proba. | 0.985-0.995 | 0.286-0.297 | 0-0.008 | 0-0.005 |
| Time- | 3.9s | 17.3s | 41.1s | 98.1s |
| Time+ | 3.5s | 14.8s | 33.2s | 74.8s |
| Gain | 10.2% | 14.4% | 19.2% | 23.8% |
Train(i).Stop)) to evaluate the probability of Train(0) crossing while all the others are stopped gives the results in Table 1 for different numbers of trains. The results are obtained with the parameter and the probability results agree with or without reuse within . The experiments are made on a core i7 at 2.66GHz. This optimization is designed to improve on systems with large number of components, which is shown by the increasing improvement relative to verifications without reuse.
6 Case-Studies
In this section we evaluate the applicability of the developed techniques on practical case studies.
Robot Control
In paper [11] we considered a case – explored in [5] – of a robot moving on a two-dimensional grid. Each field of the grid is either normal, on fire, cold as ice or it is a wall which cannot be passed. Also, there is a goal field that the robot must reach. The robot is moving in a random fashion i.e. it stays in a field for some time, and then moves to a neighboring field at random (if it is not a wall).
We are interested in the probability that the robot reaches its goal location without staying on consecutive fire fields for more than one time unit and on consecutive ice fields for more than two time units. This property is captured by the formula , where is a special clock that grows with rate and is never reset, and:
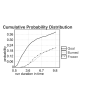
We applied Uppaal-smc to compute the probability of the robot reaching the goal , staying too long in the fire or too long on the ice. Figure 10 shows the cumulative distribution for these probabilities.
Firewire.
IEEE 1394 High Performance Serial Bus or Firewire for short is used to transport multimedia signals among a network of consumer devices. The protocol has been extensively studied (see [38] for comparison) and in particular [32] uses probabilistic timed automata in Prism [31]. In paper [23] we adopt the model from [32] and demonstrate how Uppaal-smc can be used to evaluate fairness of a node becoming a root (leader) with respect to the mode of operation.
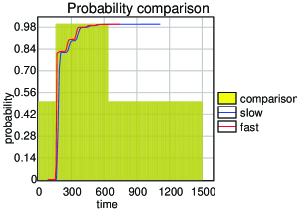
Uppaal-smc provides two methods for comparing probabilities: estimating the probabilities and then comparing them, or using indirect probability comparison from [40], which is more efficient. Figure 11 contains a resulting plot of estimated probabilities (red and blue lines) and a comparison (yellow area). The red and blue probability estimates appear very close to each other in entire range, while the yellow area shows that at the beginning the probabilities are indistinguishable (yellow area is at 0.5 level), then the fast node has higher probability to become a root (at 1.0 level), and later the probabilities become too close to be distinguishable again (at 0.5 level).
Bluetooth [35]
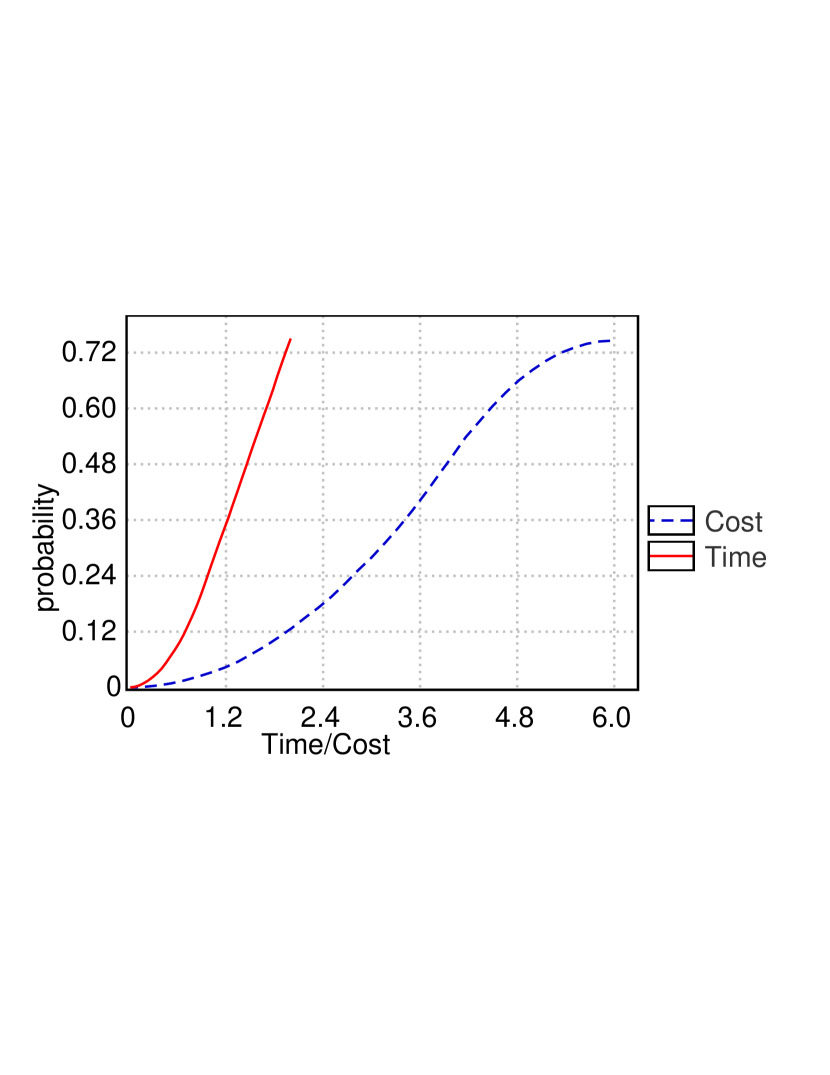
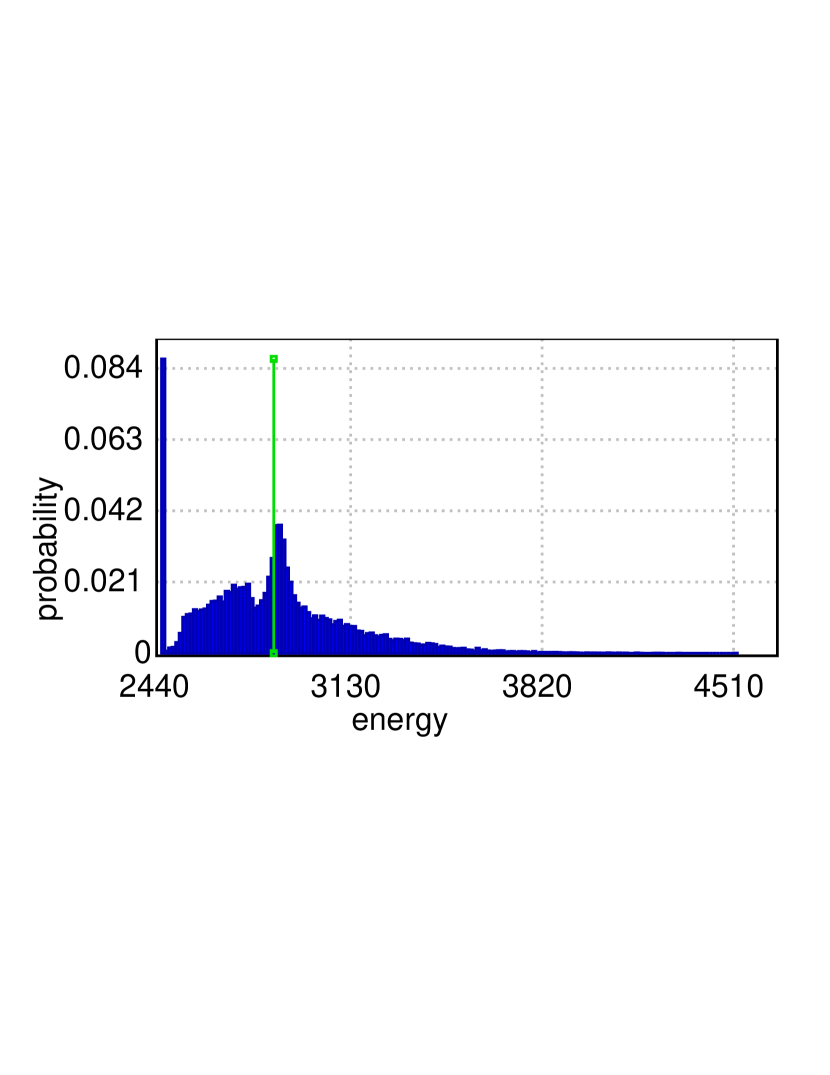
is a wireless telecommunication protocol using frequency-hopping to cope with interference between the devices in the wireless network. In paper [23] we adopted the model from [24], annotated the model to record the power utilization and evaluated the probability distributions of likely response times and energy consumption. Figure 12 shows that after 70s the cost of a device operation is at least energy units and the mean is about energy units.
Lightweight Medium Access Protocol (LMAC) [39]
is a communication scheduling protocol based on time slot distribution for nodes sharing the same medium. The protocol is designed having wireless sensor networks in mind: it is simple enough to fit on a modest hardware and at the same time robust against topology reconfiguration, minimizing collisions and power consumption. Paper [26] studies LMAC protocol using classical Uppaal verification techniques by systematically exploring networks of up to five nodes but the state space explosion prevents formal verification of larger networks. In paper [22] we adopt the model by removing verification optimizations and parameterizing with probabilistic weights, and show how collisions can be analyzed and power consumption estimated using statistical model checking techniques. The study showed that there are still perpetual collisions in a ring topology
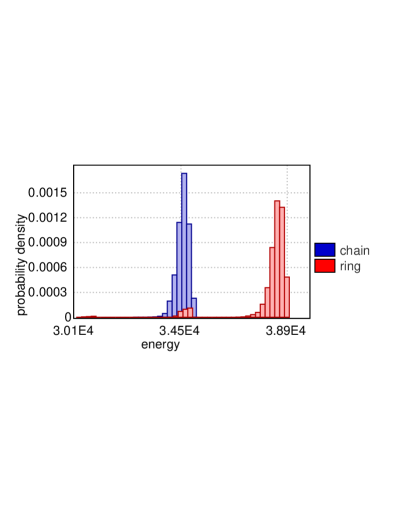
but the probability that the network will not recover is very low (0.35%). The likely energy consumption of different network topologies is compared in Uppaal plot (Figure 13), which shows that on average the likely energy consumption after 1000 time units in a ring is higher than in a chain by , possibly due to more collisions in a ring. In [14] distributed techniques are applied in exploring over 10000 larger networks of up to 10 nodes, the worst (star-like) and the best (chain-like) topologies in terms of collisions are identified and evaluated.
Computing Nash Equilibrium in Wireless Ad Hoc Networks
One of the important aspects in designing wireless ad-hoc networks is to make sure that a network is robust to the selfish behavior of its participants, i.e. that its configuration satisfies Nash equilibrium (NE).
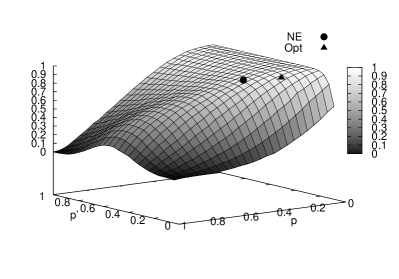
In paper [12] we proposed an SMC-based algorithm for computing NE for the case when network nodes are modeled by SPTA and an utility function of a single node is equal to a probability that the node will reach its goal. Our algorithm consists of two phases. First, we use Uppaal-smc to find a strategy that most likely (heuristic) satisfies NE. In the second phase we apply statistics to test the hypothesis that this strategy actually satisfies NE.
We applied this algorithm to compute NE for Aloha CSMA/CD and IEEE 802.15.4 CSMA/CA protocols. Figure 14 depicts the utility function plot for the Aloha CSMA/CD protocol with two nodes. Here the and axis correspond to the strategies of the honest and cheater nodes (a strategy defines how persistent these nodes are in sending their data). We see, that NE strategy is slightly less efficient than the symmetric optimal strategy (Opt), but it still results in a high value of the utility function.
Duration Probabilistic Automata

In [21] we compared Uppaal-smc to Prism [31] in the context of Duration Probabilistic Automata (DPA) [33]. A Duration Probabilistic Automaton (DPA) is a composition of Simple Duration Probabilistic Automata (SDPA). An SDPA is a linear sequence of tasks that must be performed in a sequential order.
| Param. | Estim. | Hyp. Testing | ||||||||
| Prism | Prism | |||||||||
| 4 | 4 | 3 | 2.7 | 0.3 | 0.2 | 0.2 | 2.0 | 0.1 | 0.1 | 0.1 |
| 6 | 6 | 3 | 7.7 | 0.6 | 0.5 | 0.4 | 3.9 | 0.2 | 0.2 | 0.3 |
| 8 | 8 | 3 | 26.5 | 1.2 | 0.9 | 0.7 | 16.4 | 0.5 | 0.4 | 0.3 |
| 20 | 40 | 20 | 300 | 300 | 35.5 | 26.2 | 20.7 | |||
| 30 | 40 | 20 | 300 | 300 | 61.2 | 41.8 | 33.2 | |||
| 40 | 40 | 20 | 300 | 300 | 92.2 | 56.9 | 59.5 | |||
| 40 | 20 | 20 | 300 | 300 | 41.1 | 31.2 | 26.5 | |||
| 40 | 30 | 20 | 300 | 300 | 68.8 | 46.7 | 46.1 | |||
| 40 | 55 | 40 | 300 | 300 | 219.5 | |||||
Each task is associated with a duration interval which gives the possible durations of the task. The actual duration of the tasks is given by a uniform choice from this interval. To model races between the SDPAs we introduce resources to the model such that an SDPA might have to wait for resources before processing a task. When two SDPAs are in waiting position for the same resource, a scheduler decides which SDPA is given the resource in a deterministic manner.
The comparison with Prism was made by randomly generating models with a specific number of SDPAs and a specific number of tasks per SDPA and translate these into Prism and Uppaal models. The Prism model uses a discrete time semantics whereas three models were made for Uppaal- one with continuous time semantics, one that matches the Prism model as close as possible and one with discrete semantics that makes full use of our formalism.
The queries to the models were What is the probability of all SDPAs ending within time units (Estimation)and Is the probability that all SDPAs end within time units greater than (Hypothesis testing). The value of is different for each model as it was computed by simulating the system 369 times and represent the value for which at least of the runs finished all their tasks.
The result of the experiments are shown in Table 2 and indicates that Uppaal is notably faster than Prism, even with a encoding that closely matches that of Prism.
Checking of Distributed Statistical Model Checking
As we wrote in Section 5, a naive (and incorrect) distributed implementation of the sequential SMC algorithms might introduce a bias towards the results that are generated by shorter simulations.
The interesting question is how much this bias affects the SMC results.
In the paper [13] we answered this question by modeling the naive distributed SMC algorithm in Uppaal-smc itself.
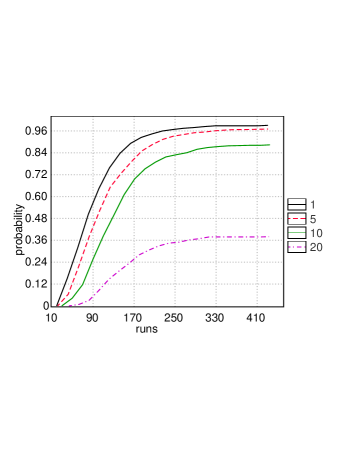
The comparison was made on the basis of the SPTA model that ends up in the OK location after time units with probability , otherwise it ends up in the NOK location after time unit (thus producing NOK requires times less time than producing OK).
We used Uppaal-smc to compute the probability that the naive distributed SMC algorithm will accept the hypothesis Pr[<=100]( OK) 0.5. The results for the different numbers of computational cores are given in the plot at Figure 16. The axis denotes the total number of runs of the SPTA model on all the cores, and the axis depicts the probability that an SMC algorithm accepts the hypothesis not later than after this number of runs. It can be observed that the probability of accepting the hypothesis tends (incorrectly) to as the number of computational cores increases.
7 Conclusions
This paper gives an overview of the features of Uppaal-smc, our new efficient extension of Uppaal for Statistical Model Checking. Contrary to other existing SMC-based tool-sets, Uppaal-smc allows to handle systems with real-time features. The tool has been applied to a series of case studies that are beyond the scope of classical model checkers. As has been outlined in this paper, Uppaal-smc has a large potential for future work and applications.
Among others, the following extensions of Uppaal-smc are contemplated.
Floating Point
So far the support of floating point is done via misusing and extending clock operations. A better and more general support is needed since the tool has now departed from traditional timed automata and model-checking.
Since the tool now supports floating point arithmetic and we can integrate complex functions, it is a natural extension to add differential equations as well to support hybrid systems in a more general way. To fit with the stochastic semantics (in particular how to pick delays), only simple equations whose analytical solutions are known are planned.
New Applications
With the extended expressivity of our hybrid modeling language, our tool can be applied to different domains, in particular for biological systems. Uppaal-smc now offers powerful visualization capabilities needed by biologists and a logic to do statistical model-checking.
Another application is to analyze performance of controllers generated by Uppaal-tiga [7], in particular their stability or energy consumption. SMC can also be used in the domain of refinement checking, which is in the end just another type of game.
Rare Events
Statistical model checking avoids the exponential growth of states associated with probabilistic model checking by estimating properties from multiple executions of a system and by giving results within confidence bounds. Rare properties are often very important but pose a particular challenge for simulation-based approaches, hence a key objective under these circumstances is to reduce the number and length of simulations necessary to produce a given level of confidence. Importance sampling is a well-established technique that achieves this, however to maintain the advantages of statistical model checking it is necessary to find good importance sampling distributions without considering the entire state space. Such problem has been recently investigated for the case of discrete stochastic systems. As an example, in [29] we presented a simple algorithm that uses the notion of cross-entropy to find the optimal parameters for an importance sampling distribution. Our Objective is to extend our results to PTAs by exploiting pure timed model checking to improve the search for efficient distribution.
References
- [1]
- [2] R. Alur, C. Courcoubetis, N. Halbwachs, T. A. Henzinger, P.-H. Ho, X. Nicollin, A. Olivero, J. Sifakis & S. Yovine (1995): The algorithmic analysis of hybrid systems. Theoretical Computer Science 138(1), pp. 3–34, 10.1016/0304-3975(94)00202-T.
- [3] Rajeev Alur, Salvatore La Torre & George J. Pappas (2001): Optimal Paths in Weighted Timed Automata. In Benedetto & Sangiovanni-Vincentelli [9], pp. 49–62, 10.1007/3-540-45351-2_8.
- [4] Christel Baier, Boudewijn R. Haverkort, Holger Hermanns & Joost-Pieter Katoen (2003): Model-Checking Algorithms for Continuous-Time Markov Chains. IEEE Trans. Software Eng. 29(6), pp. 524–541.
- [5] Benoît Barbot, Taolue Chen, Tingting Han, Joost-Pieter Katoen & Alexandru Mereacre (2011): Efficient CTMC Model Checking of Linear Real-Time Objectives. In ParoshAziz Abdulla & K.RustanM. Leino, editors: Tools and Algorithms for the Construction and Analysis of Systems, Lecture Notes in Computer Science 6605, Springer Berlin Heidelberg, pp. 128–142, 10.1007/978-3-642-19835-9_12.
- [6] A. Basu, S. Bensalem, M. Bozga, B. Caillaud, B. Delahaye & A. Legay (2010): Statistical Abstraction and Model-Checking of Large Heterogeneous Systems. In: FORTE, LNCS 6117, Springer, pp. 32–46, 10.1007/978-3-642-13464-7_4.
- [7] Gerd Behrmann, Agnès Cougnard, Alexandre David, Emmanuel Fleury, Kim G. Larsen & Didier Lime (2007): UPPAAL-Tiga: Time for Playing Games! In: CAV, LNCS 4590, Springer.
- [8] Gerd Behrmann, Ansgar Fehnker, Thomas Hune, Kim Guldstrand Larsen, Paul Pettersson, Judi Romijn & Frits W. Vaandrager (2001): Minimum-Cost Reachability for Priced Timed Automata. In Benedetto & Sangiovanni-Vincentelli [9], pp. 147–161, 10.1007/3-540-45351-2_15.
- [9] Maria Domenica Di Benedetto & Alberto L. Sangiovanni-Vincentelli, editors (2001): Hybrid Systems: Computation and Control, 4th International Workshop, HSCC 2001, Proceedings. LNCS 2034, Springer, 10.1007/3-540-45351-2.
- [10] Patricia Bouyer, Uli Fahrenberg, Kim G. Larsen & Nicolas Markey (2010): Timed automata with observers under energy constraints. In: HSCC, ACM ACM, pp. 61–70, 10.1145/1755952.1755963.
- [11] Peter Bulychev, Alexandre David, Kim G. Larsen, Axel Legay, Guangyuan Li, Danny Bøgsted Poulsen & Amelie Stainer (2012): Monitor-Based Statistical Model Checking for Weighted Metric Temporal Logic. In: LPAR-18, 7180, pp. 168–182, 10.1007/978-3-642-28717-6_15.
- [12] Peter Bulychev, Alexandre David, Kim G. Larsen, Axel Legay & Marius Mikučionis (2012): Computing Nash Equilibrium in Wireless Ad Hoc Networks: A Simulation-Based Approach. In: iWIGP, 78, pp. 1–14, 10.4204/EPTCS.78.1.
- [13] Peter Bulychev, Alexandre David, Kim G. Larsen, Axel Legay, Marius Mikučionis & Danny Bøgsted Poulsen (2012): Checking & Distributing Statistical Model Checking. In: NFM 2012 : Fourth NASA Formal Methods Symposium, 7226, pp. 449–463, 10.1007/978-3-642-28891-3_39.
- [14] Peter Bulychev, Alexandre David, Kim Guldstrand Larsen, Marius Mikučionis & Axel Legay (2011): Distributed Parametric and Statistical Model Checking. In Jiří Barnat & Keijo Heljanko, editors: Proceedings 10th International Workshop on Parallel and Distributed Methods in Verification, EPTCS, arxiv.org, pp. 30–42, 10.4204/EPTCS.72.
- [15] F. Ciesinski & M. Größer (2004): On Probabilistic Computation Tree Logic. In: Validation of Stochastic Systems, LNCS, 2925, Springer, pp. 147–188, 10.1007/978-3-540-24611-4_5.
- [16] E. M. Clarke, A. Donzé & A. Legay (2008): Statistical Model Checking of Mixed-Analog Circuits with an Application to a Third Order Delta-Sigma Modulator. In: Haifa Verification Days, LNCS 5394, Springer, pp. 149–163, 10.1007/978-3-642-01702-5_16.
- [17] E. M. Clarke, A. Donzé & A. Legay (2009): On Simulation-based Probabilistic Model Checking of Mixed-Analog Circuits. Formal Methods in System Design To appear.
- [18] E. M. Clarke, J. R. Faeder, C. James Langmead, L. A. Harris, S. K. Jha & A. Legay (2008): Statistical Model Checking in BioLab: Applications to the Automated Analysis of T-Cell Receptor Signaling Pathway. In: CMSB, LNCS 5307, Springer, pp. 231–250, 10.1007/978-3-540-88562-7_18.
- [19] Edmund M. Clarke & Paolo Zuliani (2011): Statistical Model Checking for Cyber-Physical Systems. In: ATVA, Lecture Notes in Computer Science 6996, Springer, pp. 1–12, 10.1007/978-3-642-24372-1_1.
- [20] C. J. Clopper & E. S. Pearson (1934): The Use of Confidence or Fiducial Limits Illustrated in the Case of the Binomial. Biometrika 26(4), pp. 404–413, 10.1093/biomet/26.4.404.
- [21] Alexandre David, Kim G. Larsen, Axel Legay, Marius Mikučionis, Danny Bøgsted Poulsen, Jonas Van Vliet & Zheng Wang (2011): Statistical model checking for networks of priced timed automata. In: Proceedings of the 9th international conference on Formal modeling and analysis of timed systems, FORMATS’11, Springer-Verlag, Berlin, Heidelberg, pp. 80–96, 10.1007/978-3-642-24310-3_7.
- [22] Alexandre David, Kim G. Larsen, Axel Legay, Marius Mikučionis, Danny Bøgsted Poulsen, Jonas van Vliet & Zheng Wang (2011): Statistical Model Checking for Networks of Priced Timed Automata. In Uli Fahrenberg & Stavros Tripakis, editors: Formal Modeling and Analysis of Timed Systems, LNCS 6919, springer, pp. 80–96, 10.1007/978-3-642-24310-3_7.
- [23] Alexandre David, Kim G. Larsen, Axel Legay, Marius Mikučionis & Zheng Wang (2011): Time for Statistical Model Checking of Real-Time Systems. In Ganesh Gopalakrishnan & Shaz Qadeer, editors: Computer Aided Verification, Lecture Notes in Computer Science 6806, Springer, pp. 349–355, 10.1007/978-3-642-22110-1_27.
- [24] Marie Duflot, Marta Kwiatkowska, Gethin Norman & David Parker (2006): A formal analysis of bluetooth device discovery. International Journal on Software Tools for Technology Transfer (STTT) 8, pp. 621–632, 10.1007/s10009-006-0014-x.
- [25] Uli Fahrenberg, Line Juhl, Kim G. Larsen & Jirí Srba (2011): Energy Games in Multiweighted Automata. In: ICTAC, Lecture Notes in Computer Science 6916, Springer, pp. 95–115, 10.1007/978-3-642-23283-1_9.
- [26] Ansgar Fehnker, Lodewijk van Hoesel & Angelika Mader (2007): Modelling and Verification of the LMAC Protocol for Wireless Sensor Networks. In Jim Davies & Jeremy Gibbons, editors: Integrated Formal Methods, LNCS 4591, Springer Berlin / Heidelberg, pp. 253–272, 10.1007/978-3-540-73210-5_14.
- [27] Thomas Hérault, Richard Lassaigne, Frédéric Magniette & Sylvain Peyronnet (2004): Approximate Probabilistic Model Checking. In: VMCAI, LNCS 2937, Springer, pp. 73–84, 10.1007/978-3-540-24622-0_8.
- [28] D. N. Jansen, J. Katoen, M. Oldenkamp, M. Stoelinga & I. S. Zapreev (2008): How Fast and Fat Is Your Probabilistic Model Checker? An Experimental Performance Comparison. In: Haifa Verification Conference, LNCS 4899, Springer, pp. 69–85, 10.1007/978-3-540-77966-7_9.
- [29] Cyrille Jégourel, Axel Legay & Sean Sedwards (2012): Cross-entropy optimisation of importance sampling parameters for statistical model checking. CoRR abs/1201.5229.
- [30] Sumit Kumar Jha, Edmund M. Clarke, Christopher James Langmead, Axel Legay, André Platzer & Paolo Zuliani (2009): A Bayesian Approach to Model Checking Biological Systems. In: CMSB, LNCS 5688, Springer, pp. 218–234, 10.1007/978-3-642-03845-7_15.
- [31] M. Z. Kwiatkowska, G. Norman & D. Parker (2004): PRISM 2.0: A Tool for Probabilistic Model Checking. In: QEST, IEEE, pp. 322–323.
- [32] Marta Kwiatkowska, Gethin Norman & Jeremy Sproston (2003): Probabilistic Model Checking of Deadline Properties in the IEEE 1394 FireWire Root Contention Protocol. Formal Aspects of Computing 14, pp. 295–318, 10.1007/s001650300007.
- [33] Oded Maler, Kim G. Larsen & Bruce H. Krogh (2010): On Zone-Based Analysis of Duration Probabilistic Automata. In: INFINITY, EPTCS 39, pp. 33–46.
- [34] João Martins, André Platzer & João Leite (2011): Statistical Model Checking for Distributed Probabilistic-Control Hybrid Automata with Smart Grid Applications. In: ICFEM, Lecture Notes in Computer Science 6991, Springer, pp. 131–146.
- [35] P. McDermott-Wells (2005): What is Bluetooth? Potentials, IEEE 23(5), pp. 33 – 35, 10.1109/MP.2005.1368913.
- [36] Johan Oudinet, Alain Denise, Marie-Claude Gaudel, Richard Lassaigne & Sylvain Peyronnet (2011): Uniform Monte-Carlo Model Checking. In: FASE, Lecture Notes in Computer Science 6603, Springer, pp. 127–140, 10.1007/978-3-642-19811-3_10.
- [37] Koushik Sen, Mahesh Viswanathan & Gul Agha (2004): Statistical Model Checking of Black-Box Probabilistic Systems. In: CAV, LNCS 3114, Springer, pp. 202–215, 10.1007/978-3-540-27813-9_16.
- [38] Mariëlle Stoelinga (2003): Fun with FireWire: A Comparative Study of Formal Verification Methods Applied to the IEEE 1394 Root Contention Protocol. Formal Aspects of Computing 14, pp. 328–337, 10.1007/s001650300009.
- [39] L.F.W. van Hoesel & P.J.M. Havinga (2004): A Lightweight Medium Access Protocol (LMAC) for Wireless Sensor Networks: Reducing Preamble Transmissions and Transceiver State Switches. In: 1st International Workshop on Networked Sensing Systems (INSS, Society of Instrument and Control Engineers (SICE), Tokio, Japan, pp. 205–208. Available at http://doc.utwente.nl/64756/.
- [40] R. Wald (2004): Sequential Analysis. Dove Publisher.
- [41] Håkan L. S. Younes (2005): Verification and Planning for Stochastic Processes with Asynchronous Events. Ph.D. thesis, Carnegie Mellon.
- [42] Håkan L. S. Younes, Marta Z. Kwiatkowska, Gethin Norman & David Parker (2006): Numerical vs. statistical probabilistic model checking. STTT 8(3), pp. 216–228, 10.1007/s10009-005-0187-8.