The influence of rotation on optical emission profiles of O stars
Abstract
We study the formation of photospheric emission lines in O stars and show that the rectangular profiles, sometimes double peaked, that are observed for some stars are a direct consequence of rotation, and it is unnecessary to invoke an enhanced density structure in the equatorial regions. Emission lines, such as N iv 4058 and the N iii 4634-4640-4642 multiplet, exhibit non-standard “limb darkening” laws. The lines can be in absorption for rays striking the center of the star and in emission for rays near the limb. Weak features in the flux spectrum do not necessarily indicate an intrinsically weak feature – instead the feature can be weak because of cancellation between absorption in “core” rays and emission from rays near the limb. Rotation also modifies line profiles of wind diagnostics such as He ii 4686 and H and should not be neglected when inferring the actual stratification, level and nature of wind structures.
keywords:
radiative transfer – stars: atmospheres – stars: early-types – line:formation — line: profiles1 Introduction
Many O stars exhibit rapid rotation that broadens their line profiles. In the absence of a wind, the influence of rotation can be accurately computed by integrating the intensities from the stellar disk with allowance for the projected velocity in the direction of the observer. For convenience, and speed, it is customary to allow for the effects of rotation by convolving the flux spectrum with a rotational broadening function that accounts for limb darkening. This procedure, which assumes that the line profile does not change across the disk (i.e., the continuum and line have the same limb darkening laws) (e.g., Gray, 1992), generally works very well. As our own tests have shown, the simple convolution procedure is sufficiently accurate for the majority of photospheric absorption profiles in O stars, although for the most precise work the disk integration procedure should be used.
In general, O stars exhibit a wind which modifies the photospheric H profile (possibly driving H into emission) and generates numerous UV P Cygni profiles. Because the wind is extended, and because the rotation rate declines with radius, the simple convolution technique is not valid. In such a case it is necessary to take the 2D structure of the wind into account. In the simplest case one can assume that rotation simply affects the velocity structure of the wind while maintaining an almost spherical structure, while for rapid rotation it is expected that the density structure will also be altered. How the 2D density structure is altered is very complex, and depends on the rotation rate relative to the critical rotation rate, the rotation rate relative to the terminal wind velocity, and the closeness of the star to the Eddington limit. Depending on their values, it is possible to get either density enhancements in the equatorial or polar flows (Maeder & Meynet, 2000). A prolate wind structure is expected unless the number of lines (or more correctly the flux [line] mean opacity) increases sufficiently rapidly towards the equator to overcome the decreasing equatorial flux arising from gravity darkening (e.g., Maeder & Meynet, 2000).
In many O stars intense N iii 4634–4642 emission is seen and is used as a criterion to define the so-called “f” class (Walborn, 1971; Sota et al., 2011). When resolved, these lines can show a rectangular (or trapezoidal-like) profile111For simplicity we refer to these profiles as non-Gaussian, while other profiles will be referred to as Gaussian, even if they do not exhibit extended wings., with the stronger components exhibiting a double peaked structure. In the spectra of O supergiants presented by Bouret et al. (2012), Pup, HD 16691, and HD 210839 show broad, non-gaussian profiles for the N iii multiplet, although HD 15570, HD 163758 and HD 192639 exhibit more gaussian-like profiles. The mechanisms driving the N iii lines into emission have been discussed previously by Rivero González et al. (2011). The dominant mechanism depends on the precise stellar parameters – both continuum fluorescence (e.g., the Swings mechanism, Bruccato & Mihalas 1971) and dielectronic recombination (previously discussed for these lines by Mihalas et al. 1972) can be important. Rivero González et al. (2011) also indicate that the strength of the lines can be influenced by interactions between the N iii and O iii resonance lines.
In this paper we discuss the profiles of photospheric emission lines in O stars, and show that rotation can produce rectangular-like profiles that often exhibit double-peaked profiles. The phenomena is not restricted to the N iii 4634–4642 complex — in PupN iv 4058 and Si iv 4089,4116 also exhibit non-gaussian profiles. We show that the observed line profiles are a direct consequence of the lines being photospheric and being in emission. The lines do not show “classic” limb darkening – rather the intensity distribution across the star can be flat, and may even show limb brightening. In addition, we further examine the influence of rotation on the H and He ii 4686 line profiles. Rotation produces observable effects on the line profiles, and these effects are seen. Because of the influence of rotation on the wind velocity law (which is now 2D) wind line profiles potentially depend on both and rather than . To model these emission lines on O stars, it is absolutely essential to properly account for the effects of rotation in O stars that exhibit rapid rotation. It is especially true for rapid rotators such as Pup which has .
2 Previous Work
The influence of rotation on O star profiles has been the subject of several different studies. Petrenz & Puls (1996) studied the influence of rotation on H. Their work was mainly concerned with the influence of rotation on the wind profile. Rotation directly influences the velocity structure (the velocity along a given sight line is not necessarily monotonic) and can potentially alter the density structure of the wind through direct means (as in the wind-compressed disk (WCD) model of Bjorkman & Cassinelli (1993)) or indirectly by introducing a latitudinal variation of temperature and surface gravity which then causes a latitudinal variation of the mass loss rate and the velocity law.
In the work of Petrenz & Puls (1996) emission in H was significantly modified by the enhancement of density in the equatorial plane arising from the WCD effect. However, this effect was likely substantially overestimated — Owocki et al. (1998) showed that non-radial forces will inhibit both the formation of a wind-compressed disk and a wind-compressed region. As a consequence, the most important influence of rotation on the wind arises from rotation introducing a latitudinal dependence of temperature and surface gravity, but this effect remains relatively small unless . Two potentially important effects for wind lines are the decrease of with which reduces the influence of rotational broadening on wind lines, and the resonance-zone effect which arises because rotation introduces a non-monotocity in the velocity law along some sightlines (Petrenz & Puls, 1996). Given the current uncertainties in our understanding of 1D winds, it is fair to say that the structure of 2D winds, and the azimuthal variation of density and mass-loss, is still very uncertain.
Another study of the influence of rotation on line profiles in O stars was made by Busche & Hillier (2005). They examined a range of profiles, showed that the absorption profiles were adequately modeled via the convolution technique, and confirmed the important influence of rotation on H and He ii 4686 line profiles. While the analysis was general, and applied to the whole spectrum, they did not study the formation of photospheric emission lines.
3 Technique
To study the influence of rotation we use the 2D code developed by Busche & Hillier (2005). This code computes the formal solution (and hence line profiles) for axisymmetric 2D winds. It uses as input 1D opacities and emissivities computed with the 1D formal solution code, CMF_FLUX (Busche & Hillier, 2005). It has been parallelized, and runs efficiently on workstations with multiple processors.
In the present calculation we assume that rotation does not influence the density structure — this assumption is a reasonable first approximation since the rotation rates are less than 50% of the critical rotation rate, and much less than the wind terminal velocities. We also neglect the latitudinal variation of temperature and surface gravity with latitude — these are likely not to have a large effect since the rotational velocity of most O stars is generally a factor of 2 (or more) less than the critical rotational velocity. Following the work of Busche & Hillier (2005) we assume that the star rotates as a solid body below 20 km s-1, and that angular momentum about the center of the star is “conserved” at higher velocities (that is, ). Following the work of Owocki et al. (1998) we assume non-radial forces inhibit disk formation and hence set the polar velocity component to zero. The last two assumptions only influence the formation of wind lines – they do not affect photospheric lines. For simplicity, we neglect the influence of rotation on the non-LTE populations – such effects are likely weak, and have been discussed by Petrenz & Puls (2000).
4 Observations and model
To illustrate the influence of rotation we use Puppis which is a fast rotator with . This star has been extensively analyzed, most recently by Bouret et al. (2012). Najarro et al. (2011) have also extensively analyzed this star and obtained similar results. The model parameters we adopt are from the paper of Bouret et al. (2012), and are as follows: K, (centrifugally corrected value of ), yr-1, , , km s-1, N(He)/N(H) , Z(C) , Z(N) and Z(O) (Z denotes mass fraction).222Expressed as number fractions: N(C)/N(H), N(N)/N(H) and N(O)/N(H). and control the clumping in the wind and have little influence on the photospheric profiles. For illustration purposes, we use the same observational data (which covers 3800 to 8800 Å at a resolution of 48,000 and a signal-to-noise in excess of 100 to 1 per pixel) as presented in that paper.
Puppis is an ideal candidate for the study. Its parameters are well known (except for uncertainties induced by the the uncertainty in its distance; see discussion in Schilbach & Röser 2008), and from variability studies it is most likely observed edge on (i.e., rotation axis perpendicular to line of sight; Howarth et al. (1995)). It exhibits several emission lines such as N iv 4058, N iii 4634-4642, and Si iv 4089,4116 that show non-gaussian profiles - generally rectangular but possibly exhibiting enhanced emission near the extremes of the emission profile. Further, C iv 5801, 5812 exhibits complex profiles while both H and He ii are in emission.
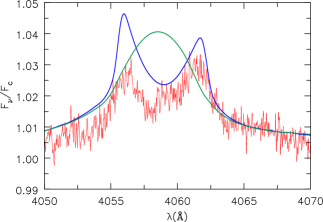
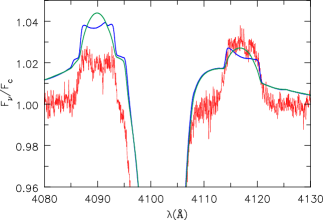
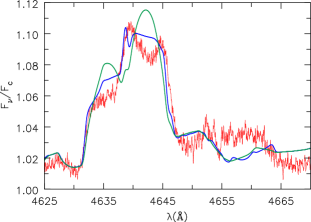
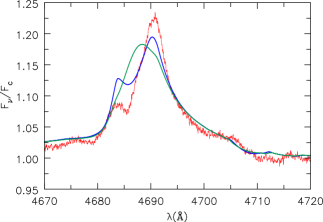
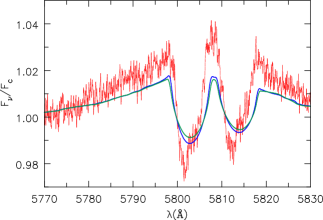
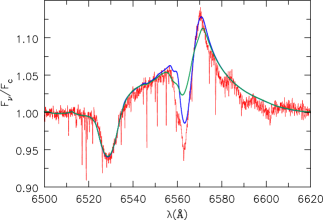
Observed profiles for a selection of lines in Pup are shown in Fig, 1. Also shown are the profiles obtained from a simple convolution of the 1D model flux with the rotation profile, and the profile computed from a full integration of the intensities across the disk of the star (hereafter disk profiles). For simplicity we adopted a macroturbulent velocity333The use of a (constant) macroturbulent velocity is, of course, another approximation which will modify line profiles and hence influence conclusions that can be drawn from them. of 0 km s-1(Bouret et al. 2012 adopted 90 km s-1) and a rotation velocity of 240 km s-1 (and ) to better match the width of the rectangular emission profiles rather than the 210 km s-1 adopted by Bouret et al. (2012). As readily apparent, the disk profiles generally show much better agreement with the observed profiles than do the profiles obtained through convolution. In particular, N iv 4058 exhibits a double peaked profile, as observed. Similarly, the N iii lines show rectangular profiles. Lines affected by the wind also show improvements in profile shapes — He ii 4686 exhibits evidence for “absorption” on the blue side which is clearly seen in the observation but is not present in the profiles created by convolution. Profiles computed assuming a higher rotation velocity of and so that are essentially identical to those computed using the lower rotation velocity. In reality, since the wind and star properties would change with such a high rotation rate, the profiles would not be identical.
It is not surprising that the convolution procedure does not work well for H and He ii . Both lines are significantly influenced by the wind, and line transfer in the wind will be significantly affected by the presence of rotation.
From Fig, 1 is is apparent that predicted disk profiles do not agree precisely with those observed. This likely arises because of errors in the adopted stellar parameters and abundances, errors in the atomic data, and missing physics. A full discussion of the uncertainties associated with the parameters of Pup has been given by Bouret et al. (2012). As the purpose of this paper is to understand the physics giving rise to the observed rectangular profiles, and to re-examine the influence of rotation, we do not attempt to readjust model parameters. We note, for example, that the absorption associated with H is sensitive to the radial variation of clumping with radius (Hillier et al., 2003; Puls et al., 2006; Najarro et al., 2011) and porosity effects (Sundqvist et al., 2011). Our own work on O supergiants (Bouret et al., 2012) also shows that it is model sensitive (it varies significantly when the stellar parameters are varied over their error range).
To understand the observed emission line profile, and why convolution does not work we consider N iv 4058. In Fig. 2 we show the intensity variation at line center (no rotation) and in the adjacent continuum as a function of impact parameter. As apparent, the intensity variation in the continuum and the line is very different — the continuum shows “classic” limb darkening, while the intensity in N iv 4058 is almost flat. Since the “limb darkening laws” for the continuum and line differ substantially, we cannot use the simple convolution procedure to obtain the profile when the star is rotating. Rather, the observed line profile must be obtained by integrating the intensities across the disk.
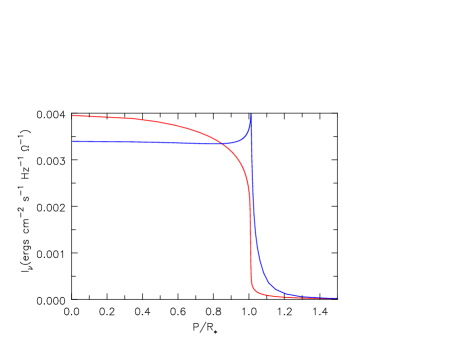
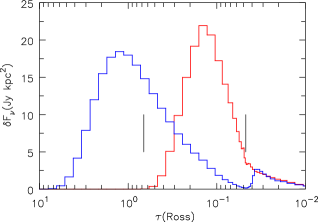
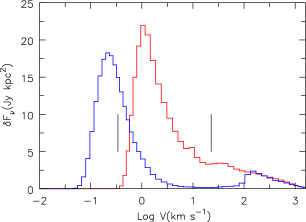
From Fig. 2 it is also apparent that the wind makes relatively little contribution to N iv 4058. N iv 4058 is a photospheric emission line, and is in emission because of non-LTE effects. In Fig. 3 we illustrate the origin of the N iv 4058 as a function of the Rosseland mean optical depth, and velocity. This diagram also confirms that N iv 4058 is photospheric — the bulk of the line originates inside 10 km s-1.
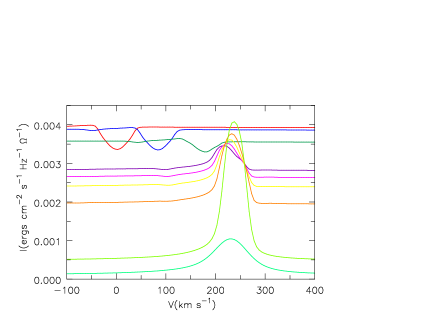
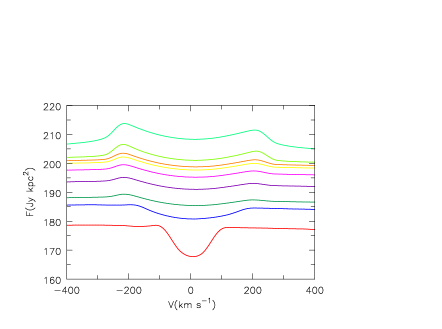
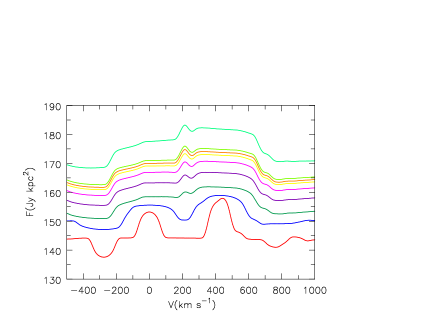
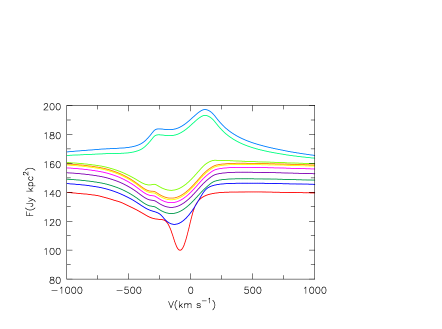
To better understand why N iv 4058 exhibits a non-gaussian profile we can examine the center-to-limb variation of the intensities as a function of velocity, and this is shown in Fig. 5 for a range of impact parameters. As readily apparent, the N iv 4058 profile shows substantial variation with impact parameter – for the core ray the line is in absorption while it is strongly in emission near the limb. Since the observed flux is a complicated weighting of the intensities, we illustrate in Fig. 5 the growth in the spectrum with impact parameter. When integrated over the inner core rays (for all azimuthal angles) we see an absorption line spectrum, but as we extend the integration zone to higher impact parameters we begin to see emission, and eventually we get the double peaked profile, similar to what is observed.
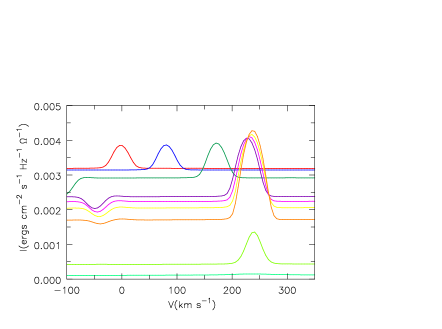
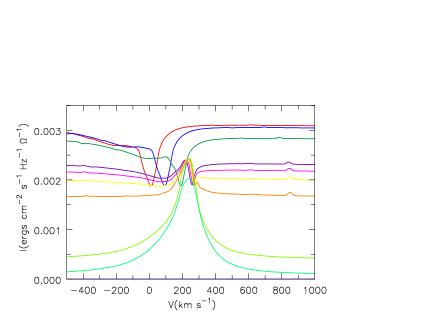
Another line that exhibits a rectangular-shaped profile is N iii 4634. While the line is in emission at all impact parameters (Fig. 7), it is much more in emission at the limb. It is this enhanced emission from “large” impact parameters that changes the profile shape from Gaussian to rectangular (Fig. 7).
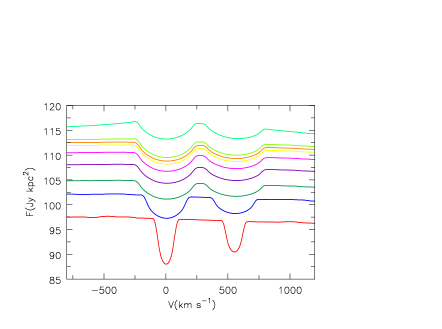
To complete our study we illustrate two other lines. The first is C iv 5801 which shows an absorption component together with extended wind emission. In many O stars this line is very difficult to model, being sensitive to both line blanketing (Bouret et al., 2012) and model parameters. This line, like N iv 4058, is in absorption for core rays (Fig. 9), but in emission for rays near the limb. However, in contrast to N iv 4058, the line remains in absorption longer (i.e., to higher impact parameters) before switching to emission. The central part of the line in the full spectrum thus remains in absorption (Fig. 9). Careful study of Fig. 9 reveals extended emission line wings arising from the wind. Given the transition from absorption to emission as we move to higher impact parameters, and since what we observed is a weighted sum of this variation, it is not surprising that the line is model sensitive.
From Fig. 1 we see that the C iv absorption profiles are narrower than what one would predict based of the rotation rate of the stars. Although not so evident in the current model, disk profiles for C iv 5801 are generally narrower than those obtained via convolution. To get a better match for the present model would require stronger C iv absorption for core rays, and (possibly) enhanced emission for the limb rays. Because the absorption is preferentially confined to the core rays, the full disk absorption profiles would be narrower than for pure absorption lines.
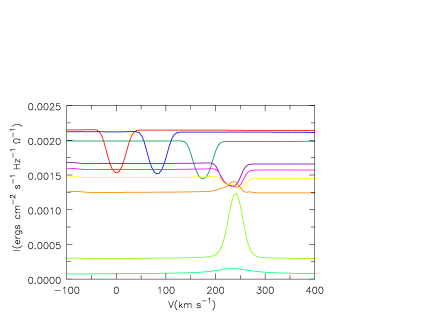
The final line studied is He ii 4686. This line exhibits strong emission, but in Pup (and some other stars) it shows a notch on the blue side. As shown in Fig. 1, this notch can be explained by correctly accounting for the effects of rotation. Like N iv 4058 and C iv 5801 this line also transitions from absorption for low impact parameters to emission for high impact parameters (Fig. 11). However there are important distinctions in its behavior from these two lines. First, we see extended absorption to the blue, arising from the stellar wind. Second, wind emission is very important and is what drives the line into emission (Fig. 11).
5 Conclusion
We have demonstrated that rotation alone can explain the rectangular profiles, sometimes double-peaked, that are observed for some optical emission lines in O stars. It is not necessary to invoke departures of the density structure from spherical symmetry to explain these profiles. To properly compute the emission line profiles, it is necessary to integrate the intensities across the rotating stellar disk – the classic convolution of the flux does not work because the line profiles vary substantially across the stellar disc (i.e., with impact parameter). In some cases the line is in absorption for rays striking the center of the star, while it is strongly in emission for rays near the limb. For N iv 4058 in Pup, the observed weak double peaked profile is actually a result of near perfect cancellation between absorption at low impact parameters, and emission at high impact parameters. This illustrates that the variation in intensity with impact parameter can provide additional insights into line formation.
From their study of the N iii lines in HD 16691, De Becker et al. (2009) concluded that the lines arise from close to the star in a large scale corotating structure. While we confirm that rotation is crucial in explaining the observed line shapes, we find that the N iii lines are primely of photospheric origin in these supergiants and that rotation alone can explain their observed shapes.
For most analyses it is adequate to use the normal convolution technique when modeling absorption lines. However, there are subtle differences between disk profiles, and the profiles obtained with convolution, and these could be important when using absorption lines to study line asymmetries and the possible influence of the velocity field at the base of the wind. Following a suggestion by Francisco Najarro, and due to the intense interest with the mass of the most massive stars, we also ran a model for R136a3, which was found by Crowther et al. (2010) to have an initial mass of and a km s-1. Profiles computed using a 2D model to take into account rotation showed only small differences from profiles computed using the convolution technique, and are too small to significantly affect conclusions drawn by Crowther et al. (2010).
Although already well known, we also highlighted the influence rotation has on main optical wind diagnostics – H and He ii 4686. While the correct allowance for rotation does not fundamentally alter the line strength (and hence, for example, inferred mass-loss rates) it does significantly alter the line profile. This is of crucial importance – it means that H and He ii 4686 emission line profiles in rapidly rotating O stars cannot be used to infer variations in clumping with distance and the importance of velocity-porosity unless rotation is accurately taken into account. Further, rotation will influence the accuracy of parameters, such as (in the classic wind-law ).
The correct treatment of rotation is also important for UV resonance lines formed in the wind. As photospheric lines can influence the resonance line profiles, it is important to take rotation into account. However, a simple convolution overestimates the effect of rotation on the wind lines and can adversely affect estimates of the terminal velocity, and microturbulence within the wind.
Since it is relatively easy to treat the gross influence of rotation accurately, this should become the norm in future studies of O stars. Issues related to the influence of rotation on the azimuthal density structure, and the dependence of clumping parameters on rotation, will require further studies.
acknowledgements
DJH acknowledges support from NASA ADP Grant: NNG04GC81G, STScI theory grant HST-AR-11756.01.A and HST-AR-12640.01. STScI is operated by the Association of Universities for Research in Astronomy, Inc., under NASA contract NAS5-26555. J.-C. Bouret thanks the French Agence Nationale de la Recherche (ANR) for financial support. The authors thank the referee, Joachim Puls, for his suggestions, and his careful reading of the paper. The authors would also like to thank Francisco Najarro for comments on a draft of the paper.
References
- Bjorkman & Cassinelli (1993) Bjorkman, J. E. & Cassinelli, J. P. 1993, ApJ, 409, 429
- Bouret et al. (2012) Bouret, J.-C., Hillier, D. J., Lanz, T., & Fullerton, A. W. 2012, A&A, submitted
- Bruccato & Mihalas (1971) Bruccato, R. J. & Mihalas, D. 1971, MNRAS, 154, 491
- Busche & Hillier (2005) Busche, J. R. & Hillier, D. J. 2005, AJ, 129, 454
- Crowther et al. (2010) Crowther, P. A., Schnurr, O., Hirschi, R., Yusof, N., Parker, R. J., Goodwin, S. P., & Kassim, H. A. 2010, MNRAS, 408, 731
- De Becker et al. (2009) De Becker, M., Rauw, G., & Linder, N. 2009, ApJ, 704, 964
- Gray (1992) Gray, D. F. 1992, The observation and analysis of stellar photospheres. (Cambridge University Press)
- Hillier et al. (2003) Hillier, D. J., Lanz, T., Heap, S. R., Hubeny, I., Smith, L. J., Evans, C. J., Lennon, D. J., & Bouret, J.-C. 2003, ApJ, 588, 1039
- Howarth et al. (1995) Howarth, I. D., Prinja, R. K., & Massa, D. 1995, ApJL, 452, L65
- Maeder & Meynet (2000) Maeder, A. & Meynet, G. 2000, A&A, 361, 159
- Mihalas et al. (1972) Mihalas, D., Hummer, D. G., & Conti, P. S. 1972, ApJL, 175, L99
- Najarro et al. (2011) Najarro, F., Hanson, M. M., & Puls, J. 2011, A&A, 535, A32
- Owocki et al. (1998) Owocki, S. P., Cranmer, S. R., & Gayley, K. G. 1998, Ap&SS, 260, 149
- Petrenz & Puls (1996) Petrenz, P. & Puls, J. 1996, A&A, 312, 195
- Petrenz & Puls (2000) —. 2000, A&A, 358, 956
- Puls et al. (2006) Puls, J., Markova, N., Scuderi, S., Stanghellini, C., Taranova, O. G., Burnley, A. W., & Howarth, I. D. 2006, A&A, 454, 625
- Rivero González et al. (2011) Rivero González, J. G., Puls, J., & Najarro, F. 2011, A&A, 536, A58
- Schilbach & Röser (2008) Schilbach, E. & Röser, S. 2008, A&A, 489, 105
- Sota et al. (2011) Sota, A., Maíz Apellániz, J., Walborn, N. R., Alfaro, E. J., Barbá, R. H., Morrell, N. I., Gamen, R. C., & Arias, J. I. 2011, ApJS, 193, 24
- Sundqvist et al. (2011) Sundqvist, J. O., Puls, J., Feldmeier, A., & Owocki, S. P. 2011, A&A, 528, A64
- Walborn (1971) Walborn, N. R. 1971, ApJS, 23, 257